If you’ve ever wondered how your website is performing compared to the competition, our new Benchmarking reports in Google Analytics will help you find out.
Analytics users can now compare their results to peers in their industry, choosing from 1600 industry categories, 1250 markets and 7 size buckets. Benchmarking leverages the footprint of Google Analytics and can help you set meaningful targets, spot trends occurring across industries and answer a whole array of questions: Which channels should you be investing more in? How does your mobile engagement compare to your peers? How unique is your audience?
The new Benchmarking reports display acquisition and engagement metrics — like sessions and bounce rate — by Channel, Location, or Device Category dimensions. To ensure total data transparency, the number of properties contributing to the benchmark is displayed once you choose the industry, market and size. A helpful heat map feature makes it easy to see areas of strength and opportunity, and where to devote more resources.
Benchmarking in Action: Twiddy Finds a New Email Marketing Opportunity
Twiddy.com, a vacation rentals company in the Outer Banks-- a popular summer getaway destination-- has been using Benchmarking reports to help focus its marketing resources. A look at their peer benchmarks by channel showed that Twiddy was doing many things well during its peak summer booking season. Still, “it was clear we were missing a huge opportunity in email marketing,” reports CMO Ross Twiddy. His team used Google Analytics data to revamp their email marketing and improve the flow and process.
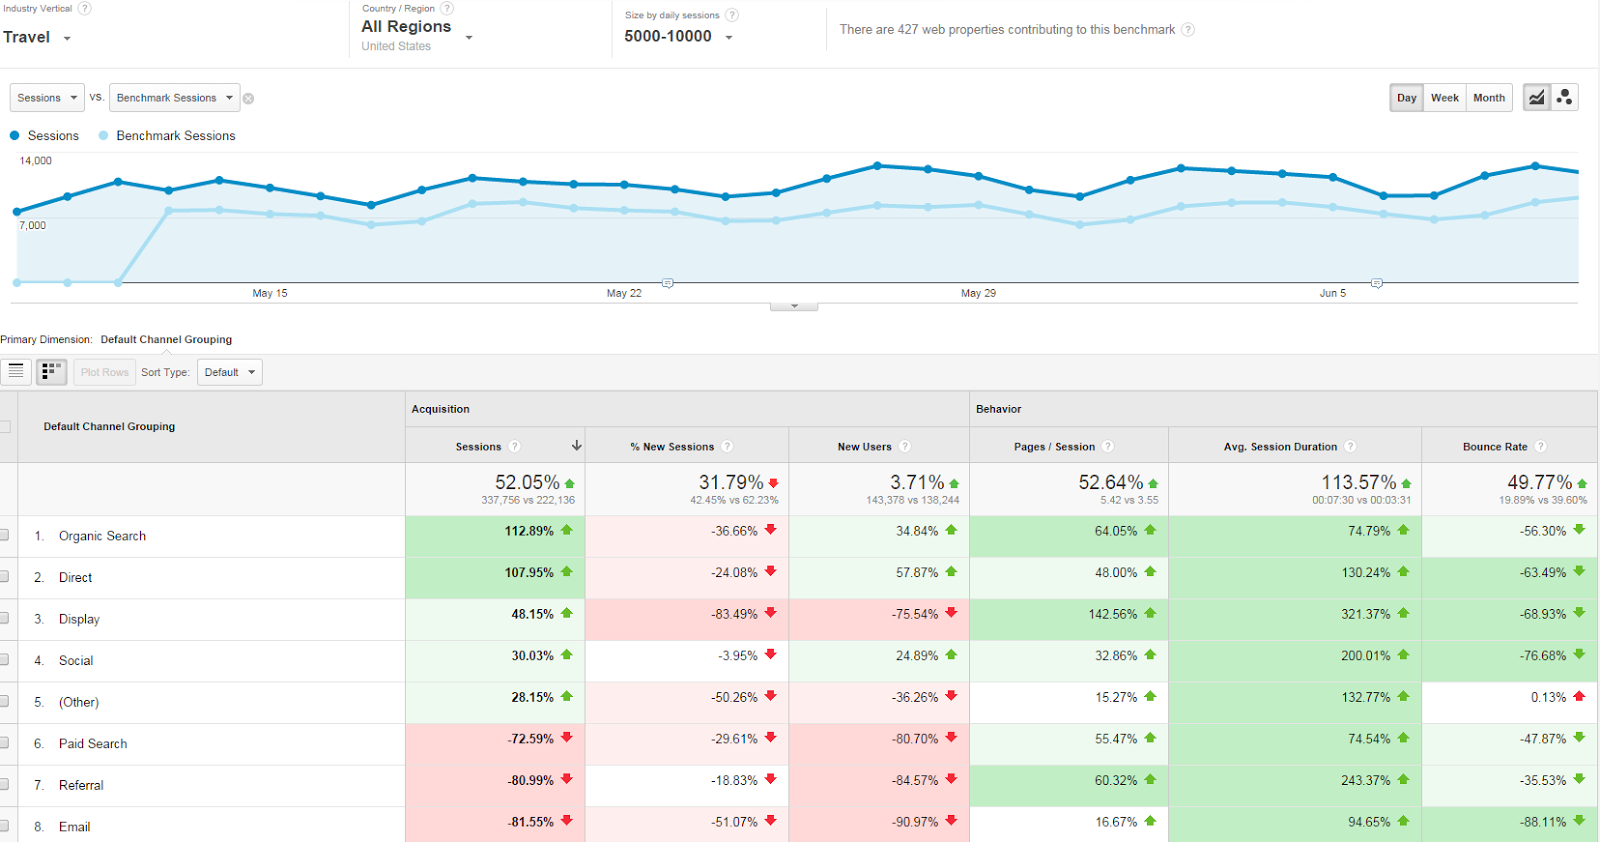
Email opportunity: Visitors from email spend nearly twice as long on site as the average, but user sessions generated from email are 82% below average and new users from the channel fall 91% below similar sites.
Twiddy even used Google Analytics to choose the best-selling messages for their email campaigns. Their analysis helped them zero in on the factors that were most consistent in repeat bookings: the price range, location, rental type, and even vacation week that would be most likely to convert with for each customer. "We launched an email last week based on our findings, and it shattered our email marketing records: a 48% average open rate and a 40% clickthrough rate,” says Ross.
Twiddy is happy with the new visibility they’ve gained: “The Benchmarking reports were powerful enough for us to reallocate time, budget and resources towards running down the deficiency. We can’t wait to start testing the reports out more broadly during the next peak booking season.”
Get Started with Benchmarking
Benchmarking reports can be found in the “Audience” section of the reporting interface and are rolling out over the next few weeks to all Google Analytics users who have opted in to share their data anonymously. If you want to join in, simply check the “Share anonymously with Google and others” box in the Account Settings tab of your account admin page. This is only the beginning for benchmarking within Google Analytics. We’ll be expanding these capabilities in the coming months, both incorporating conversion metrics and adding support for mobile apps. For more information on Benchmarking reports, check out our Help Center.
Posted by: Nikhil Roy, Product Manager, Google Analytics
Posted by: Nikhil Roy, Product Manager, Google Analytics

