Building better products for new internet users

Since the launch of Google’s Next Billion Users (NBU) initiative in 2015, nearly 3 billion people worldwide came online for the very first time. In the next four years, we expect another 1.2 billion new internet users, and building for and with these users allows us to build better for the rest of the world.

For this year’s I/O, the NBU team has created sessions that will showcase how organizations can address representation bias in data, learn how new users experience the web, and understand Africa’s fast-growing developer ecosystem to drive digital inclusion and equity in the world around us.

We invite you to join these developers sessions and hear perspectives on how to build for the next billion users. Together, we can make technology helpful, relevant, and inclusive for people new to the internet.

Session: Building for everyone: the importance of representative data

Mike Knapp, Hannah Highfill and Emila Yang from Google’s Next Billion Users team, in partnership with Ben Hutchinson from Google’s Responsible AI team, will be leading a session on how to crowdsource data to build more inclusive products.

Data gathering is often the most overlooked aspect of AI, yet the data used for machine learning directly impacts a project’s success and lasting potential. Many organizations—Google included—struggle to gather the right datasets required to build inclusively and equitably for the next billion users. “We are going to talk about a very experimental product and solution to building more inclusive technology,” says Knapp of his session. “Google is testing a paid crowdsourcing app [Task Mate] to better serve underrepresented communities. This tool enables developers to reach ‘crowds’ in previously underrepresented regions. It is an incredible step forward in the mission to create more inclusive technology.”

Bookmark this session to your I/O developer profile.

Session: What we can learn from the internet’s newest users

“The first impression that your product makes matters,” says Nicole Naurath, Sr. UX Researcher - Next Billion Users at Google. “It can either spark curiosity and engagement, or confuse your audience.”

Everyday, thousands of people are coming online for the first time. Their experience can be directly impacted by how familiar they are with technology. People with limited digital experience, or novice internet users, experience the web differently and sometimes developers are not used to building for them. Design elements such as images, icons, and colors play a key role in digital experience. If images are not relatable, icons are irrelevant, and colors are not grounded in cultural context, the experience can confuse anyone, especially someone new to the internet.

Nicole Naurath and Neha Malhotra, from Google’s Next Billion Users team, will be leading the session on what we can learn from the internet’s newest users, how users experience the web and share a framework for evaluating products that work for novice internet users.”

Bookmark this session to your I/O developer profile.

Session: Africa’s booming developer ecosystem

Software developers are the catalyst for digital transformation in Africa. They empower local communities, spark growth for businesses, and drive innovation in a continent which more than 1.3 billion people call home. Demand for African developers reached an all-time high last year, driven by both local and remote opportunities, and is growing even faster than the continent's developer population.

Andy Volk and John Kimani from the Developer and Startup Ecosystem team in Sub-Saharan Africa will share findings from the Africa Developer Ecosystem 2021 report.

In their words, “This session is for anyone who wants to find out more about how African developers are building for the world or who is curious to find out more about this fast-growing opportunity on the continent. We are presenting trends, case studies and new research from Google and its partners to illustrate how people and organizations are coming together to support the rapid growth of the developer ecosystem.”

Bookmark this session to your I/O developer profile.

To learn more about Google’s Next Billion Users initiative, visit nextbillionusers.google

One step closer to a passwordless future

Today passwords are essential to online safety, but threats like phishing, scams, and poor password hygiene continue to pose a risk to users. Google has long recognized these issues, which is why we have created defenses like 2-Step Verification and Google Password Manager.

However, to really address password problems, we need to move beyond passwords altogether, which is why we’ve been setting the stage for a passwordless future for over a decade.

Today, in honor of World Password Day, we’re announcing a major milestone in this journey: We plan to implement passwordless support for FIDO Sign-in standards in Android & Chrome. Apple and Microsoft have also announced that they will offer support for their platforms. This will simplify sign-ins across devices, websites, and applications no matter the platform — without the need for a single password. These capabilities will be available over the course of the coming year.

How will a passwordless future work?

When you sign into a website or app on your phone, you will simply unlock your phone — your account won’t need a password anymore.

Instead, your phone will store a FIDO credential called a passkey which is used to unlock your online account. The passkey makes signing in far more secure, as it’s based on public key cryptography and is only shown to your online account when you unlock your phone.

To sign into a website on your computer, you’ll just need your phone nearby and you’ll simply be prompted to unlock it for access. Once you’ve done this, you won’t need your phone again and you can sign in by just unlocking your computer. Even if you lose your phone, your passkeys will securely sync to your new phone from cloud backup, allowing you to pick up right where your old device left off.

Image collage of password free devices

Paving the way to passwordless

The passkey will bring us much closer to the passwordless future we’ve been mapping out for over a decade.

timeline of password progression

We’re excited for what the passkey future holds. That said, we understand it will still take time for this technology to be available on everyone’s devices and for website and app developers to take advantage of them. Passwords will continue to be part of our lives as we make this transition, so we’ll remain dedicated to making conventional sign-ins safer and easier through our existing products like Google Password Manager.

Security myth busting and spring cleaning

People are constantly being told to strengthen their security habits, but with so much advice — some of it conflicting — it’s hard to understand where to start or what to believe. Perhaps that’s why people go the easy route. Based on a new study we commissioned with Ipsos, nearly 20% of Americans still use common passwords like Password, abc123 and 123456.

So, we’re introducing a twist on spring cleaning this year: a digital cleaning to throw out old security advice and replace it with better practices. In honor of World Password Day today, we encourage everyone to start by leveraging the security protections built directly into our products that make every day Safer with Google.

Out with the old (cybersecurity myths)

As cybersecurity evolves, many of our old fears about it are no longer relevant or even true, especially with ongoing tech innovations. Here are a some of those myths we’re debunking today:

“It’s up to me to spot suspicious links on my own”: Phishing schemes can lead to serious cyber attacks, but by leveraging tech that is secure by default, you’re automatically protected from many of them. If you’re using Chrome or Gmail, we’ll proactively flag known deceptive sites, emails and links before you even click them, and Google Password Manager won’t autofill your credentials if it detects a fraudulent website. With the right security protections, which are set as default in Google products, less of the burden is on you.

“Avoid public Wi-Fi at all costs” The tech industry continues to make improvements to reduce security risks with public Wi-Fi, which has historically been the model for bad security practices. Websites using HTTPS provide secure connections using data encryption. Chrome offers HTTPS-First mode to prioritize those sites and makes it easy to identify protected pages with a lock icon in your web address bar. Use that as a signal for which websites to visit.

“Bluetooth is dangerous”: Bluetooth technology has come a long way since its inception. It’s far more advanced and harder to break into, especially in comparison with other technologies. However some people might still question whether Bluetooth, familiar as a pairing technology, is a secure method to help you sign in. After all, you’re used to seeing nearby devices like your phone or headphones show up on your laptop. But using current Bluetooth standards is very secure, and doesn’t actually involve pairing. It’s used to ensure your phone is near the device you’re signing in to, confirming it’s really you trying to access your account.

“Password managers are risky”: It might seem risky to entrust all your credentials in a single provider, but password managers are designed for security —and if you use ours, built directly into Chrome and Android, then you know it’s secure by default. Our research shows that 65% of people still reuse their credentials for various accounts, password managers solve that problem by creating new passwords for you and ensuring their strength. They’re also increasingly more secure, in fact, we recently launched a new on-device encryption for Google Password Manager, allowing you to keep your passwords more private and protected with your Google Account credentials before they’re sent to us for storage.

“Cybercriminals won’t waste their time targeting me”: You might not be a high-profile figure, but that doesn’t mean you’re not on cybercriminals’ radars. In fact, the everyday person is the perfect target for social engineering, which is when an attacker manipulates you into sharing personal information used for a cyber attack. Social engineers do this for a living and it’s a low cost, low effort way to reach their goals, especially in comparison to physically breaking technology or trying to target someone in the public eye. Protect yourself by being aware of social engineering and taking advantage of products that are secure by default like Gmail, Chrome, etc.

In with the new (digital spring cleaning)

Similar to how you clean out your garage each spring, we encourage you to spruce up your security. Get started with these tips and take a quick Security Checkup, which will guide you through protections that can instantly secure your Google Account.

  • Use 2-Step Verification (2SV): 2SV requires a second form of verification to access your account beyond your password — which could be a code sent to your phone, security key, etc. So, if someone tries to access your account, they will have a much harder time because they’ll need your password and second form of verification. Apply 2SV to secure your Google Account today, which will also cover all the services you use Sign in with Google for, with a simple tap on your device.
  • Use a Password Manager: Now that you know the truth about password managers, use one in addition to 2SV. Google Password Manager, built into Chrome and Android, will store your passwords, auto populate them for sites, create strong passwords, ensure they’re not entered into malicious sites, and alert you when they’re compromised.
  • Setup Account Recovery: Things happen, we lose our phones, forget our passwords, etc., so it’s critical to have recovery in place to gain access to your account in the event you’re locked out. This is especially true since other accounts utilize your email as a recovery method, so by keeping your Google Account recoverable, you do so for your other accounts as well. We’re also working to eliminate more inactive accounts for the safety of our users, so if your account becomes inactive and we take action, recovery and 2SV enablement will ensure you don’t lose data. Add a recovery email and phone number to your accounts today and sign up for Inactive Account Manager in addition to 2SV.
  • Install Updates: Finally, apply all those updates you’ve been putting off across your devices. Software updates often address critical security vulnerabilities, and with cyber threats on the rise, they’re more important than ever. Remember, there’s no IT team dedicated to maintaining your security like there may be at work, so it’s up to you to protect yourself at home. Take time to survey your mobile device, router, computer, etc., for updates.

We know security news will continue to flood your feeds today, but keep these tips in mind and freshen up your security this spring. For more security tips, and to learn about all the ways we make every day Safer with Google, visit ourSafety Center.

Mosquitos get the swat with new forecasting technology

Mosquitoes aren’t just the peskiest creatures on Earth; they infect more than 700 million people a year with dangerous diseases like Zika, Malaria, Dengue Fever, and Yellow Fever. Prevention is the best protection, and stopping mosquito bites before they happen is a critical step.

SC Johnson — a leading developer and manufacturer of pest control products, consumer packaged goods, and other professional products — has an outsized impact in reducing the transmission of mosquito-borne diseases. That’s why Google Cloud was honored to team up with one of the company’s leading pest control brands, OFF!®, to develop a new publicly available, predictive model of when and where mosquito populations are emerging nationwide. 

As the planet warms and weather changes, OFF! noticed month-to-month and year-to-year fluctuations in consumer habits at a regional level, due to changes in mosquito populations. Because of these rapid changes, it’s difficult for people to know when to protect themselves. The OFF!Cast Mosquito Forecast™, built on Google Cloud and available today, will predict mosquito outbreaks across the United States, helping communities protect themselves from both the nuisance of mosquitoes and the dangers of mosquito-borne diseases — with the goal of expanding to other markets, like Brazil and Mexico, in the near future. 

An animated gif titled ‘Mosquito Habitat: Current & Projected’ shows projections for the number of months per year when disease transmission from the Aedes aegypti mosquito is possible as it increases over time from 2019 to 2080. The projection is based on a worst-case scenario in which the impact of climate change is unmitigated.

Source: Sadie J. Ryan, Colin J. Carlson, Erin A. Mordecai, and Leah R. Johnson

With the OFF!Cast Mosquito Forecast™, anyone can get their local mosquito prediction as easily as a daily weather update. Powered by Google Cloud’s geospatial and data analytics technologies, OFF!Cast Mosquito Forecast is the world’s first public technology platform that predicts and shares mosquito abundance information. By applying data that is informed by the science of mosquito biology, OFF!Cast accurately predicts mosquito behavior and mosquito populations in specific geographical locations.

Starting today, anyone can easily explore OFF!Cast on a desktop or mobile device and get their local seven-day mosquito forecast for any zip code in the continental United States. People can also sign up to receive a weekly forecast. To make this forecasting tool as helpful as possible, OFF! modeled its user interface after popular weather apps, a familiar frame of reference for consumers.

Animated gif shows how you enter your zip code into the Off!Cast Mosquita forecast to see a 7-day mosquito forecast for your area, similar to a weather forecast. It shows the mosquito forecast range from medium, high to very high.

SC Johnon’s OFF!Cast platform gives free, accurate and local seven-day mosquito forecasts for zip codes across the continental United States.

The technology behind the OFF!Cast Mosquito Forecast

To create this first-of-its-kind forecast, OFF! stood up a secure and production-scale Google Cloud Platform environment and tapped into Google Earth Engine, our cloud-based geospatial analysis platform that combines satellite imagery and geospatial data with powerful computing to help people and organizations understand how the planet is changing. 

The OFF!Cast Mosquito Forecast is the result of multiple data sources coming together to provide consumers with an accurate view of mosquito activity. First, Google Earth Engine extracts billions of individual weather data points. Then, a scientific algorithm co-developed by the SC Johnson Center for Insect Science and Family Health and Climate Engine experts translates that weather data into relevant mosquito information. Finally, the collected information is put into the model and distilled into a color-coded, seven-day forecast of mosquito populations. The model is applied to the lifecycle of a mosquito, starting from when it lays eggs to when it could bite a human.

It takes an ecosystem to battle mosquitos

Over the past decade, academics, scientists and NGOs have used Google Earth Engine and its earth observation data to make meaningful progress on climate research, natural resource protection, carbon emissions reduction and other sustainability goals. It has made it possible for organizations to monitor global forest loss in near real-time and has helped more than 160 countries map and protect freshwater ecosystems. Google Earth Engine is now available in preview with Google Cloud for commercial use.

Our partner, Climate Engine, was a key player in helping make the OFF!Cast Mosquito Forecast a reality. Climate Engine is a scientist-led company that works with Google Cloud and our customers to accelerate and scale the use of Google Earth Engine, in addition to those of Google Cloud Storage and BigQuery, among other tools. With Climate Engine, OFF! integrated insect data from VectorBase, an organization that collects and counts mosquitoes and is funded by the U.S. National Institute of Allergy and Infectious Diseases.

The model powering the OFF!Cast Mosquito Forecast combines three inputs — knowledge of a mosquito’s lifecycle, detailed climate data inputs, and mosquito population counts from more than 5,000 locations provided by VectorBase. The model’s accuracy was validated against precise mosquito population data collected over six years from more than 33 million mosquitoes across 141 different species at more than 5,000 unique trapping locations.

A better understanding of entomology, especially things like degree days and how they affect mosquito populations, and helping communities take action is critically important to improving public health.

A version of this blogpost appeared on the Google Cloud blog.

Buckle up: McLaren has a new Android and Chrome F1 race car

At this weekend’s Miami Grand Prix, I’ll be cheering on two of my favorite Formula 1 drivers — Lando Norris and Daniel Ricciardo — as they race around the track in McLaren Formula 1 cars fashioned with Android-inspired engine covers and slick, Chrome-inspired wheel covers.

Earlier this year, Google became an Official Partner of the McLaren Formula 1 Team, a sport that is data-driven at heart and a natural fit for our products. We specifically teamed up with McLaren because of our shared values, especially around sustainability and inclusion. In 2011, McLaren was the first F1 team to be certified carbon neutral, and they’re currently in the process of adopting renewable energy across all their operations. They also recently announced their first woman driver for the Extreme E electric racing series as a first of many efforts to improve representation.

Through our partnership, we're pairing the engineering excellence of McLaren’s race cars with Google technology to help maximize race-day performance. McLaren’s crew is already using Android connected devices and equipment, including phones, tablets and earbuds, to help improve pit stops, and their pit team will use Fitbit devices to monitor their overall health and wellbeing, including heart rate and breathing rate. The team will also exclusively use the Chrome browser. Meanwhile, the Extreme E McLaren Team will bring Pixel 6s and Pixel Buds to their off-road racing operations for the first time this season.

A line of race car wheels with the blue, green, yellow and red Chrome-inspired logo colors around them. A person in an orange shirt is doing maintenance on one of them.

This collaboration has the potential to solve big and complex engineering challenges — from improving the team’s telemetry and design capabilities through AI, to speeding up decision making and safeguarding team communications using Android 5G. We've got an exciting road ahead with McLaren Racing, and our feet are placed firmly on the gas.

Chrome Beta for Android Update

Hi everyone! We've just released Chrome Beta 102 (102.0.5005.40) for Android. It's now available on Google Play.

You can see a partial list of the changes in the Git log. For details on new features, check out the Chromium blog, and for details on web platform updates, check here.

If you find a new issue, please let us know by filing a bug.

Krishna Govind
Google Chrome

Chrome Beta for Android Update

Hi everyone! We've just released Chrome Beta 102 (102.0.5005.40) for Android. It's now available on Google Play.

You can see a partial list of the changes in the Git log. For details on new features, check out the Chromium blog, and for details on web platform updates, check here.

If you find a new issue, please let us know by filing a bug.

Erhu Akpobaro
Google Chrome

GraphWorld: Advances in Graph Benchmarking

Graphs are very common representations of natural systems that have connected relational components, such as social networks, traffic infrastructure, molecules, and the internet. Graph neural networks (GNNs) are powerful machine learning (ML) models for graphs that leverage their inherent connections to incorporate context into predictions about items within the graph or the graph as a whole. GNNs have been effectively used to discover new drugs, help mathematicians prove theorems, detect misinformation, and improve the accuracy of arrival time predictions in Google Maps.

A surge of interest in GNNs during the last decade has produced thousands of GNN variants, with hundreds introduced each year. In contrast, methods and datasets for evaluating GNNs have received far less attention. Many GNN papers re-use the same 5–10 benchmark datasets, most of which are constructed from easily labeled academic citation networks and molecular datasets. This means that the empirical performance of new GNN variants can be claimed only for a limited class of graphs. Confounding this issue are recently published works with rigorous experimental designs that cast doubt on the performance rankings of popular GNN models reported in seminal papers.

Recent workshops and conference tracks devoted to GNN benchmarking have begun addressing these issues. The recently-introduced Open Graph Benchmark (OGB) is an open-source package for benchmarking GNNs on a handful of massive-scale graph datasets across a variety of tasks, facilitating consistent GNN experimental design. However, the OGB datasets are sourced from many of the same domains as existing datasets, such as citation and molecular networks. This means that OGB does not solve the dataset variety problem we mention above. Therefore, we ask: how can the GNN research community keep up with innovation by experimenting on graphs with the large statistical variance seen in the real-world?

To match the scale and pace of GNN research, in “GraphWorld: Fake Graphs Bring Real Insights for GNNs”, we introduce a methodology for analyzing the performance of GNN architectures on millions of synthetic benchmark datasets. Whereas GNN benchmark datasets featured in academic literature are just individual “locations” on a fully-diverse “world” of potential graphs, GraphWorld directly generates this world using probability models, tests GNN models at every location on it, and extracts generalizable insights from the results. We propose GraphWorld as a complementary GNN benchmark that allows researchers to explore GNN performance on regions of graph space that are not covered by popular academic datasets. Furthermore, GraphWorld is cost-effective, running hundreds-of-thousands of GNN experiments on synthetic data with less computational cost than one experiment on a large OGB dataset.

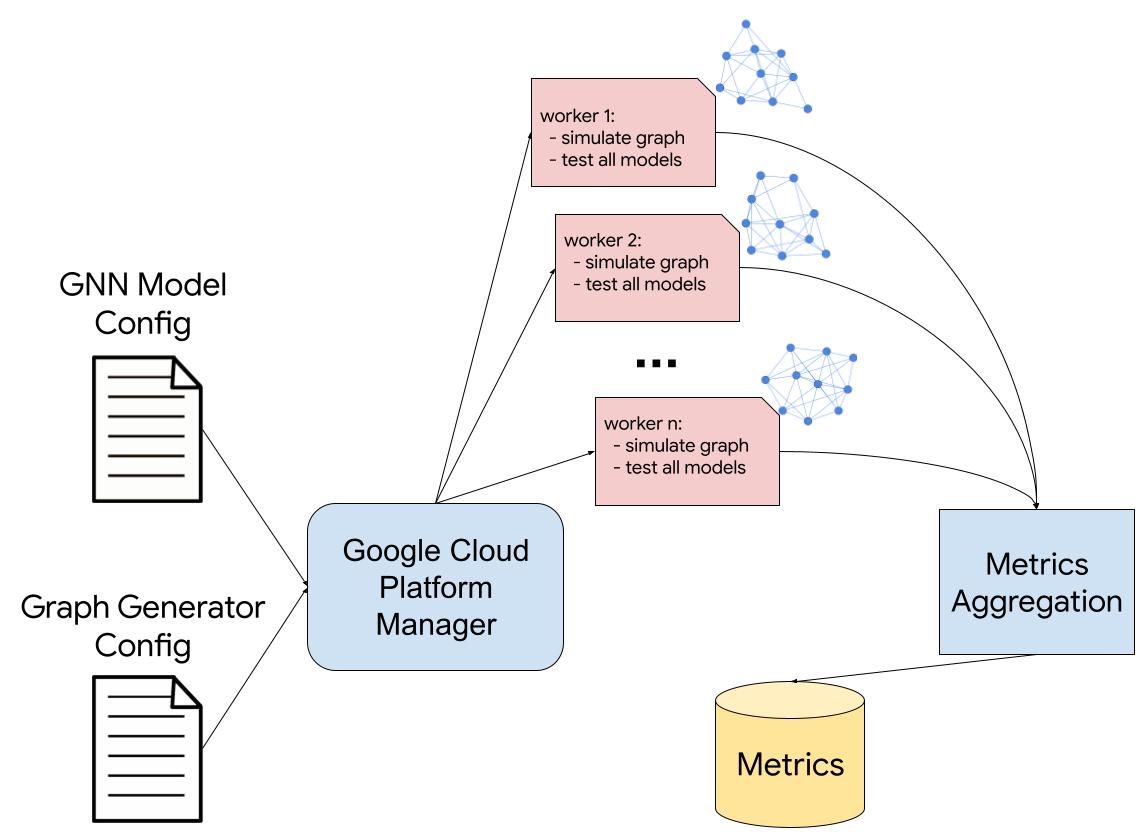
Illustration of the GraphWorld pipeline. The user provides configurations for the graph generator and the GNN models to test. GraphWorld spawns workers, each one simulating a new graph with diverse properties and testing all specified GNN models. The test metrics from the workers are then aggregated and stored for the user.

The Limited Variety of GNN Benchmark Datasets
To illustrate the motivation for GraphWorld, we compare OGB graphs to a much larger collection (5,000+) of graphs from the Network Repository. While the vast majority of Network Repository graphs are unlabelled, and therefore cannot be used in common GNN experiments, they represent a large space of graphs that are available in the real world. We computed two properties of the OGB and Network Repository graphs: the clustering coefficient (how interconnected nodes are to nearby neighbors) and the degree distribution gini coefficient (the inequality among the nodes' connection counts). We found that OGB datasets exist in a limited and sparsely-populated region of this metric space.

The distribution of graphs from the Open Graph Benchmark does not match the larger population of graphs from the Network Repository.

Dataset Generators in GraphWorld
A researcher using GraphWorld to investigate GNN performance on a given task first chooses a parameterized generator (example below) that can produce graph datasets for stress-testing GNN models on the task. A generator parameter is an input that controls high-level features of the output dataset. GraphWorld uses parameterized generators to produce populations of graph datasets that are varied enough to test the limits of state-of-the-art GNN models.

For instance, a popular task for GNNs is node classification, in which a GNN is trained to infer node labels that represent some unknown property of each node, such as user interests in a social network. In our paper, we chose the well-known stochastic block model (SBM) to generate datasets for this task. The SBM first organizes a pre-set number of nodes into groups or "clusters", which serve as node labels to be classified. It then generates connections between nodes according to various parameters that (each) control a different property of the resulting graph.

One SBM parameter that we expose to GraphWorld is the "homophily" of the clusters, which controls the likelihood that two nodes from the same cluster are connected (relative to two nodes from different clusters). Homophily is a common phenomenon in social networks in which users with similar interests (e.g., the SBM clusters) are more likely to connect. However, not all social networks have the same level of homophily. GraphWorld uses the SBM to generate graphs with high homophily (below on the left), graphs with low homophily (below on the right), and millions more graphs with any level of homophily in-between. This allows a user to analyze GNN performance on graphs with all levels of homophily without depending on the availability of real-world datasets curated by other researchers.

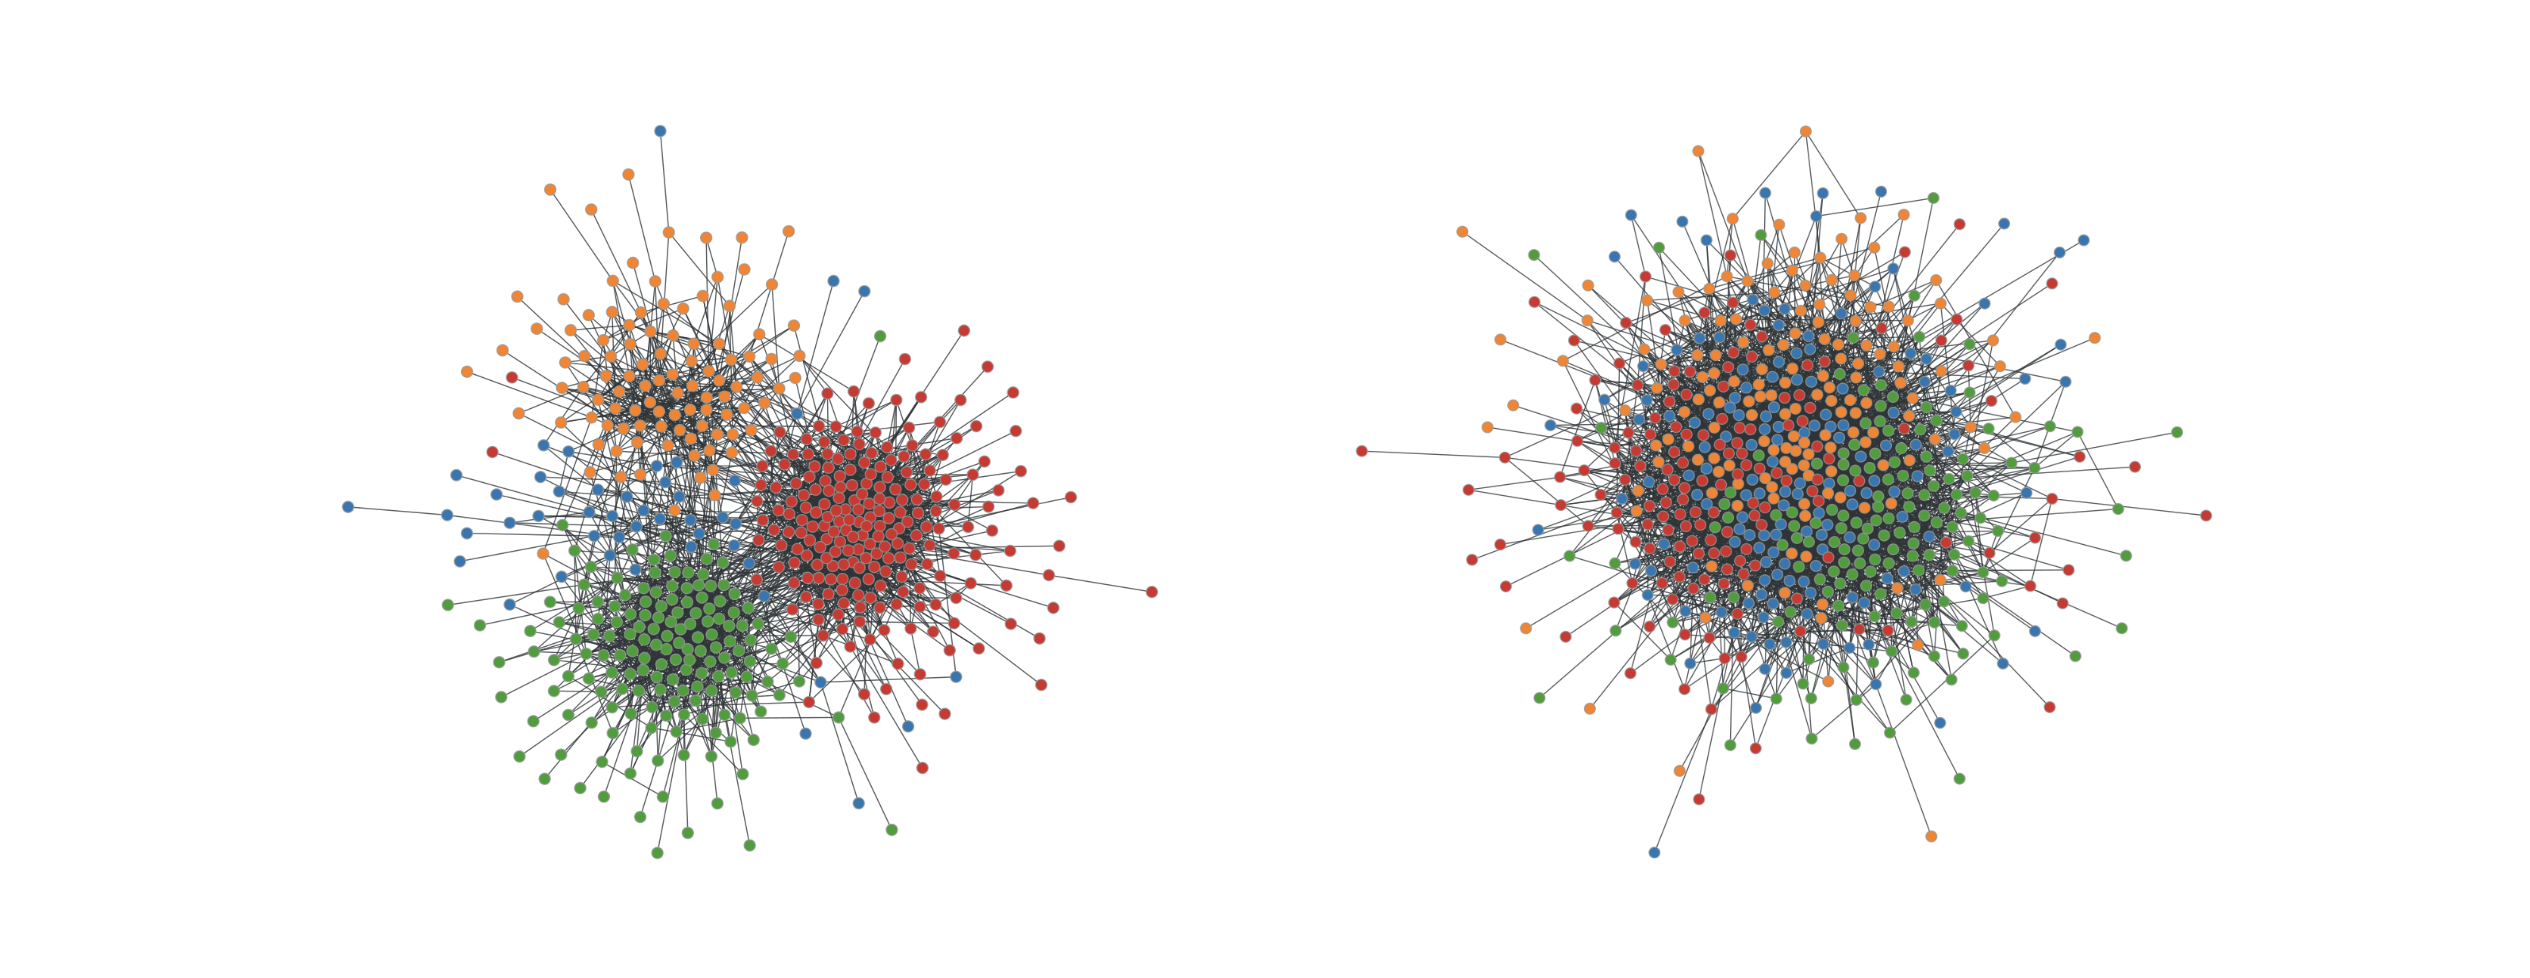
Examples of graphs produced by GraphWorld using the stochastic block model. The left graph has high homophily among node classes (represented by different colors); the right graph has low homophily.

GraphWorld Experiments and Insights
Given a task and parameterized generator for that task, GraphWorld uses parallel computing (e.g., Google Cloud Platform Dataflow) to produce a world of GNN benchmark datasets by sampling the generator parameter values. Simultaneously, GraphWorld tests an arbitrary list of GNN models (chosen by the user, e.g., GCN, GAT, GraphSAGE) on each dataset, and then outputs a massive tabular dataset joining graph properties with the GNN performance results.

In our paper, we describe GraphWorld pipelines for node classification, link prediction, and graph classification tasks, each featuring different dataset generators. We found that each pipeline took less time and computational resources than state-of-the-art experiments on OGB graphs, which means that GraphWorld is accessible to researchers with low budgets.

The animation below visualizes GNN performance data from the GraphWorld node classification pipeline (using the SBM as the dataset generator). To illustrate the impact of GraphWorld, we first map classic academic graph datasets to an x-y plane that measures the cluster homophily (x-axis) and the average of the node degrees (y-axis) within each graph (similar to the scatterplot above that includes the OGB datasets, but with different measurements). Then, we map each simulated graph dataset from GraphWorld to the same plane, and add a third z-axis that measures GNN model performance over each dataset. Specifically, for a particular GNN model (like GCN or GAT), the z-axis measures the mean reciprocal rank of the model against the 13 other GNN models evaluated in our paper, where a value closer to 1 means the model is closer to being the top performer in terms of node classification accuracy.

The animation illustrates two related conclusions. First, GraphWorld generates regions of graph datasets that extend well-beyond the regions covered by the standard datasets. Second, and most importantly, the rankings of GNN models change when graphs become dissimilar from academic benchmark graphs. Specifically, the homophily of classic datasets like Cora and CiteSeer are high, meaning that nodes are well-separated in the graph according to their classes. We find that as GNNs traverse toward the space of less-homophilous graphs, their rankings change quickly. For example, the comparative mean reciprocal rank of GCN moves from higher (green) values in the academic benchmark region to lower (red) values away from that region. This shows that GraphWorld has the potential to reveal critical headroom in GNN architecture development that would be invisible with only the handful of individual datasets that academic benchmarks provide.

Relative performance results of three GNN variants (GCN, APPNP, FiLM) across 50,000 distinct node classification datasets. We find that academic GNN benchmark datasets exist in GraphWorld regions where model rankings do not change. GraphWorld can discover previously unexplored graphs that reveal new insights about GNN architectures.

Conclusion
GraphWorld breaks new ground in GNN experimentation by allowing researchers to scalably test new models on a high-dimensional surface of graph datasets. This allows fine-grained analysis of GNN architectures against graph properties on entire subspaces of graphs that are distal from Cora-like graphs and those in the OGB, which appear only as individual points in a GraphWorld dataset. A key feature of GraphWorld is its low cost, which enables individual researchers without access to institutional resources to quickly understand the empirical performance of new models.

With GraphWorld, researchers can also investigate novel random/generative graph models for more-nuanced GNN experimentation, and potentially use GraphWorld datasets for GNN pre-training. We look forward to supporting these lines of inquiry with our open-source GraphWorld repository and follow-up projects.

Acknowledgements
GraphWorld is joint work with Brandon Mayer and Bryan Perozzi from Google Research. Thanks to Tom Small for visualizations.

Source: Google AI Blog