Tag Archives: Health

Putting your heart first on World Heart Day

World Heart Day is this Sunday, and it raises awareness around the cause and prevention of cardiovascular diseases around the world. As part of these efforts, the World Heart Federation recognizes “people from all walks of life who have shown commitment, courage, empathy and care in relation to heart health” as heart heroes. It’s an honor to have been included this year for my focus on using technology to promote lifestyle interventions such as increasing physical activity to help people lead healthier lives.

Heart disease continues to be the number one cause of death in the U.S., so it’s more important than ever to identify and share simple ways to keep your heart healthy. I have two kids under the age of five and life can get really busy. When juggling between patients, children, work and errands, it’s easy to feel active when in reality, I’ve lost track of healthy habits.

With Google Fit’s smart activity goals and Heart Point tracking, I realized I wasn’t reaching American Heart Association and World Health Organization’s recommended amount of weekly physical activity and I needed to make changes to earn more Heart Points throughout the week.

Meeting weekly Heart Point goals improve overall wellness and health

Meeting weekly Heart Point goals improve overall wellness and health

On busy days, I’ve started to use a 7-minute workout app every evening that provides video overviews and audio descriptions of each exercise. It’s quick, easy and fun. And to top it off, my kids will often join in on a wall sit or climb on me for some extra weight during a plank. I’ve found these exercises to be a quick and efficient way to earn 14 Heart Points, which quickly adds up to help me reach my weekly goal.

7 minute workout with kids

Using a workout app may not be for everyone—there are many ways to incorporate incremental changes throughout your week that will help you be more active. Here are a few other things to try out: 

  • Get your body moving and rake the leaves outside or mow the lawn.
  • Pick up the pace when you’re on a walk, with yourself, your friends or your dog.
  • Wear sneakers and make it a walking meeting—this way you and your co-workers get health benefits. 
  • Sign up for a workout class! A 45-minute indoor cycling class earns you 90 Heart Points.
  • Before you shower, take a few minutes to do simple exercises like jumping jacks, squats, wall sits, push ups or planks.

The beauty of it all is that you don’t have to go to a gym or buy special equipment. Just getting moving can have health benefits that add up. For World Heart Day, I challenge you to find opportunities that work with your schedule to earn more Heart Points.

DeepMind’s health team joins Google Health

Over the last three years, DeepMind has built a team to tackle some of healthcare’s most complex problems—developing AI research and mobile tools that are already having a positive impact on patients and care teams. Today, with our healthcare partners, the team is excited to officially join the Google Health family. Under the leadership of Dr. David Feinberg, and alongside other teams at Google, we’ll now be able to tap into global expertise in areas like app development, data security, cloud storage and user-centered design to build products that support care teams and improve patient outcomes. 

During my time working in the UK National Health Service (NHS) as a surgeon and researcher, I saw first-hand how technology could help, or hinder, the important work of nurses and doctors. It’s remarkable that many frontline clinicians, even in the world’s most advanced hospitals, are still reliant on clunky desktop systems and pagers that make delivering fast and safe patient care challenging. Thousands of people die in hospitals every year from avoidable conditions like sepsis and acute kidney injury and we believe that better tools could save lives. That’s why I joined DeepMind, and why I will continue this work with Google Health. 

We’ve already seen how our mobile medical assistant for clinicians is helping patients and the clinicians looking after them, and we are looking forward to continuing our partnerships with The Royal Free London NHS Foundation Trust, Imperial College Healthcare NHS Trust and Taunton and Somerset NHS Foundation Trust.

On the research side, we’ve seen major advances with Moorfields Eye Hospital NHS Foundation Trust in detecting eye disease from scansas accurately as experts; with University College London Hospitals NHS Foundation Trust on planning cancer radiotherapy treatment; and with the US Department of Veterans Affairs to predict patient deterioration up to 48 hours earlier than currently possible. We see enormous potential in continuing, and scaling, our work with all three partners in the coming years as part of Google Health. 

It’s clear that a transition like this takes time. Health data is sensitive, and we gave proper time and care to make sure that we had the full consent and cooperation of our partners. This included giving them the time to ask questions and fully understand our plans and to choose whether to continue our partnerships. As has always been the case, our partners are in full control of all patient data and we will only use patient data to help improve care, under their oversight and instructions.

I know DeepMind is proud of our healthcare work to date. With the expertise and reach of Google behind us, we’ll now be able to develop tools and technology capable of helping millions of patients around the world. 

Using Deep Learning to Inform Differential Diagnoses of Skin Diseases


An estimated 1.9 billion people worldwide suffer from a skin condition at any given time, and due to a shortage of dermatologists, many cases are seen by general practitioners instead. In the United States alone, up to 37% of patients seen in the clinic have at least one skin complaint and more than half of those patients are seen by non-dermatologists. However, studies demonstrate a significant gap in the accuracy of skin condition diagnoses between general practitioners and dermatologists, with the accuracy of general practitioners between 24% and 70%, compared to 77-96% for dermatologists. This can lead to suboptimal referrals, delays in care, and errors in diagnosis and treatment.

Existing strategies for non-dermatologists to improve diagnostic accuracy include the use of reference textbooks, online resources, and consultation with a colleague. Machine learning tools have also been developed with the aim of helping to improve diagnostic accuracy. Previous research has largely focused on early screening of skin cancer, in particular, whether a lesion is malignant or benign, or whether a lesion is melanoma. However, upwards of 90% of skin problems are not malignant, and addressing these more common conditions is also important to reduce the global burden of skin disease.

In “A Deep Learning System for Differential Diagnosis of Skin Diseases,” we developed a deep learning system (DLS) to address the most common skin conditions seen in primary care. Our results showed that a DLS can achieve an accuracy across 26 skin conditions that is on par with U.S. board-certified dermatologists, when presented with identical information about a patient case (images and metadata). This study highlights the potential of the DLS to augment the ability of general practitioners who did not have additional specialty training to accurately diagnose skin conditions.

DLS Design
Clinicians often face ambiguous cases for which there is no clear cut answer. For example, is this patient’s rash stasis dermatitis or cellulitis, or perhaps both superimposed? Rather than giving just one diagnosis, clinicians generate a differential diagnosis, which is a ranked list of possible diagnoses. A differential diagnosis frames the problem so that additional workup (laboratory tests, imaging, procedures, consultations) and treatments can be systematically applied until a diagnosis is confirmed. As such, a deep learning system (DLS) that produces a ranked list of possible skin conditions for a skin complaint closely mimics how clinicians think and is key to prompt triage, diagnosis and treatment for patients.

To render this prediction, the DLS processes inputs, including one or more clinical images of the skin abnormality and up to 45 types of metadata (self-reported components of the medical history such as age, sex, symptoms, etc.). For each case, multiple images were processed using the Inception-v4 neural network architecture and combined with feature-transformed metadata, for use in the classification layer. In our study, we developed and evaluated the DLS with 17,777 de-identified cases that were primarily referred from primary care clinics to a teledermatology service. Data from 2010-2017 were used for training and data from 2017-2018 for evaluation. During model training, the DLS leveraged over 50,000 differential diagnoses provided by over 40 dermatologists.

To evaluate the DLS’s accuracy, we compared it to a rigorous reference standard based on the diagnoses from three U.S. board-certified dermatologists. In total, dermatologists provided differential diagnoses for 3,756 cases (“Validation set A”), and these diagnoses were aggregated via a voting process to derive the ground truth labels. The DLS’s ranked list of skin conditions was compared with this dermatologist-derived differential diagnosis, achieving 71% and 93% top-1 and top-3 accuracies, respectively.
Schematic of the DLS and how the reference standard (ground truth) was derived via the voting of three board-certified dermatologists for each case in the validation set.
Comparison to Professional Evaluations
In this study, we also compared the accuracy of the DLS to that of three categories of clinicians on a subset of the validation A dataset (“Validation set B”): dermatologists, primary care physicians (PCPs), and nurse practitioners (NPs) — all chosen randomly and representing a range of experience, training, and diagnostic accuracy. Because typical differential diagnoses provided by clinicians only contain up to three diagnoses, we compared only the top three predictions by the DLS with the clinicians. The DLS achieved a top-3 diagnostic accuracy of 90% on the validation B dataset, which was comparable to dermatologists and substantially higher than primary care physicians (PCPs) and nurse practitioners (NPs)—75%, 60%, and 55%, respectively, for the 6 clinicians in each group. This high top-3 accuracy suggests that the DLS may help prompt clinicians (including dermatologists) to consider possibilities that were not originally in their differential diagnoses, thus improving diagnostic accuracy and condition management.
The DLS’s leading (top-1) differential diagnosis is substantially higher than PCPs and NPs, and on par with dermatologists. This accuracy increases substantially when we look at the DLS’s top-3 accuracy, suggesting that in the majority of cases the DLS’s ranked list of diagnoses contains the correct ground truth answer for the case.
Assessing Demographic Performance
Skin type, in particular, is highly relevant to dermatology, where visual assessment of the skin itself is crucial to diagnosis. To evaluate potential bias towards skin type, we examined DLS performance based on the Fitzpatrick skin type, which is a scale that ranges from Type I (“pale white, always burns, never tans”) to Type VI (“darkest brown, never burns”). To ensure sufficient numbers of cases on which to draw convincing conclusions, we focused on skin types that represented at least 5% of the data — Fitzpatrick skin types II through IV. On these categories, the DLS’s accuracy was similar, with a top-1 accuracy ranging from 69-72%, and the top-3 accuracy from 91-94%. Encouragingly, the DLS also remained accurate in patient subgroups for which significant numbers (at least 5%) were present in the dataset based on other self-reported demographic information: age, sex, and race/ethnicities. As further qualitative analysis, we assessed via saliency (explanation) techniques that the DLS was reassuringly “focusing” on the abnormalities instead of on skin tone.
Left: An example of a case with hair loss that was challenging for non-specialists to arrive at the specific diagnosis, which is necessary for determining appropriate treatment. Right: An image with regions highlighted in green showing the areas that the DLS identified as important and used to make its prediction. Center: The combined image, which indicates that the DLS mostly focused on the area with hair loss to make this prediction, instead of on forehead skin color, for example, which may indicate potential bias.
Incorporating Multiple Data Types
We also studied the effect of different types of input data on the DLS performance. Much like how having images from several angles can help a teledermatologist more accurately diagnose a skin condition, the accuracy of the DLS improves with increasing number of images. If metadata (e.g., the medical history) is missing, the model does not perform as well. This accuracy gap, which may occur in scenarios where no medical history is available, can be partially mitigated by training the DLS with only images. Nevertheless, this data suggests that providing the answers to a few questions about the skin condition can substantially improve the DLS accuracy.
The DLS performance improves when more images (blue line) or metadata (blue compared with red line) are present. In the absence of metadata as input, training a separate DLS using images alone leads to a marginal improvement compared to the current DLS (green line).
Future Work and Applications
Though these results are very promising, much work remains ahead. First, as reflective of real-world practice, the relative rarity of skin cancer such as melanoma in our dataset hindered our ability to train an accurate system to detect cancer. Related to this, the skin cancer labels in our dataset were not biopsy-proven, limiting the quality of the ground truth in this regard. Second, while our dataset did contain a variety of Fitzpatrick skin types, some skin types were too rare in this dataset to allow meaningful training or analysis. Finally, the validation dataset was from one teledermatology service. Though 17 primary care locations across two states were included, additional validation on cases from a wider geographical region will be critical. We believe these limitations can be addressed by including more cases of biopsy-proven skin cancers in the training and validation sets, and including cases representative of additional Fitzpatrick skin types and from other clinical centers.

The success of deep learning to inform the differential diagnosis of skin disease is highly encouraging of such a tool’s potential to assist clinicians. For example, such a DLS could help triage cases to guide prioritization for clinical care or could help non-dermatologists initiate dermatologic care more accurately and potentially improve access. Though significant work remains, we are excited for future efforts in examining the usefulness of such a system for clinicians. For research collaboration inquiries, please contact [email protected].

Acknowledgements
This work involved the efforts of a multidisciplinary team of software engineers, researchers, clinicians and cross functional contributors. Key contributors to this project include Yuan Liu, Ayush Jain, Clara Eng, David H. Way, Kang Lee, Peggy Bui, Kimberly Kanada, Guilherme de Oliveira Marinho, Jessica Gallegos, Sara Gabriele, Vishakha Gupta, Nalini Singh, Vivek Natarajan, Rainer Hofmann-Wellenhof, Greg S. Corrado, Lily H. Peng, Dale R. Webster, Dennis Ai, Susan Huang, Yun Liu, R. Carter Dunn and David Coz. The authors would like to acknowledge William Chen, Jessica Yoshimi, Xiang Ji and Quang Duong for software infrastructure support for data collection. Thanks also go to Genevieve Foti, Ken Su, T Saensuksopa, Devon Wang, Yi Gao and Linh Tran. Last but not least, this work would not have been possible without the participation of the dermatologists, primary care physicians, nurse practitioners who reviewed cases for this study, Sabina Bis who helped to establish the skin condition mapping and Amy Paller who provided feedback on the manuscript.

Source: Google AI Blog


Building SMILY, a Human-Centric, Similar-Image Search Tool for Pathology


Advances in machine learning (ML) have shown great promise for assisting in the work of healthcare professionals, such as aiding the detection of diabetic eye disease and metastatic breast cancer. Though high-performing algorithms are necessary to gain the trust and adoption of clinicians, they are not always sufficient—what information is presented to doctors and how doctors interact with that information can be crucial determinants in the utility that ML technology ultimately has for users.

The medical specialty of anatomic pathology, which is the gold standard for the diagnosis of cancer and many other diseases through microscopic analysis of tissue samples, can greatly benefit from applications of ML. Though diagnosis through pathology is traditionally done on physical microscopes, there has been a growing adoption of “digital pathology,” where high-resolution images of pathology samples can be examined on a computer. With this movement comes the potential to much more easily look up information, as is needed when pathologists tackle the diagnosis of difficult cases or rare diseases, when “general” pathologists approach specialist cases, and when trainee pathologists are learning. In these situations, a common question arises, “What is this feature that I’m seeing?” The traditional solution is for doctors to ask colleagues, or to laboriously browse reference textbooks or online resources, hoping to find an image with similar visual characteristics. The general computer vision solution to problems like this is termed content-based image retrieval (CBIR), one example of which is the “reverse image search” feature in Google Images, in which users can search for similar images by using another image as input.

Today, we are excited to share two research papers describing further progress in human-computer interaction research for similar image search in medicine. In “Similar Image Search for Histopathology: SMILY” published in Nature Partner Journal (npj) Digital Medicine, we report on our ML-based tool for reverse image search for pathology. In our second paper, Human-Centered Tools for Coping with Imperfect Algorithms During Medical Decision-Making(preprint available here), which received an honorable mention at the 2019 ACM CHI Conference on Human Factors in Computing Systems, we explored different modes of refinement for image-based search, and evaluated their effects on doctor interaction with SMILY.

SMILY Design
The first step in developing SMILY was to apply a deep learning model, trained using 5 billion natural, non-pathology images (e.g., dogs, trees, man-made objects, etc.), to compress images into a “summary” numerical vector, called an embedding. The network learned during the training process to distinguish similar images from dissimilar ones by computing and comparing their embeddings. This model is then used to create a database of image patches and their associated embeddings using a corpus of de-identified slides from The Cancer Genome Atlas. When a query image patch is selected in the SMILY tool, the query patch’s embedding is similarly computed and compared with the database to retrieve the image patches with the most similar embeddings.
Schematic of the steps in building the SMILY database and the process by which input image patches are used to perform the similar image search.
The tool allows a user to select a region of interest, and obtain visually-similar matches. We tested SMILY’s ability to retrieve images along a pre-specified axis of similarity (e.g. histologic feature or tumor grade), using images of tissue from the breast, colon, and prostate (3 of the most common cancer sites). We found that SMILY demonstrated promising results despite not being trained specifically on pathology images or using any labeled examples of histologic features or tumor grades.
Example of selecting a small region in a slide and using SMILY to retrieve similar images. SMILY efficiently searches a database of billions of cropped images in a few seconds. Because pathology images can be viewed at different magnifications (zoom levels), SMILY automatically searches images at the same magnification as the input image.
Second example of using SMILY, this time searching for a lobular carcinoma, a specific subtype of breast cancer.
Refinement tools for SMILY
However, a problem emerged when we observed how pathologists interacted with SMILY. Specifically, users were trying to answer the nebulous question of “What looks similar to this image?” so that they could learn from past cases containing similar images. Yet, there was no way for the tool to understand the intent of the search: Was the user trying to find images that have a similar histologic feature, glandular morphology, overall architecture, or something else? In other words, users needed the ability to guide and refine the search results on a case-by-case basis in order to actually find what they were looking for. Furthermore, we observed that this need for iterative search refinement was rooted in how doctors often perform “iterative diagnosis”—by generating hypotheses, collecting data to test these hypotheses, exploring alternative hypotheses, and revisiting or retesting previous hypotheses in an iterative fashion. It became clear that, for SMILY to meet real user needs, it would need to support a different approach to user interaction.

Through careful human-centered research described in our second paper, we designed and augmented SMILY with a suite of interactive refinement tools that enable end-users to express what similarity means on-the-fly: 1) refine-by-region allows pathologists to crop a region of interest within the image, limiting the search to just that region; 2) refine-by-example gives users the ability to pick a subset of the search results and retrieve more results like those; and 3) refine-by-concept sliders can be used to specify that more or less of a clinical concept be present in the search results (e.g., fused glands). Rather than requiring that these concepts be built into the machine learning model, we instead developed a method that enables end-users to create new concepts post-hoc, customizing the search algorithm towards concepts they find important for each specific use case. This enables new explorations via post-hoc tools after a machine learning model has already been trained, without needing to re-train the original model for each concept or application of interest.
Through our user study with pathologists, we found that the tool-based SMILY not only increased the clinical usefulness of search results, but also significantly increased users’ trust and likelihood of adoption, compared to a conventional version of SMILY without these tools. Interestingly, these refinement tools appeared to have supported pathologists’ decision-making process in ways beyond simply performing better on similarity searches. For example, pathologists used the observed changes to their results from iterative searches as a means of progressively tracking the likelihood of a hypothesis. When search results were surprising, many re-purposed the tools to test and understand the underlying algorithm, for example, by cropping out regions they thought were interfering with the search or by adjusting the concept sliders to increase the presence of concepts they suspected were being ignored. Beyond being passive recipients of ML results, doctors were empowered with the agency to actively test hypotheses and apply their expert domain knowledge, while simultaneously leveraging the benefits of automation.
With these interactive tools enabling users to tailor each search experience to their desired intent, we are excited for SMILY’s potential to assist with searching large databases of digitized pathology images. One potential application of this technology is to index textbooks of pathology images with descriptive captions, and enable medical students or pathologists in training to search these textbooks using visual search, speeding up the educational process. Another application is for cancer researchers interested in studying the correlation of tumor morphologies with patient outcomes, to accelerate the search for similar cases. Finally, pathologists may be able to leverage tools like SMILY to locate all occurrences of a feature (e.g. signs of active cell division, or mitosis) in the same patient’s tissue sample to better understand the severity of the disease to inform cancer therapy decisions. Importantly, our findings add to the body of evidence that sophisticated machine learning algorithms need to be paired with human-centered design and interactive tooling in order to be most useful.

Acknowledgements
This work would not have been possible without Jason D. Hipp, Yun Liu, Emily Reif, Daniel Smilkov, Michael Terry, Craig H. Mermel, Martin C. Stumpe and members of Google Health and PAIR. Preprints of the two papers are available here and here.

Source: Google AI Blog


Meet David Feinberg, head of Google Health

Dr. David Feinberg has spent his entire career caring for people’s health and wellbeing. And after years in the healthcare system, he now leads Google Health, which brings together groups from across Google and Alphabet that are using AI, product expertise and hardware to take on big healthcare challenges. We sat down with David to hear more about his pre-Google life, what he’s learned as a “Noogler” (new Googler), and what’s next for Google Health.

You joined Google after a career path that led you from child psychiatrist to hospital executive. Tell us how this journey brought you to Google Health.

I’m driven by the urgency to help people live longer, healthier lives. I started as a child psychiatrist at UCLA helping young patients with serious mental health needs. Over the course of my 25 years at UCLA, I moved from treating dozens of patients, to overseeing the UCLA health system and the more than a million patients in our care. Then, at Geisinger, I had the opportunity to support a community of more than 3 million patients.

I recall my mom being very confused by my logic of stepping away from clinical duties and moving toward administrative duties as a way of helping more people. However, in these roles, the impact lies in initiatives that have boosted patient experience, improved people’s access to healthcare, and (I hope!) helped people get more time back to live their lives.

When I began speaking with Google, I immediately saw the potential to help billions of people, in part because I believe Google is already a health company. It’s been in the company’s DNA from the start.

You say Google is already a health company. How so?

We’re already making strides in organizing and making health data more useful thanks to work being done by Cloud and AI teams. And looking across the rest of Google’s portfolio of helpful products, we’re already addressing aspects of people’s health. Search helps people answer everyday health questions, Maps helps get people to the nearest hospital, and other tools and products are addressing issues tangential to health—for instance, literacysafer driving, and air pollution.

We already have the foundation, and I’m excited by the potential to tap into Google’s strengths, its brilliant people, and its amazing products to do more for people’s health (and lives).

I believe Google is already a health company. It’s been in the company’s DNA from the start.

This isn’t the first time Google has invested directly in health efforts. What has changed over the years about Google’s solving health-related problems? 

Some of Google’s early efforts didn’t gain traction due to various challenges the entire industry was facing at the time. During this period, I was a hospital administrator and no one talked about interoperability—a term familiar to those of us in the industry today. We were only just starting to think about the behemoth task of adopting electronic health records and bringing health data online, which is why some of the early projects didn’t really get off the ground. Today we take some of this for granted as we navigate today’s more digitized healthcare systems.

The last few years have changed the healthcare landscape—offering up new opportunities and challenges. And in response, Google and Alphabet have invested in efforts that complement their strengths and put users, patients, and care providers first. Look no further than the promising AI research and mobile applications coming from Google and DeepMind Health, or Verily’s Project Baseline that is pushing the boundaries of what we think we know about human health. And there’s so much more we can and will do.

Speaking of AI, it features prominently in many of Google’s current health efforts. What’s next for this research?

There’s little doubt that AI will power the next wave of tools that can improve many facets of healthcare: delivery, access, and so much more.

When I consider the future of research, I see us continuing to be deliberate and thoughtful about sharing our findings with the research and medical communities, incorporating feedback, and generally making sure our work actually adds value to patients, doctors and care providers.

Of course, we have to work toward getting solutions out in the wild, and into the hands of the pathologist scanning slides for breast cancer, or the nurse scanning a patient’s record for the latest lab results on the go. But this needs to be executed safely, working with and listening to our users to ensure that we get this right.

Now that you’ve been here for six months, what’s been most surprising to you about Google or the team?

I can’t believe how fantastic it is to not wear a suit after decades of formal business attire. When I got the job I ended up donating most of my suits. I kept a few, you know, for weddings.

On a more serious note, I’m blown away every day by the teams I’m surrounded by, and the drive and commitment they have for the work they do. I’m thrilled to be a part of this team.

What's your life motto?

I know this sounds cheesy, but there are three words I really do say every morning when I arrive in the parking lot for work: passion, humility, integrity. These are words that ground me, and also ground the work we are doing at Google Health.

Passion means we have to get this right, and feel that health is a cause worth fighting for, every day. We need humility, because at the end of the day, if we move too quickly or mess up, people’s lives are on the line. And integrity means that we should come to work with the aim of leaving the place—and the world—better than when we found it.

A promising step forward for predicting lung cancer

Over the past three years, teams at Google have been applying AI to problems in healthcare—from diagnosing eye disease to predicting patient outcomes in medical records. Today we’re sharing new research showing how AI can predict lung cancer in ways that could boost the chances of survival for many people at risk around the world.


Lung cancer results in over 1.7 million deaths per year, making it the deadliest of all cancers worldwide—more than breast, prostate, and colorectal cancers combined—and it’s the sixth most common cause of death globally, according to the World Health Organization. While lung cancer has one of the worst survival rates among all cancers, interventions are much more successful when the cancer is caught early. Unfortunately, the statistics are sobering because the overwhelming majority of cancers are not caught until later stages.


Over the last three decades, doctors have explored ways to screen people at high-risk for lung cancer. Though lower dose CT screening has been proven to reduce mortality, there are still challenges that lead to unclear diagnosis, subsequent unnecessary procedures, financial costs, and more.

Our latest research

In late 2017, we began exploring how we could address some of these challenges using AI. Using advances in 3D volumetric modeling alongside datasets from our partners (including Northwestern University), we’ve made progress in modeling lung cancer prediction as well as laying the groundwork for future clinical testing. Today we’re publishing our promising findings in “Nature Medicine.”


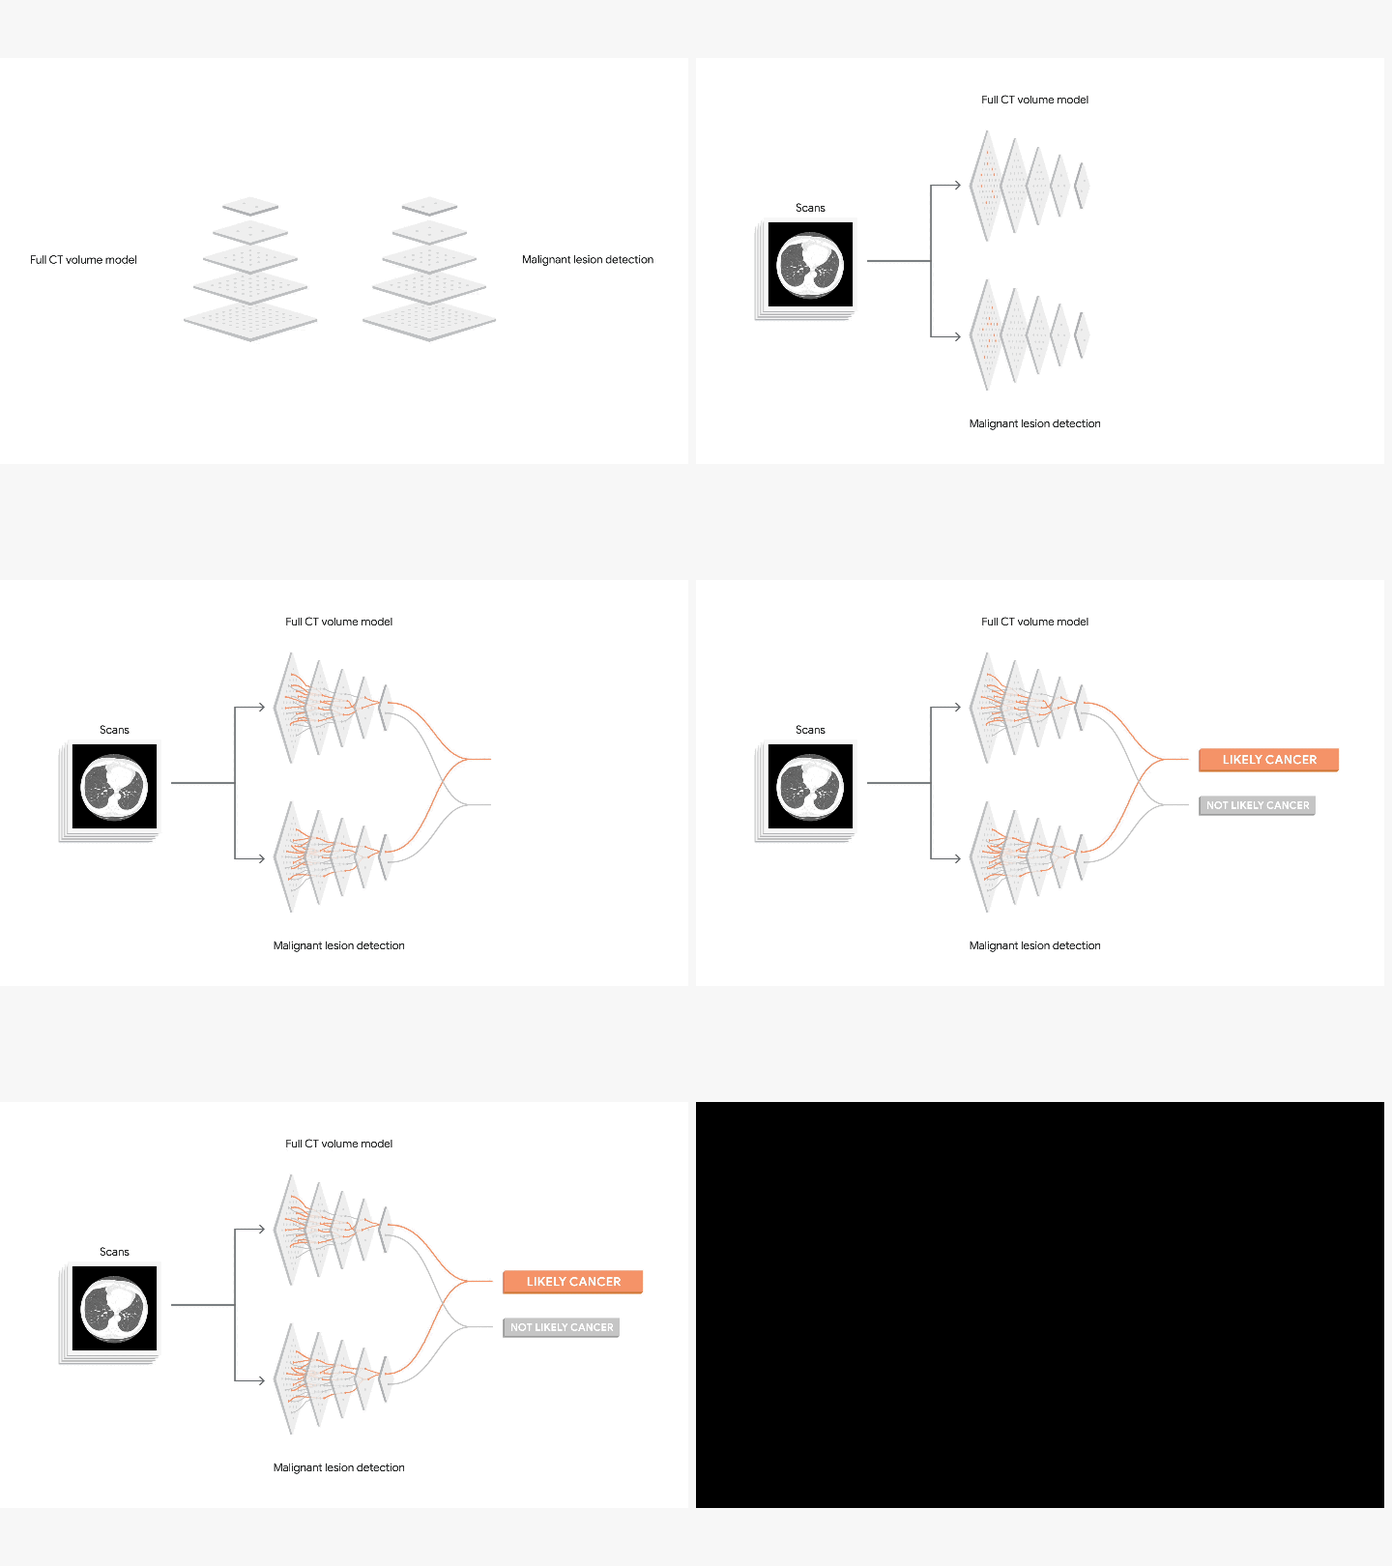
Radiologists typically look through hundreds of 2D images within a single CT scan and cancer can be miniscule and hard to spot. We created a model that can not only generate the overall lung cancer malignancy prediction (viewed in 3D volume) but also identify subtle malignant tissue in the lungs (lung nodules). The model can also factor in information from previous scans, useful in predicting lung cancer risk because the growth rate of suspicious lung nodules can be indicative of malignancy.

lung cancer model.gif

This is a high level modeling framework. For each patient, the AI uses the current CT scan and, if available, a previous CT scan as input. The model outputs an overall malignancy prediction.

In our research, we leveraged 45,856 de-identified chest CT screening cases (some in which cancer was found) from NIH’s research dataset from the National Lung Screening Trial study and Northwestern University. We validated the results with a second dataset and also compared our results against 6 U.S. board-certified radiologists.

When using a single CT scan for diagnosis, our model performed on par or better than the six radiologists. We detected five percent more cancer cases while reducing false-positive exams by more than 11 percent compared to unassisted radiologists in our study. Our approach achieved an AUC of 94.4 percent (AUC is a common common metric used in machine learning and provides an aggregate measure for classification performance).

lung cancer scan.gif

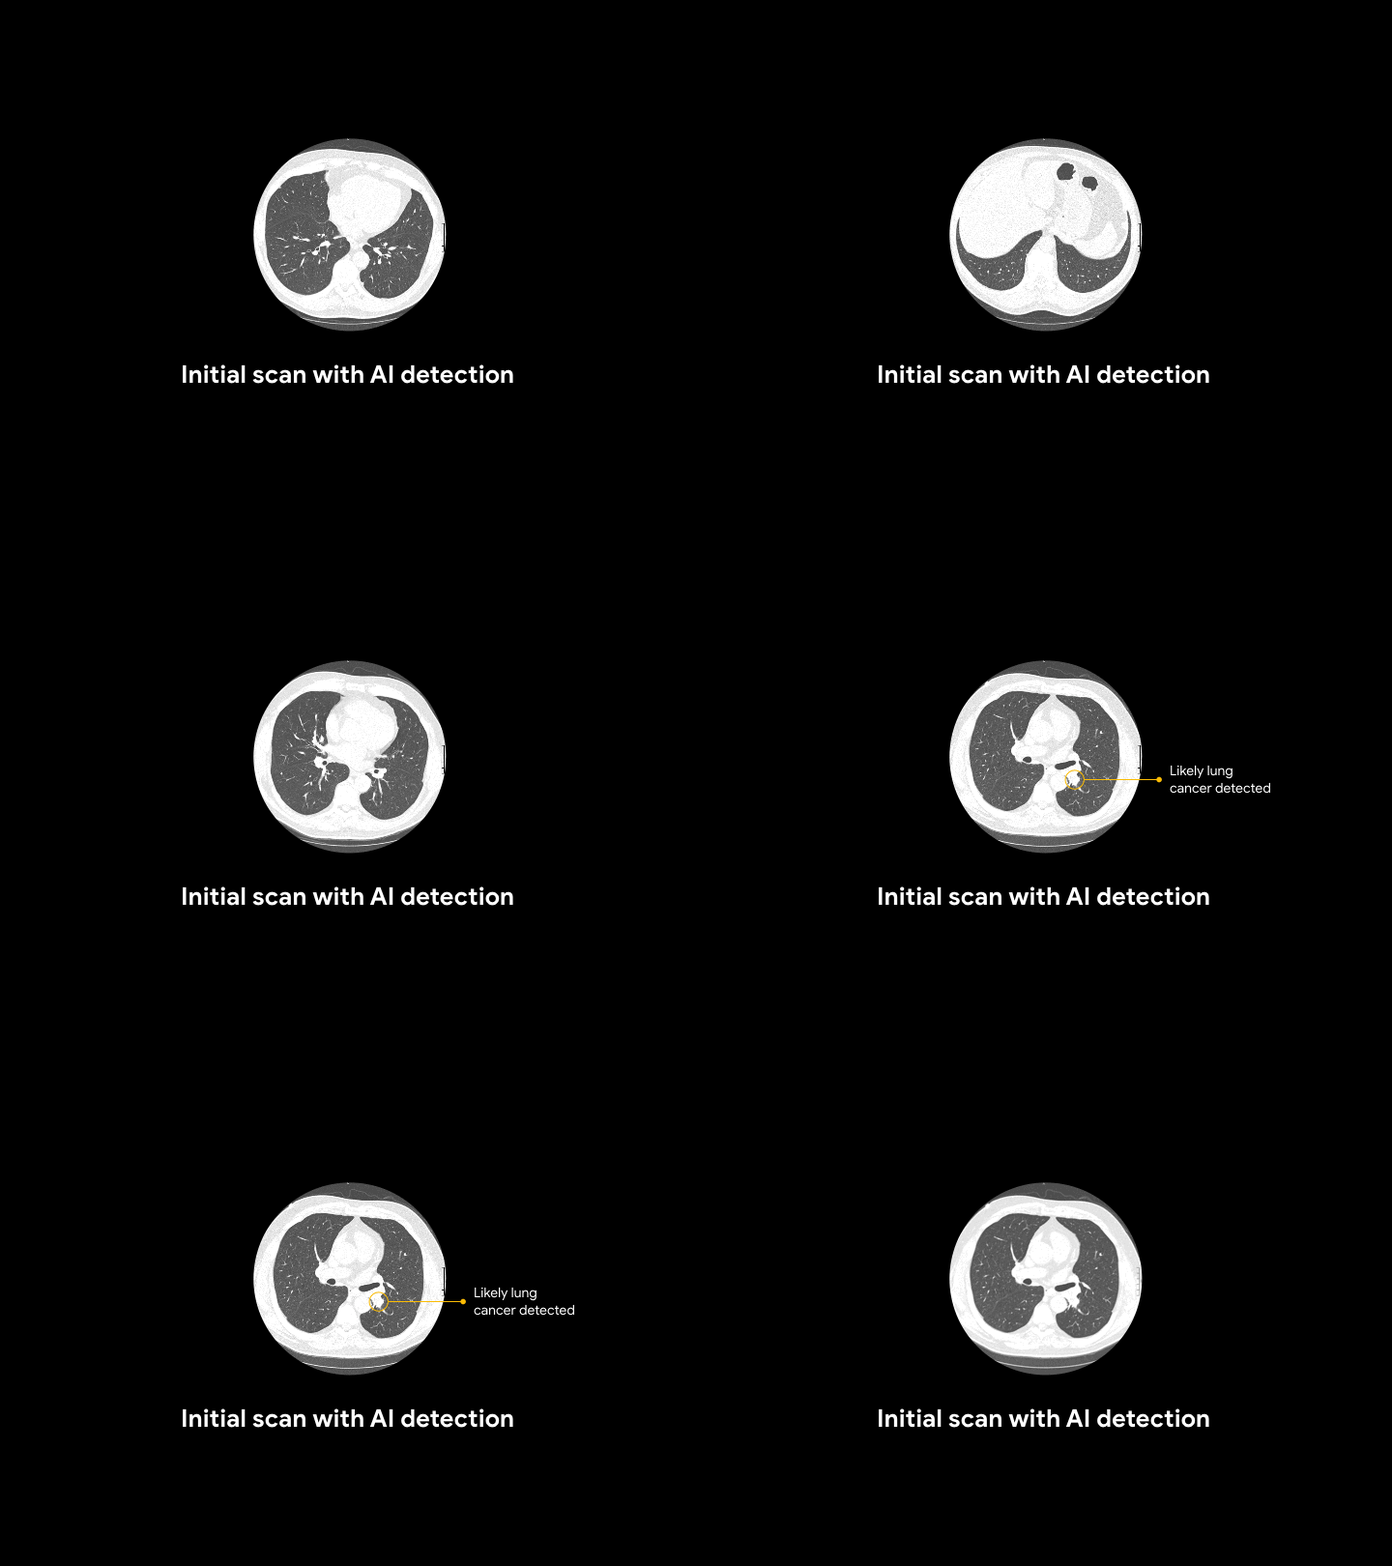
For an asymptomatic patient with no history of cancer, the AI system reviewed and detected potential lung cancer that had been previously called normal.

Next steps

Despite the value of lung cancer screenings, only 2-4 percent of eligible patients in the U.S. are screened today. This work demonstrates the potential for AI to increase both accuracy and consistency, which could help accelerate adoption of lung cancer screening worldwide.

These initial results are encouraging, but further studies will assess the impact and utility in clinical practice. We’re collaborating with Google Cloud Healthcare and Life Sciences team to serve this model through the Cloud Healthcare API and are in early conversations with partners around the world to continue additional clinical validation research and deployment. If you’re a research institution or hospital system that is interested in collaborating in future research, please fill out this form.


New milestones in helping prevent eye disease with Verily

Diabetes is at an all-time high around the world, and the number of people living with the disease is only increasing. Many complications can arise from diabetes, including diabetic retinopathy (DR) and diabetic macular edema (DME)—two of the leading causes of preventable blindness in adults. In India, a shortage of more than 100,000 eye doctors—and the fact that only 6 million out of 72 million people with diabetes are screened for diabetic eye disease—mean that many individuals go undiagnosed and untreated.


Over the last three years, Google and Verily—Alphabet’s life sciences and healthcare arm—have developed a machine learning algorithm to make it easier to screen for disease, as well as expand access to screening for DR and DME. As part of this effort, we’ve conducted a global clinical research program with a focus on India. Today, we’re sharing that the first real world clinical use of the algorithm is underway at the Aravind Eye Hospital in Madurai, India.
ML graphic

How the machine learning screening works at the hospital in Madurai

Thousands of patients come through the doors of Aravind Eye Hospital and vision centers every day. Dr. R. Kim, chief medical officer and chief of retina services, says that by integrating our machine learning algorithm into their screening process, “physicians like me have more time to work closely with patients on treatment and management of their disease, while increasing the volume of screenings we can perform."

Aravind Eye Hospital.png

Screening using the algorithm at the Aravind Eye Hospital with a trained technician.

Building off our initial efforts, we believe our machine learning algorithm could be helpful in many other areas of the world where there aren’t enough eye doctors to screen a growing population with diabetes. As part of our broader screening collaboration, our partners at Verily have received CE mark for the algorithm, which means that the software has met the European Union Directive’s standards for medical devices, further validating our approach. In addition, late in 2018 we announced our research efforts in Thailand and this year we’ll expand our research and clinical efforts globally, with the goal of screening more people and preventing disease.


To read more about our research to date, visit JAMA, Ophthalmology and Nature Biomedical Engineering.

Expanding the Application of Deep Learning to Electronic Health Records


In 2018 we published a paper that showed how machine learning, when applied to medical records, can predict what might happen to patients who are hospitalized: for example, how long they would need to be in the hospital and, if discharged, how likely they would be to come back unexpectedly. Predictive models of various kinds have already been deployed in hospital settings by others, and our work aims to further improve potential clinical benefit by using new models that can make predictions faster, more accurate, and more adaptable for a broader range of clinical contexts.

Any endeavor to demonstrate the promise of machine learning requires intense collaboration between engineers, doctors, and medical researchers to make sure the work benefits patients, physicians, and health systems, and that it is equitable. Google is already fortunate to partner with some of the best academic medical centers in the world and we are now expanding this work to include Intermountain Healthcare, based in Utah.
The initial collaboration will focus on understanding how Google might adapt machine learning predictions to the various Intermountain care settings, from primary care clinics to the TeleHealth critical care unit, which remotely monitors critically ill patients in surrounding hospitals. We see potential in exploring how scalable computing platforms that include predictions might assist clinical teams in providing the best possible care.

As with our previous research, we will begin with jointly testing the performance of machine learning models on historical records, following strict policies to ensure that all data privacy and security measures are followed.

We are excited to explore how scalable computing platforms that include predictions might assist clinical teams in providing the best possible care in these settings. We additionally hope to further validate that our approach to predictions can work across health systems and improve care for patients.

Source: Google AI Blog


Improving the Effectiveness of Diabetic Retinopathy Models


Two years ago, we announced our inaugural work in training deep learning models for diabetic retinopathy (DR), a complication of diabetes that is one of the fasting growing causes of vision loss. Based on this research, we set out to apply our technology to improve health outcomes in the world. At the same time, we’ve continued our efforts to improve the model’s performance, explainability, and applicability in clinical settings. Today, we are sharing our research progress toward these goals, as well as announcing a new partner in Thailand.

Improving Model Performance with High-quality Labels
The performance of DR deep learning models is critically important, especially when subtle errors have the potential to generate a misdiagnosis. Earlier this year we published a paper in the journal Ophthalmology that looked at how we could improve our model by 1) moving toward a more granular 5-point grading scale (versus the previous 2-class system) and 2) incorporating adjudication by a panel of retinal specialists. During the adjudication process, a group of retinal specialists debated any case with disagreement until everyone agreed on the final grade. Compared to simply taking a majority vote, this method of resolving disagreements was more accurate and allowed for the identification of subtle findings, such as microaneurysms.

To increase the efficiency of the adjudication process, we carefully selected a small subset (0.22%) of images to use as a tuning set, substantially improving model performance by optimizing model hyperparameters on this more accurate reference standard. When we subsequently measured the rate of agreement against a test set of images with an adjudicated reference standard, the kappa scores (a measurement of agreement that ranges from 0 [random] to 1 [perfect agreement]) for individual retinal specialists, ophthalmologists, and the algorithm ranged from 0.82-0.91, 0.80-0.84, and 0.84, respectively.

Making our Models More Transparent
As we deploy this technology, it is important that we take the proper steps to ensure that it is transparent and trusted. To that end, we have been exploring ways to explain how the model is making its predictions, with the goal of making the DR model a better diagnostic tool and aid for doctors.

In our latest study, to be published today in Ophthalmology, we demonstrate methods by which explanations of deep learning algorithms can be shown to ophthalmologists to increase both the accuracy and confidence of their grading for diabetic eye disease. Using the results of the model trained and validated on high quality labels from our earlier study, we generated different forms of potential assistance for general ophthalmologists. We presented to the physicians the algorithm’s predicted scores for different DR severity levels as well as heatmaps highlighting image regions that most strongly drove its predictions. Using this assistance, we saw a significant increase in physicians’ diagnostic accuracy, as well as improved confidence in their diagnosis.

We saw clear evidence that showing model predictions could help physicians catch pathology they otherwise might have missed. In the retinal image below, our adjudication panel found signs of vision-threatening DR. This was missed by 2 of 3 doctors who graded it without assistance; but caught by all 3 doctors who graded it when they saw the model predictions (which accurately detected the pathology).
On the left is a fundus image graded as having proliferative (vision-threatening) DR by an adjudication panel of ophthalmologists (ground truth). On the top right is an illustration of our deep learning model’s predicted scores (“P” = proliferative, the most severe form of DR). On the bottom right is the set of grades given by physicians without assistance (“Unassisted”) and those who saw the model’s predictions (“Grades Only”).
We also saw evidence that physicians and the model can work together in a way that provides more accuracy than either individually. In the retinal image below, our adjudication panel of retina specialists considered it to have moderate DR. Without assistance, two out of three ophthalmologists grading the image marked it as no DR. In real-world settings, this situation could result in a patient missing a needed referral to a specialist.
On the left is a retinal fundus image graded as having moderate DR (“Mo”) by an adjudication panel of ophthalmologists (ground truth). On the top right is an illustration of the predicted scores (“N” = no DR, “Mi” = Mild DR, “Mo” = Moderate DR) from the model. On the bottom right is the set of scores given by physicians without assistance (“Unassisted”) and those who saw the model’s predictions (“Grades Only”).
In this particular case, our model also indicated evidence for no DR. However, when ophthalmologists saw the model’s predictions, all three gave the correct answer. Seeing that the model saw some evidence for Moderate -- even if it wasn’t the highest score -- may prompt doctors to examine particular cases more carefully for pathology they may otherwise miss. We are excited to develop assistance that works like this, where human and machine learning abilities complement each other.

A New Partner in our Global Efforts
With the help of screening programs and in collaboration with Verily, we have laid a robust foundation for the implementation of these highly accurate systems in real world clinical settings. Working with doctors at Aravind Eye Hospitals and Sankara Nethralaya in India, and now, through our new partnership with the Rajavithi Hospital, affiliated with the Department of Medical Services, Ministry of Public Health in Thailand, we are validating the model performance with patients from broad screening programs. Given the positive results of our model on their real patient population, we are now beginning to pilot the model in their screening programs. We’re looking forward to a very busy 2019!

Source: Google AI Blog


Improved Grading of Prostate Cancer Using Deep Learning


Approximately 1 in 9 men in the United States will develop prostate cancer in their lifetime, making it the most common cancer in males. Despite being common, prostate cancers are frequently non-aggressive, making it challenging to determine if the cancer poses a significant enough risk to the patient to warrant treatment such as surgical removal of the prostate (prostatectomy) or radiation therapy. A key factor that helps in the “risk stratification” of prostate cancer patients is the Gleason grade, which classifies the cancer cells based on how closely they resemble normal prostate glands when viewed on a slide under a microscope.

However, despite its widely recognized clinical importance, Gleason grading of prostate cancer is complex and subjective, as evidenced by studies reporting inter-pathologist disagreements ranging from 30-53% [1][2]. Furthermore, there are not enough speciality trained pathologists to meet the global demand for prostate cancer pathology, especially outside the United States. Recent guidelines also recommend that pathologists report the percentage of tumor of different Gleason patterns in their final report, which adds to the workload and is yet another subjective challenge for the pathologist [3]. Overall, these issues suggest an opportunity to improve the diagnosis and clinical management of prostate cancer using deep learning–based models, similar to how Google and others used such techniques to demonstrate the potential to improve metastatic breast cancer detection.

In “Development and Validation of a Deep Learning Algorithm for Improving Gleason Scoring of Prostate Cancer”, we explore whether deep learning could improve the accuracy and objectivity of Gleason grading of prostate cancer in prostatectomy specimens. We developed a deep learning system (DLS) that mirrors a pathologist’s workflow by first categorizing each region in a slide into a Gleason pattern, with lower patterns corresponding to tumors that more closely resemble normal prostate glands. The DLS then summarizes an overall Gleason grade group based on the two most common Gleason patterns present. The higher the grade group, the greater the risk of further cancer progression and the more likely the patient is to benefit from treatment.
Visual examples of Gleason patterns, which are used in the Gleason system for grading prostate cancer. Individual cancer patches are assigned a Gleason pattern based on how closely the cancer resembles normal prostate tissue, with lower numbers corresponding to more well differentiated tumors. Image Source: National Institutes of Health.
To develop and validate the DLS, we collected de-identified images of prostatectomy samples which contain a greater amount and diversity of prostate cancer than needle core biopsies, even though the latter is the more common clinical procedure. On the training data, a cohort of 32 pathologists provided detailed annotations of Gleason patterns (resulting in over 112 million annotated image patches) and an overall Gleason grade group for each image. To overcome the previously referenced variability in Gleason grading, each slide in the validation set was independently graded by 3 to 5 general pathologists (selected from a cohort of 29 pathologists) and had a final Gleason grade assigned by a genitourinary-specialist pathologist to obtain the ground-truth label for that slide.

In the paper, we show that our DLS achieved an overall accuracy of 70%, compared to an average accuracy of 61% achieved by US board-certified general pathologists in our study. Of 10 high-performing individual general pathologists who graded every slide in the validation set, the DLS was more accurate than 8. The DLS was also more accurate than the average pathologist at Gleason pattern quantitation. These improvements in Gleason grading translated into better clinical risk stratification: the DLS better identified patients at higher risk for disease recurrence after surgery than the average general pathologist, potentially enabling doctors to use this information to better match patients to therapy.
Comparison of scoring performance of the DLS with pathologists. a: Accuracy of the DLS (in red) compared with the mean accuracy among a cohort-of-29 pathologists (in green). Error bars indicate 95% confidence intervals. b: Comparison of risk stratification provided by the DLS, the cohort-of-29 pathologists, and the genitourinary specialist pathologists. Patients are divided into low and high risk groups based on their Gleason grade group, where a larger separation between the Kaplan-Meier curves of these risk groups indicates better stratification.
We also found that the DLS was able to characterize tissue morphology that appeared to lie at the cusp of two Gleason patterns, which is one reason for the disagreements in Gleason grading observed between pathologists, suggesting the possibility of creating finer grained “precision grading” of prostate cancer. While the clinical significance of these intermediate patterns (e.g. Gleason pattern 3.3 or 3.7) is not known, the increased precision of the DLS will enable further research into this interesting question.
Assessing the region-level classification of the DLS. a: Annotations from 3 pathologists compared to DLS predictions. The pathologists show general concordance on the location and the extent of tumor areas, but poor agreement in classifying Gleason patterns. The DLS’s precision Gleason pattern for each region is represented by interpolating between the DLS’s prediction patterns for Gleason patterns 3 (green), 4 (yellow), and 5 (red). b: DLS prediction
patterns compared to the distribution of pathologists’ Gleason pattern classifications on 41 million annotated image patches from the test dataset. On patches where pathologists are discordant, where the tissue is more likely to be on the cusp of two patterns, the DLS reflects this ambiguity in it's prediction scores.
While these initial results are encouraging, there is much more work to be done before systems like our DLS can be used to improve the care of prostate cancer patients. First, the accuracy of the model can be further improved with additional training data and should be validated on independent cohorts containing a larger number and more diverse group of patients. In addition, we are actively working on refining our DLS system to work on diagnostic needle core biopsies, which occur prior to the decision to undergo surgery and where Gleason grading therefore has a significantly greater impact on clinical decision-making. Further work will be needed to assess how to best integrate our DLS into the pathologist’s diagnostic workflow and the impact of such artificial-intelligence based assistance on the overall efficiency, accuracy, and prognostic ability of Gleason grading in clinical practice. Nonetheless, we are excited about the potential of technologies like this to significantly improve cancer diagnostics and patient care.

Acknowledgements
This work involved the efforts of a multidisciplinary team of software engineers, researchers, clinicians and logistics support staff. Key contributors to this project include Kunal Nagpal, Davis Foote, Yun Liu, Po-Hsuan (Cameron) Chen, Ellery Wulczyn, Fraser Tan, Niels Olson, Jenny L. Smith, Arash Mohtashamian, James H. Wren, Greg S. Corrado, Robert MacDonald, Lily H. Peng, Mahul B. Amin, Andrew J. Evans, Ankur R. Sangoi, Craig H. Mermel, Jason D. Hipp and Martin C. Stumpe. We would also like to thank Tim Hesterberg, Michael Howell, David Miller, Alvin Rajkomar, Benny Ayalew, Robert Nagle, Melissa Moran, Krishna Gadepalli, Aleksey Boyko, and Christopher Gammage. Lastly, this work would not have been possible without the aid of the pathologists who annotated data for this study.

References
  1. Interobserver Variability in Histologic Evaluation of Radical Prostatectomy Between Central and Local Pathologists: Findings of TAX 3501 Multinational Clinical Trial, Netto, G. J., Eisenberger, M., Epstein, J. I. & TAX 3501 Trial Investigators, Urology 77, 1155–1160 (2011).
  2. Phase 3 Study of Adjuvant Radiotherapy Versus Wait and See in pT3 Prostate Cancer: Impact of Pathology Review on Analysis, Bottke, D., Golz, R., Störkel, S., Hinke, A., Siegmann, A., Hertle, L., Miller, K., Hinkelbein, W., Wiegel, T., Eur. Urol. 64, 193–198 (2013).
  3. Utility of Quantitative Gleason Grading in Prostate Biopsies and Prostatectomy Specimens, Sauter, G. Steurer, S., Clauditz, T. S., Krech, T., Wittmer, C., Lutz, F., Lennartz, M., Janssen, T., Hakimi, N., Simon, R., von Petersdorff-Campen, M., Jacobsen, F., von Loga, K., Wilczak, W., Minner, S., Tsourlakis, M. C., Chirico, V., Haese, A., Heinzer, H., Beyer, B., Graefen, M., Michl, U., Salomon, G., Steuber, T., Budäus, L. H., Hekeler, E., Malsy-Mink, J., Kutzera, S., Fraune, C., Göbel, C., Huland, H., Schlomm, T., Clinical Eur. Urol. 69, 592–598 (2016).

Source: Google AI Blog