Tag Archives: Features

Real-Time Data Validation with Google Tag Assistant Recordings

We’ve said it before and we’ll say it again: great analytics can only happen with great data.  

That's why we've made it a priority to help our users confirm that their data is top-quality. Last year we released our automated data diagnostics feature, and now we’re proud to announce the launch of another powerful new feature: Google Tag Assistant Recordings.  

This tool helps you instantly validate your Google Analytics or Google Analytics Premium implementation. If it finds data quality issues, it helps you troubleshoot them and then recheck them on the spot.  It’s available as part of the Google Tag Assistant Chrome Extension.
Screen Shot 2015-07-21 at 2.27.31 PM.png
"Tag Assistant Recordings is fast becoming one of my favorite tools for debugging Google Analytics Premium installations!  I use it multiple times a day with my Premium clients to help explain odd trends in their data or debug configuration issues. Already I'm building it into my core workflow." 

- Dan Rowe, Director of Analytics at Analytics Pros

What can I use it for?

Tag Assistant Recordings works with all kinds of data events: purchases, logins, and so on. What if you sell flowers online and want to confirm that Enhanced Ecommerce is capturing the checkout flow correctly? With Tag Assistant Recordings, you can record yourself going through the checkout process as you buy a dozen red roses, and then review what Google Analytics captured.

If you find that your account isn’t set up properly — if the sale wasn't recorded or was mis-labeled — you can make adjustments and test it all over again instantly.  With Tag Assistant Recordings, you know you’re capturing all the data that’s important to you.

Tag Assistant Recordings can be particularly useful when (1) you’re in the process of implementing Google Analytics or Google Analytics Premium, (2) you’ve recently made updates to your site, or (3) you’re making changes to your Google Analytics or Google Analytics Premium configuration. It works even if your new site or your updates aren't visible to the public yet, so you can feel confident before you go live.

Tag Assistant Recordings can also help if you want to reconfigure your Google Analytics account to better reflect your business.  For example, you may want to configure multi-channel funnels to detect your AdWords channel.  Tag Assistant Recordings lets you set up this new functionality in Google Analytics and test immediately whether everything is working as you expect.  

"Tag Assistant Recordings has already been a HUGE help! Analytics Pros and About.com were working on an issue with sessions double-counting and Tag Assistant Recordings let us narrow down precisely which hits were having new sessions counted. It saved us hours of time and helped us jump right to where the problem was. So, in summary, this is awesome!"  

- Greg McDonald, Business Intelligence Analyst at About.com

How does it work?

Tag Assistant Recordings works through the Google Tag Assistant Chrome Extension, so you’ll need to download the extension if you aren’t already using it.  From there, setup is easy.  Simply open Google Tag Assistant, record the user flow you’d like to check, and then view the full report in Tag Assistant.  You’ll want to view both tabs in the report (Tag Assistant and Google Analytics) to verify that you see the intended tags.  Keep in mind that the Google Analytics data is only available if you have access to the appropriate property or view.

Tag Recordings Gif.gif

Here's a nifty bonus: If you find a problem, and you think you have fixed it by changing settings from within Google Analytics, return to the Google Analytics tab in Tag Assistant Recordings and click the “Update” button. You'll see instantly how your configuration changes would have affected this recording.

We hope that Google Tag Assistant will be a valuable new tool in your analytics toolkit.  

Why not start using it today?


Posted by:  Ajay Nainani, Frank Kieviet, and Jocelyn Whittenburg, Google Analytics team

Introducing Trash Can: Data Recovery in Google Analytics

We all make mistakes, but the damage might seem irrevocable when accidentally deleting crucial reporting information from Google Analytics. Thanks to feedback from our users, we’re pleased to introduce a new feature to provide a safety net each time you delete a view, property or account from your Google Analytics account: the Trash Can.

To get started, navigate to the Administration tab, select an account, and click the Trash Can feature on the left-hand panel. Check off what you want to reclaim, click “Restore,” and voilà! Your view, property or account is now just as it was before you deleted it. Once 35 days pass from the day you originally trashed it, however, you’ll have to say a final goodbye as the data will be removed from the Trash Can and will no longer appear there. 


This feature will be rolling out to all Google Analytics accounts in the coming weeks, but don’t worry–anything you’ve deleted starting today will still show up in the Trash Can once you get the feature update in your account. 

Many people rely on Google Analytics to collect, analyze, and report on data in order to make good business decisions. We hope that the Trash Can is just one more way to ensure that you have all the information you need when you need it. To learn more details about the Trash Can feature, please read this Help Center article.

Posted by Chris Cahill, Michael Masukawa, and Dan Morenus

Simplify your Google Analytics Reporting with Add-ons for Google Sheets

It's common for Google Analytics users to use spreadsheets to analyze their Google Analytics data or combine it with another data source. But exporting your data from Google Analytics to Google Sheets is a manual process, and it can be tedious if you run reports frequently or manage multiple accounts. With the release of Add-ons for Google Sheets, getting your Google Analytics data into Google Sheets has never been easier!

Add-ons allow you to extend the power of Google Sheets by automating common tasks and integrating with external services. The Google Analytics Spreadsheet Add-on allows you to access your Google Analytics data, right from within a spreadsheet!


The Google Analytics Spreadsheet Add-on
The Google Analytics Spreadsheet Add-on combines the power of the Google Analytics API with the rich feature set of Google Sheets, making it easier for Google Analytics users to access, visualize, share, and manage their data. With this add-on you can:
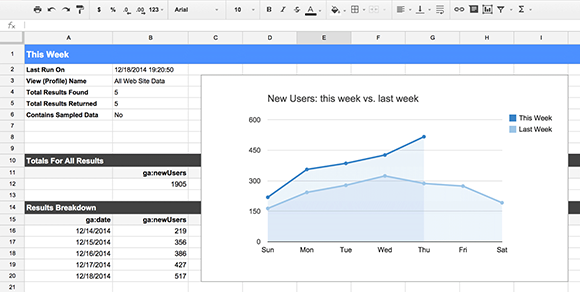
  • Query and report data from multiple views.
  • Compute and display custom calculations.
  • Create visualizations and embed those visualizations on third-party websites.
  • Schedule your reports to run and update automatically.
  • Control who can see your data and visualizations by using Google Sheets' sharing and privacy features.
But perhaps the best way to find out what the Google Analytics Spreadsheet Add-on can do is to see it in action. In this short video I introduce the add-on, show you how to install it, and walk you through creating your first report.


If you want to go deeper, you can watch this more advanced video where I explain in detail the process of building a complete dashboard that automatically updates and can be embedded on a third-party website.


If you have more questions about how to use the add-on, check out the documentation. It explains each of its features and configuration options in much more detail.

Supermetrics and Analytics Canvas add-ons
The Google Analytics Spreadsheet Add-on gives users a powerful yet user-friendly way to access their Google Analytics data, but it doesn't solve all business integration needs.

For more advanced business and data-integration solutions, I strongly recommend trying out these two excellent Google Sheets add-ons created by our technology partners:
Both of these add-ons integrate with Google Analytics as well as a variety of other platforms and services such as Facebook, Twitter, Microsoft Office, and many more. Free and premium versions are available. 

Feedback and Support
Add-ons are a great way to automate the process of getting your Google Analytics data into Google Sheets. We hope you take the time to try out these add-ons and see how they can improve your workflow.

If you use the Google Analytics Spreadsheet Add-on, we'd love to know what you think. You can leave a review in the Chrome Web Store, ask any questions you have in the add-on discussion group, or submit feedback directly from within Google Sheets.

Any and all feedback is welcome!

By: Philip Walton, Developer Programs Engineer, Google Analytics

Brian Gavin Diamonds Sees 60% Increase in Customer Checkout with Enhanced Ecommerce

"Enhanced Ecommerce in Google Analytics made it extremely easy to analyze the metrics that are important to an ecommerce site and garner the insights to make smart changes to our website, driving significant improvements in performance!"
-- Danny Gavin, VP and Director of Marketing at Brian Gavin Diamonds

Our Enhanced Ecommerce features in Google Analytics are officially out of beta today, complete with brand new tools like Product Attribution. Combined with our new Shopping Campaigns report, Google Analytics provides our retail clients with an integrated view of their customers. As part of today’s announcements, we’re also excited to highlight partnerships with Shopify, PrestaShop, Blue Acorn for Magento, and mShopper. Using Enhanced Ecommerce in conjunction with our partners’ products simplifies the implementation process and gives you a full set of tools to create and optimize your ecommerce site. Please see the end of this post for more information about our partners’ solutions.

Understand customer behavior
Enhanced Ecommerce provides insight into the customer’s path to purchase, like when customers added items to cart, started the checkout process, and completed a purchase. Importantly, Enhanced Ecommerce gives you the ability to identify segments of customers who are falling out of the shopping funnel. You can then focus on these high intent-to-purchase customers with remarketing or by optimizing your checkout flow. Brian Gavin Diamonds, a Texas-based jewelry design house that is renowned for its signature hearts and arrows diamonds and custom jewelry design, used Enhanced Ecommerce to discover that in a single month they had missed out on more than half a million dollars in sales due to cart abandonment at the customer login page.  The company worked quickly to optimize their checkout flow with guest checkout functionality and immediately realized a 60% increase in customers completing the checkout process to payment.  You can read more about Brian Gavin Diamonds’ success with Enhanced Ecommerce in our case study.


Optimize online merchandising to increase sales 
Once you’ve gotten users to your site, Enhanced Ecommerce allows you to optimize the onsite experience to drive sales. By using Product Lists, you can identify how customers are discovering and interacting with products before purchasing them. Armed with this information, you can analyze your onsite promotions in order to build a more effective merchandising strategy, or use the product attribution functionality to understand which product lists drive conversions.

In an increasingly mobile world, this information is critically important since screen real estate is limited and must be used wisely. For retailers with mobile apps, the Google Analytics SDK fully supports Enhanced Ecommerce, so you can do rich analysis of product performance and customer behavior across all sales channels.  Across both desktop and mobile, Enhanced Ecommerce delivers the information you need to increase sales on your site.

Drive revenue with Shopping Campaign reports
Today, we’re also introducing a new Shopping Campaigns report as part of the AdWords reporting section in Google Analytics.  This feature will be rolled out over the next few weeks and will allow you to analyze the performance of your shopping campaigns.  With this functionality, you’ll have the ability to understand the product categories/types that are driving site engagement and revenue and use this information to optimize your bids.  So, how can you get started?  If you have already linked your Adwords and your Google Analytics accounts, this report will automatically appear in the Adwords reporting section of your Analytics account.  Not linked yet?  Simply follow these instructions to link the two accounts.


Get Enhanced Ecommerce with our partner integrations
Shopify, PrestaShop, Blue Acorn for Magento, and mShopper have partnered with us to integrate Enhanced Ecommerce as part of their ecommerce solutions. If you’re using one of these platforms, you can take advantage of Enhanced Ecommerce by enabling one of these pre-built integrations.  Shopify’s solution is available today while solutions for Prestashop, Blue Acorn, and mShopper will be available in the coming week. To learn more about our featured partners, please visit our partner page

Google Analytics Enhanced Ecommerce is built to help you understand your customers and optimize your sales conversions. Combined with Shopping Campaign reports, Google Analytics is a complete solution for ecommerce businesses.  For more information about how to implement this feature in your Google Analytics account, please see the documentation available in our help center.

Posted by Marcia Jung, Product Manager, on behalf of the Google Analytics team

More about our partners

Shopify is a commerce platform that allows anyone to easily sell online, at their retail location, and everywhere in between. Shopify offers a professional online storefront, a payment solution to accept credit cards, a point of sale system to power retail sales and a card reader to process credit card transactions through a mobile phone. Shopify currently powers over 120,000 retailers in 150 different countries, including: Tesla Motors, Gatorade, Google, Wikipedia, LA Lakers, CrossFit, and many more. 

PrestaShop is a world industry leader in Open Source solutions for ecommerce, whose mission is to challenge ecommerce limits by developing a powerful solution that is accessible to anyone, anywhere. Through the Open Source software, PrestaShop allows everyone to create online stores quickly, easily and for free. The company currently counts more than 200,000 online stores worldwide, 700,000 community members and over 4 million software downloads.

Blue Acorn is a premium eCommerce agency dedicated to helping retailers and brands achieve revenue growth through a comprehensive, data-driven approach. In order to best support this approach, they became the first Magento Solution Partner in the world to also hold certified partnerships with Google and Optimizely. By integrating data and testing throughout their services, they are able to help their clients make the best decisions possible and further support their best-in-class design, development, and optimization capabilities.

mShopper is a leading mobile commerce platform that allows retailers to create custom, mobile-optimized e-commerce sites designed specifically to increase sales on mobile devices. The integration with Enhanced Ecommerce will provide a dramatic impact on mobile commerce conversions for retailers by delivering superior insight on product sales and overall campaign performance. mShopper recently launched mStore® v4.1 with marketing tools and a performance dashboard to drive conversions and improve sales for customers using mobile devices as well.


The Top 3 Google Analytics Configuration Issues Impacting your Data (and How to Fix Them)

Good data is important.  How important?  Studies show that inaccurate data has a direct impact on the bottom line of 88% of companies.  In fact, the average company loses 12% of its revenue due to bad data.  As you know, Google Analytics is a powerful product with a wealth of features to help you optimize your results online. However, to unleash the power of Google Analytics’ marketing tools, you must ensure the data collected is complete and of the highest quality. The insights that fuel action in Analytics depend on good data, especially for some of our advanced algorithmic marketing functionalities like data driven attribution.

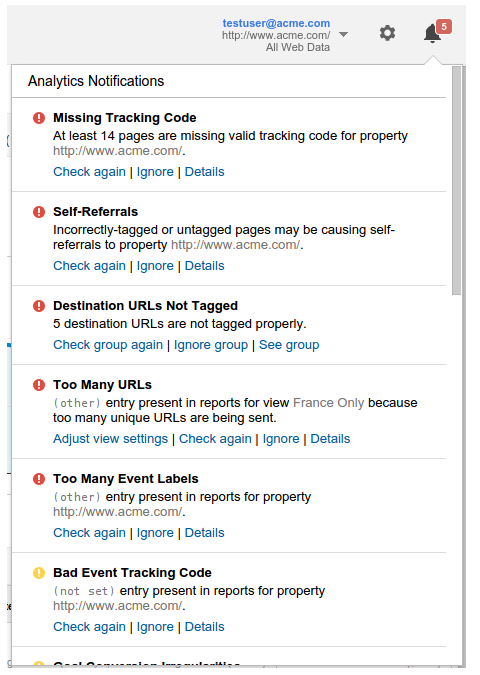
Since its release two months ago, our popular new diagnostics tool is working hard to ensure you’re getting the best results. Today, we’d like to share insights into some of the most common account errors along with likely causes and suggested solutions. In particular, we’ll look at some solutions for when our diagnostics tool is telling you the following:  “Bad Default URL,” “Clicks and Sessions Discrepancy,” and “No Goal Conversions.”  Read on to understand the impact of these issues as well as their common causes.


Bad Default URL
“Data without quality is useless.”
João Correia, Analytics Strategist at Blast Analytics & Marketing

When you create a Google Analytics account for website tracking, one of the first questions we ask is for a default URL. This is generally the homepage of your website. Diagnostics ensures that you have tagged your default URL correctly for this property, and warns you if this is not the case. Having a properly tagged website is an essential step towards being able to understand consumer behavior.

This warning is generally caused by either missing or malformed tracking code installed on your default URL, or more simply a typo in the URL that was input. If the default URL is incorrect, simply login to your Google Analytics account, click the “Admin” button in the header, and click “Property Settings” to adjust your default URL. If the tracking code is flawed, you’ll want to talk to your webmaster and ask to have the tracking code correctly installed

Beyond the default URL, we also check for tracking code health across your site. We look for pages that have missing or malformed tags. And we continually run these checks, ensuring new pages you launch in the future also are properly tagged. 

Clicks / Session Discrepancies
"Diagnostics helped me identify and fix an AdWords data discrepancy in my account.  Without the tool, I may have never even realized that my data was inconsistent.  This is a great tool!"
Monika Rut-Koroglu, Digital Analytics and Optimization at FXCM

Google Analytics offers rich capabilities that help users share data with linked AdWords accounts and gain unique and powerful marketing insights. It’s common to expect the number of clicks you see in AdWords to match the number of sessions you see in Analytics; but this is not always the case. This discrepancy can slow down meaningful analysis, and is a situation that can and should be rectified.

The most common causes of this issue have to do with your configuration settings. For example, when you send ad clicks through a third party that redirects to your site; the third party will often times drop vital tagging parameters which are mandatory for Analytics and AdWords to associate clicks and sessions. Other examples are having AdWords auto-tagging disabled, and redirecting users to mobile sites while unintentionally dropping tagging parameters.

Fixes for these issues can vary; we have a detailed guide to walk users through this or you can follow prompts in Google Analytics when we identify specific actions for you to take. If you have a third party who uses redirects and drops parameters, talk to them to resolve the issue. If auto-tagging is disabled on your AdWords accounts, consider enabling it

No Goal Conversions
“[Google Analytics Diagnostics] is a great idea... Just discovered it the other day on my iPad. Helpful to let me redefine my goals better and find out what's not working.”
Sherri Matthew, Harpist and Small Business Owner

Google Analytics goals offer valuable ways to identify, track, and help you drive more valuable outcomes. Sometimes goals can break, and stop this critical stream of insights from reaching you. We run diagnostic checks to ensure your goals continually identify a steady flow of high value customers, and we warn you if this flow breaks.

The most common cause for goal breakage is when a goal is based on a URL that changes. If your webmaster updates the URLs on your site, and the URLs in the goal settings aren’t updated accordingly, this will cause your goal to stop tracking. The second most common cause for goals breaking is if the event tracking on your site changes and the events listed in the goal aren’t updated accordingly.

If you’ve had a goal break for these reasons, visit the “Admin” section via a link in the header of your Google Analytics account, and click “Goals” to correct your goal configurations.

More About Diagnostics
Google Analytics Diagnostics scans for problems every day (with some exceptions). It inspects your site tagging, account configuration, and reporting data for potential data-quality issues.  Only users with Edit permission can see and respond to diagnostics messages. Diagnostics honors the first response to a message; for example, when a user ignores a message, it is ignored for all users.

The tool currently scans for dozens of issues, and dozens more are planned. Just keep an eye on your account over time - it will notify you if and when new issues or opportunities are detected.


- Frank Kieviet and Matt Matyas, Google Analytics Team

New Benchmarking Reports Help Twiddy Boost Email Open Rates by 500%

If you’ve ever wondered how your website is performing compared to the competition, our new Benchmarking reports in Google Analytics will help you find out.

Analytics users can now compare their results to peers in their industry, choosing from 1600 industry categories, 1250 markets and 7 size buckets. Benchmarking leverages the footprint of Google Analytics and can help you set meaningful targets, spot trends occurring across industries and answer a whole array of questions: Which channels should you be investing more in? How does your mobile engagement compare to your peers? How unique is your audience?

The new Benchmarking reports display acquisition and engagement metrics — like sessions and bounce rate — by Channel, Location, or Device Category dimensions. To ensure total data transparency, the number of properties contributing to the benchmark is displayed once you choose the industry, market and size. A helpful heat map feature makes it easy to see areas of strength and opportunity, and where to devote more resources.

Benchmarking in Action: Twiddy Finds a New Email Marketing Opportunity

Twiddy.com, a vacation rentals company in the Outer Banks-- a popular summer getaway destination-- has been using Benchmarking reports to help focus its marketing resources. A look at their peer benchmarks by channel showed that Twiddy was doing many things well during its peak summer booking season. Still, “it was clear we were missing a huge opportunity in email marketing,” reports CMO Ross Twiddy. His team used Google Analytics data to revamp their email marketing and improve the flow and process.

Email opportunity: Visitors from email spend nearly twice as long on site as the average, but user sessions generated from email are 82% below average and new users from the channel fall 91% below similar sites.

Twiddy even used Google Analytics to choose the best-selling messages for their email campaigns. Their analysis helped them zero in on the factors that were most consistent in repeat bookings: the price range, location, rental type, and even vacation week that would be most likely to convert with for each customer. "We launched an email last week based on our findings, and it shattered our email marketing records: a 48% average open rate and a 40% clickthrough rate,” says Ross.

Twiddy is happy with the new visibility they’ve gained: “The Benchmarking reports were powerful enough for us to reallocate time, budget and resources towards running down the deficiency. We can’t wait to start testing the reports out more broadly during the next peak booking season.”

Get Started with Benchmarking

Benchmarking reports can be found in the “Audience” section of the reporting interface and are rolling out over the next few weeks to all Google Analytics users who have opted in to share their data anonymously. If you want to join in, simply check the “Share anonymously with Google and others” box in the Account Settings tab of your account admin page. This is only the beginning for benchmarking within Google Analytics. We’ll be expanding these capabilities in the coming months, both incorporating conversion metrics and adding support for mobile apps. For more information on Benchmarking reports, check out our Help Center.

Posted by: Nikhil Roy, Product Manager, Google Analytics

Avvo Gains New Insights with Data Import

Companies use many systems to run their business. These may include multiple web advertising networks, CRM and content publishing systems, point of sale systems, inventory databases, etc. Integrating the data from these systems with Google Analytics provides a better understanding for how your customers behave on the web. 

At the 2014 Analytics Summit we announced the new Data Import. Data Import helps unify data from your different business systems, allowing you to organize your data the same way your business is organized. This will allow for more accurate analysis and bringing together previously disparate datasets into one complete picture. Using Data Import, you can upload your brand’s existing data into Google Analytics and join it with GA data for reporting, segmentation and remarketing.

By using the Data Import functionality in Google Analytics Premium, consumer legal services brand Avvo created clear, accurate data, which continues to impact decisions across their organization. While Avvo already had a successful and fast-growing business, the lack of visibility into advertising success made it hard to align key revenue opportunities with actual site usage. Read the full case study here.


“We’ve been very pleased with the results that were realized using Data Import in Google Analytics to analyze client behavior on our website. This exercise has given us better insight into valuable data that will ultimately impact how we segment the market for legal services.” 
- Sendi Widjaja, Co-Founder & CTO, Avvo, Inc.

Data Import also now supports a new Query Time mode that allows you to join your data with historical GA data. With this mode you can:
  • Enhance existing, already processed GA data with imported dimensions and metrics.
  • Upload calculated values after a transaction occurs, like total customer spend, last transaction date, or a loyalty score.
  • Correct any errors in data you have uploaded to GA in the past.
Query Time mode is currently in whitelist release for Premium users. For more information, contact your Premium account manager. You can learn more about Premium here.

Illustration of a new Google Analytics report with data from multiple sources 

We are also introducing a new version of Cost Data import that provides more versatile support for importing historical data. Additionally, cost data  can now be uploaded directly  through the Google Analytics web interface (previously, data import  required using the GA API). Note: Users of the original cost data import  must migrate to the new version. Details can be found in the cost data migration guide.

How to get started using Data Import
For more information, read Data Import on the Google Analytics Help Center. Also check our new developer Data Import guides that will get you up and running in no time. Some features are currently not rolled out to all users. If you’d like to join the beta for full-access, sign-up here.

Posted by Nick Mihailovski, Jieyan Fan, Richard Maher, Rick Elliott and the Google Analytics Team 

Segmenting Brand and Generic Paid Search Traffic in Google Analytics

Many advertisers with paid search campaigns advertise on queries mentioning their brand (e.g., “Motorola smartphone” for Motorola) and also on generic searches (e.g., “smartphone reviews”). Because the performance metrics for ads shown against brand and generic queries can be vastly different, many advertisers prefer to analyze these two groups separately.  For example, all else being equal, searches containing the advertiser’s brand name often have higher clickthrough-rates than those that don’t.

Automatic classification


To make analysis of brand and generic performance as easy as possible, we’re introducing a new feature which automatically identifies brand-aware paid search clicks tracked in Google Analytics. We use a combination of signals (including the clickthrough-rate, text string, domain name and others) to identify query terms which show awareness of your brand.  You can review our suggested brand terms and then accept or decline each of them. It’s also easy to add additional brand terms that we’ve missed. 

With the resulting list of brand terms, we classify your paid search traffic in GA so that you can split your “paid search” channel into two separate channels: “brand paid search” and “generic paid search”. This can be done both for Multi-Channel Funnels (for attribution purposes) and for the main Google Analytics channel grouping. See this straightforward step-by-step guide to get started.

Industry feedback

Back in 2012, George Michie from the Rimm-Kaufmann Group, a leading online marketing agency, called analyzing brand and generic paid search together “the cardinal sin of paid search”. We showed him a preview of our new solution and here’s his reaction:

"I've been arguing for many years that advertisers should look at their brand and generic paid search separately. There are massive differences in overall performance - but also in more specific areas, like attribution and new customer acquisition. 

Google Analytics now makes it a lot easier for advertisers to segment brand and generic paid search into separate channels. I'm sure this feature will help many more advertisers measure these important differences - and more importantly, take action on these new insights."

Getting started

Finally: note that this feature works for all paid search advertising, not just Google AdWords. It will roll out to all users in the coming weeks.

To get started, use the step-by-step guide to set up separate brand paid search and generic paid search channels. We’ve already suggested brand terms for every GA view with sufficient paid search traffic.

Posted by: Frank Uyeda, Software Engineer, Google Analytics

Better data, better decisions: Enhanced Ecommerce boosts shopping analytics

Earlier this week, we announced the beta launch of Enhanced Ecommerce for Google Analytics. It's a complete revamp of our ecommerce analytics, designed to provide richer insights into pre-purchase shopping behavior and into product performance.

“With Enhanced Ecommerce our clients can immediately gain clear insight into the most important metrics about shopper behavior and conversion: what products are viewed, where they are viewed, when they are added to carts, how the checkout process works and where customers get lost, and even details like payment methods.”
- Caleb Whitmore, CEO of Analytics Pros

Enhanced Ecommerce is designed to keep pace with the remarkable rise of online retail, which grew another 30% year over year in 2013. Digital data has played an essential role in that growth, offering deep insights into shopper behavior and letting retailers make smarter decisions. But needs are rapidly increasing and retailers are requiring more sophisticated and comprehensive analysis tools to understand shoppers and product-level performance. With the launch of Enhanced Ecommerce, we’re providing these tools.

“Enhanced Ecommerce will help us to overcome many challenges. As an example, I'm looking at a report that indicates a 74.4% checkout abandonment rate.  That insight is shockingly simple: over 7 out of 10 people that add something to the cart and start to checkout don't complete it! This is the kind of data that can drive change more readily than, say, simple conversion rates for e-commerce orders.”
 - Caleb Whitmore, CEO of Analytics Pros

Enhanced Ecommerce is built on top of the powerful Universal Analytics foundation. It includes tracking code updates (including full support for Google Tag Manager), data model changes, and new end-user reports that address ecommerce-specific use cases. Together they help online retailers see farther and understand customers better than ever before. 

Get deeper insights
  • Analyze how far shoppers get in the shopping funnel and where they drop off. 
  • Understand which products are viewed most, which are frequently abandoned in cart and which ones convert well. 
  • Upload rich product metadata to slice and dice your data.
  • Create rich user segments to delve deeper into your users’ shopping behavior and the products they interact with.

Optimize your site 
  • Create product lists for onsite merchandising rules and product landing pages to see which lists and products are best at driving customer engagement.
  • Analyze how internal promotions impact sales, and act immediately on the results.
  • With retailers reporting average on-site conversion rates of around 2.7%, even small improvements can have a big impact.
Close the loop
  • With refund support, Google Analytics now covers the entire shopping lifecycle.
  • Import user segments, based on ecommerce activity, for targeting in your remarketing campaigns.
In the chart below, see an example of how the new reports can benefit your business. You can create segments directly from the funnel reports to analyze abandoned cart sessions. See which products were abandoned and which devices to target to recapture those users. This data allows you to take immediate action. 
Shopping behavior funnel report. Use the table to analyze by any session level dimension
Enhanced Ecommerce is all about the bottom line. We've designed it to help you improve your total experience and turn more shoppers into buyers.

Learn more
Sign up today for the new Analytics Academy course on Enhanced Ecommerce! Or come learn more at Internet Retailer Conference Exhibition on June 12; Google’s Jesse Nichols will present Enhanced Ecommerce live. 

You can find more information on getting started with Enhanced Ecommerce in our Help Center and Developer site.  

Happy Analyzing!


Post by: Marcia Jung, Product Manager, Google Analytics

Google Analytics Summit 2014: What’s Next And On The Horizon For Analytics


As they have for years, Google Analytics Certified Partners, Premium customers and developers will once again join us in the Bay Area for our annual summit this week. We are constantly working to improve our products based on feedback from our most dedicated users and this event lets us hear directly from our community. We wanted to share an overview of some of the tools and features we’ll discuss at the 2014 summit so that even if you aren’t able to attend, you can about hear what’s next. 

Enhanced Ecommerce

Google Analytics Ecommerce data traditionally focused on details about the purchase - transaction details, product details, and others. But, marketers today want to understand the entire customer journey. They want more details about customer behavior when looking at products, interacting with merchandising units and on-site marketing. Today we’re announcing the beta for Enhanced Ecommerce - a complete revamp of how Google Analytics measures the Ecommerce experience. 

Businesses can now gain clear insight into new important metrics about shopper behavior and conversion including: product detail views, ‘add to cart’ actions, internal campaign clicks, the success of internal merchandising tools, the checkout process, and purchase. Merchants will be able to understand how far along users get in the buying process and where they are dropping off. For a complete overview of new features, have a look at our Help Center.


For marketers and Ecommerce managers looking to hone their analytic skills, we are also announcing a new Analytics Academy course titled Ecommerce Analytics: From Data to Decisions. Students will be guided through interactive examples of analyses for a fictional retail company to practice techniques they can apply to their own business. You can sign-up to be notified when this course opens on the Analytics Academy site.

Flexible and Scalable Reporting  

Today’s marketers and analysts are looking to multiple data sets to gain deeper insights. We’re working on a number of new features to make it simple for businesses to work with different types of data in Google Analytics.  
  • We unveiled Unified Channel Groupings to ensure all traffic that comes to the your site are classified in-line with your unique channel definitions. This is especially valuable for attribution, so marketers can interpret and report on the consumer journey based on their unique view of acquisition channels. 
  • We’ve expanded the functionality of Google Analytics Dimension Widening, now called ‘Data Import’, to enable customers to import more of their own data into Google Analytics. This could include specific product details, information about returned products, insights about your customers’ preferences, and more. Imported data can be used with almost all of the standard Google Analytics features. For a complete list of the types of data you can import please see our article in the help center (linked above).
  • For Google Analytics Premium users, we’re introducing Custom Tables. This powerful feature enables users to retrieve unsampled data using customized tables that best fit their business’ needs. Once configured, fresh data will be available daily for unsampled analysis and segmentation. 
Enterprise-Class Features

Today, smart marketers are increasingly tying measurement to media execution. We’re excited to announce a seamless integration between Google Analytics Premium, DoubleClick Campaign Manager and DoubleClick Bid Manager. Google Analytics Premium is uniquely positioned to help today’s advertiser understand how customers, and potential customers, interact with advertising media trafficked on the DoubleClick platform. In addition to understanding impression level data, advertisers can now send remarketing lists from Google Analytics to DoubleClick Bid Manager.

We added Google Analytics Premium and DoubleClick Bid Manager integration this year in order to further optimize our strongest lead generating campaigns. 70% of our display leads come from our retargeting campaigns, and the Google Analytics Premium and DoubleClick Bid Manager integration allows us to move beyond optimizing by site and creative, to quickly personalizing creatives - optimizing using our knowledge of distinct visitor segments not just generic visits.  
-Melissa Shusterman, Strategic Engagement Director, MaassMedia

Additionally, for enterprise customers, service providers, or developers that manage many accounts we are offering 4 new APIs to help you save you time and increase productivity: the new Provisioning API to create new GA accounts (invite only), the AdWords and Filters API to manage configurations, and the Embed API to surface key reports and dashboards. We’ve also re-launched the App Gallery as the Partner Gallery, the new destination to find services by Google Analytics Certified Partners and apps by Google Analytics Technology Partners. The new gallery will rollout to all users over the coming week.

Stay tuned in the next several days for deep-dives about our various new tools and features. You can also sign-up for the whitelist of several of the features listed above here. Thank you to our partners, developers, and customers for all the great feedback over the year. We hope to continue developing and launches capabilities that matters to you most.  

Posted by the Google Analytics team