Tag Archives: Features

Google Analytics Premium launches executive-level business reporting

“Prior to using roll-up reporting we had no way to see all of our sites in a single Google Analytics view. Now we can easily compare our nine sites and react to trends in real time. This means that a product manager with a hunch about a new traffic pattern can quickly prove/disprove a theory without wasting hours of time pulling numbers for every site.”   - Jesse Knight, VICE Media Group

Google Analytics already helps you gather deep insights into one website or app at a time. But what if you want to understand the overall performance and interactions of all your company’s digital properties? In today’s multi-touchpoint consumer world, this is a much greater priority. 

Today we’re launching Roll-Up Reporting in Google Analytics Premium to help address this need. Roll-Up Reporting is a single interface that moves your aggregate business data much closer to your high-level business decisions.

The Executive Dashboard

One spot with aggregate data for all your sites and apps? Check. Key summaries with no compromises on data accuracy and segmentation? Check. Everything available in real time? Check. With Roll-Up Reporting, there's no need to export from dozens of properties and collate data offline. It's all built in.

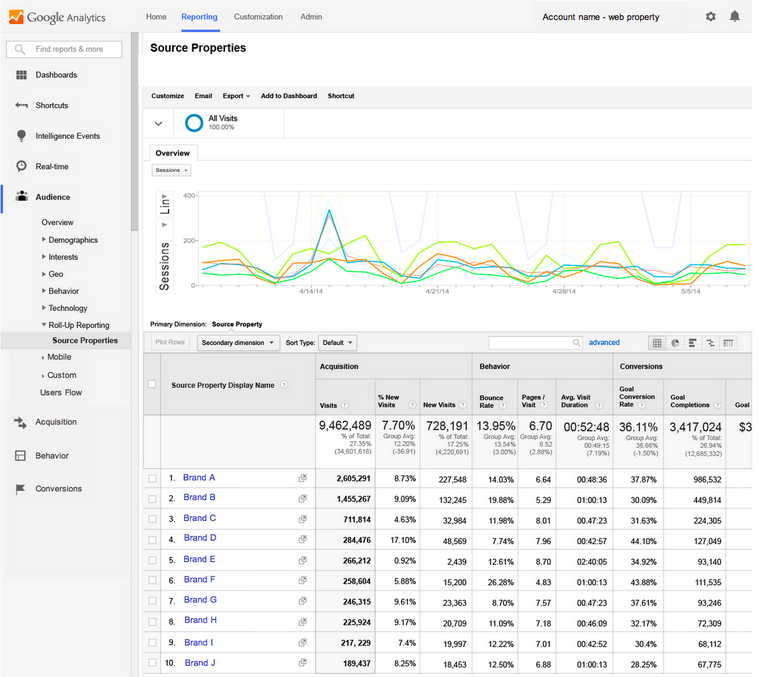
Spot Overperforming Business Units

Suppose you want to compare the performance of the sites and apps for your company’s various brands, franchises or regional subsidiaries. The new Source Properties Report has you covered, with at-a-glance views of business units that are outperforming or underperforming. To compare specific segments, try using the new Source Property Display Name dimension in advanced segments, in custom reports, or as a secondary dimension. 


A Single View of Your Customer Journey

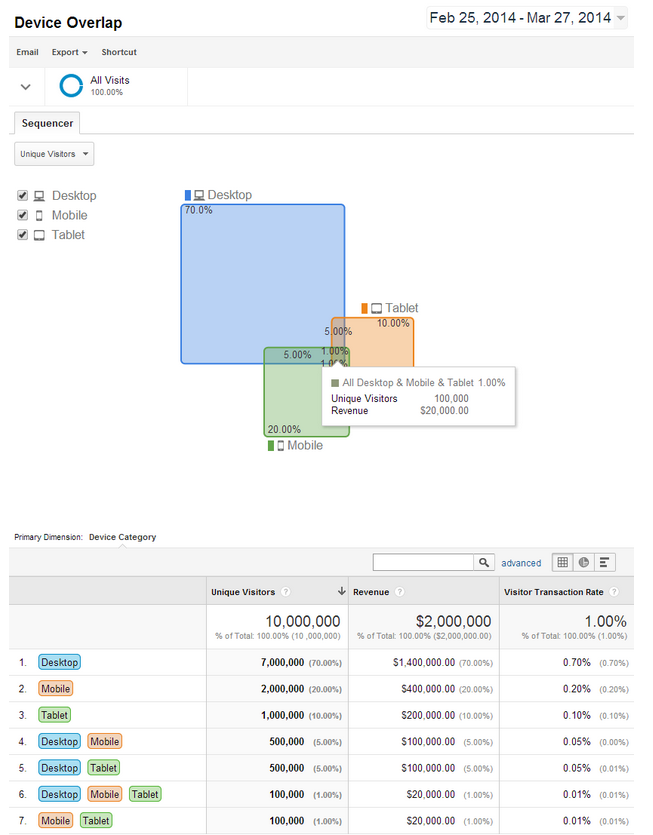
In many cases, Roll-Up Reporting can de-duplicate unique visitors across your websites and apps, so you can see the total unique-visitor reach of all your digital properties. You can also use segments to study the overlap and pathing of visitors who traverse several of your sites and apps. If your business owns multiple brands or franchises that target similar consumer populations, or if you expect the same consumer to interact with multiple marketing or landing sites over time, be sure to try this out. 

This is also a great way to tie together platform and device touchpoints. Google Analytics already provides powerful features, like cross device reports and single-view app and web data, to help you report on multiple types together. With Roll-Up Reporting, you’re no longer restricted to reporting on those tied to the same Google Analytics Property. That means more agile setups and more powerful analysis.


Fast Setup:
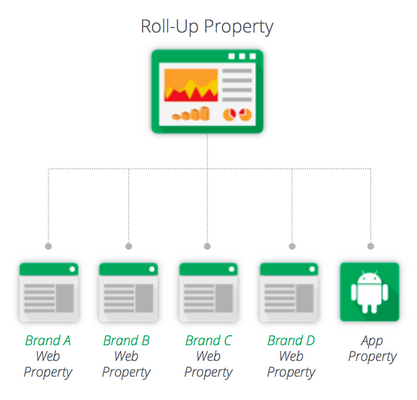
Roll-Up Reporting is made possible by Roll-Up Properties, a special type of Google Analytics property whose hit data comes exclusively from other Analytics properties. Setting up a Roll-Up Property is straightforward: no tagging changes needed. Simply select the Google Analytics properties that need to be reported on together, and Google Analytics will configure each selected property, called a Source Property, to forward a modified copy of all future hits it receives to the Roll-Up Property. 

To get started with Roll-Up Reporting, contact your Google Analytics Premium Account Manager to request your new Roll-Up Properties. 

To learn even more about Google Analytics Premium, contact your Google Account Manager or visit google.com/analytics/premium.

Posted by Yi Han, on behalf of the Google Analytics Premium team

Introducing Content Grouping in the Behavior Flow

Many of you have shared with us that it’s difficult to identify traffic patterns from Behavior Flows that include a large number of pages. That’s why we're pleased to announce that we’re adding support for Content Groupings in the Behavior Flow. 

Content Groupings let you group pages and content into a logical structure that reflects how you think about your site. The Behavior Flow view provides a graphical representation of how visitors flow through your site by traffic source (or any other dimension) so you can see their journeys, as well as where they dropped off. Now, you can select Content Groupings in the Behavior Flow to see how visitors flow through Content Groupings that you have defined.  This can help you answer questions like “Where do users who read my sports pages go next? Do they view more sports articles or do they switch to another section? Or, do they simply drop off?”


The more time you spend setting up your Content Groupings, the more information you will be able to discover from viewing them in the Behavior Flow. Watch the video to learn more about setting up Content Groupings.


Visit our Help Center to learn how to get started with Content Groupings, or read this article about using the Behavior Flow once you have set up your Content Groupings.

Happy Analyzing!

Posted by Matthew Anderson, Google Analytics Team

Sharing is Caring – Unleash your productivity with asset sharing in Google Analytics


Innovation happens on every level

Within your organization there are multiple people working on different sides of the same problem. Making it easy for people to quickly and effectively share innovative solutions is a key enabler for more productivity, and better decisions. 

We are proud to announce a series of asset sharing tools within Google Analytics. To spread all your innovative solutions and assets even easier. Our permalink solution is a simple to use and privacy friendly way to share Google Analytics configurations across your organization, and beyond.

Narrow the focus for precise insights

Our popular segments feature helps you to narrow the focus of your analysis. Are you trying to answer a hypotheses for new, or recurring customers? Is this report more meaningful if you focus on a particular region? By sharing a segment, you share a certain point of view on a problem. Invite others to your view by sharing a segment you built, or a custom report.

Define success, and spread the love

Goals in Google Analytics help advertisers to map real business value into a conversion signal. Track users site engagement, media interactions, or sales events through Goal tracking. Now it is easier than ever to share your success definition across other views, or with other people in your organization.

Capture everything with Custom Channels Groupings

It all starts with traffic to your website. You spend a tremendous amount of effort and resources on getting people to visit. Custom Channel Grouping within Multi-Channel Funnels enables you to identify everything, especially traffic that is custom to your business model. Sharing this important view is now easier than ever. Create a Custom Channel Grouping, and share this among your organization.

Assign partial value to your marketing efforts

Custom Attribution Models allow Google Analytics users to assign partial value to the channel interactions which drive business value. You invest time and effort to build a customized attribution model, which reflects the nuances of your business. Now it is easier than ever to ensure all stakeholders are working off the same consistent definition of attribution.

“Amazing feature! I tried it … and like it.”
Sebastian Pospischil Director Digital Analytics, United Digital Group

How it works

Permalink is a simple to use, and privacy friendly way to share configuration assets. When you ‘share’ an asset, we are creating a copy of that asset or configuration, and create a unique URL which points to that copy. The asset copy will remain private and can only be accessed by someone with the URL. If you want to share your asset, just share the URL. The recipient clicks on the URL, and will be brought to a simple dialog to import the assets into his or her Google Analytics views. This feature also supports Dashboard, and Custom Reports.

Check out our Solutions Gallery within your Google Analytics account via the “Import from Gallery” button or directly at the standalone site for inspiration, and consider sharing your own permalinks via the “Share in Solutions Gallery” link. 

Happy Analyzing.

Posted by Stefan Schnabl, on behalf of the Google Analytics team

Improving Your Data Quality: Google Analytics Diagnostics

Google Analytics is a powerful product with a wealth of features. Analytics data can fuel powerful actions like improving websites, streamlining mobile apps, and optimizing marketing investment. To realize this power, you must configure Analytics well and ensure high quality data. For these reasons, we’re starting a beta test with some of our users on Analytics Diagnostics that are aimed at finding data-quality issues, making you aware of them, and helping you fix them.

Analytics Diagnostics frequently scans for problems. It inspects your site tagging, account configuration, and reporting data for potential data-quality issues, looking for things like:
  • Missing or malformed Analytics tags 
  • Filters that conflict
  • Looking for the presence of (other) entries in reports
Here’s what it looks like:


As we get lots more feedback and improve the diagnostics system, we will release this to all of our users. It will take some time to get there; in the meantime, you are welcome to express interest in trying out the diagnostics system on your own GA accounts.

Posted by the Google Analytics Team

Smarter remarketing with Google Analytics


Sometimes, less is more.
While many marketers love the hundreds of dimensions they can use to create remarketing lists in Google Analytics, others have told us that the sheer number of possibilities can be overwhelming.

So to simplify the product while still ensuring great results for our users, we’re proud to announce a new type of remarketing list: one that’s managed automatically.

Introducing: Smart Lists with Google Analytics.
Now when creating a new remarketing list, you’ll have the option to have Analytics manage your list for you.

Smart List option in the Remarketing Interface

How does it work?
Smart Lists are built using machine learning across the millions of Google Analytics websites which have opted in to share anonymized conversion data, using dozens of signals like visit duration, page depth, location, device, referrer, and browser to predict which of your users are most likely to convert during a later visit.

Based on their on-site actions, Analytics is able to calibrate your remarketing campaigns to align with each user’s value.

If you use use eCommerce transaction tracking and have enough traffic and conversions, your Smart List will be automatically upgraded. Marked as [My Smart List], your list will be customized based on the unique characteristics that cause your visitors to convert. Only you will have access to this list, and no new data will be shared whether you use this feature or not (learn more).

For practitioners, the promise of big data is also the burden - there are so many analyses to run, so much opportunity.  With Smart Lists, as with Data Driven Attribution, Google Analytics is  operationalizing statistical analysis - making us not just smarter marketers - but faster and more nimble. 

While we might have been able to achieve similar results with ongoing statistical analysis and a complex cookie structure, Smart Lists are simply plug and play. This speeds us along, so we can focus not on list management, but on growing the business. 
-- Melissa Shusterman, Engagement Director, www.maassmedia.com

For best results, make sure your Google Analytics goals and transactions are being imported into AdWords, then combine your Smart List with Conversion Optimizer using Target CPA or ROAS in AdWords.

If you’re new to remarketing, the Smart List is a great way to get started with strong performance results.  As you get comfortable with remarketing you can tailor your creatives and apply a variety of remarketing best practices.

If you’re a remarketer already employing a sophisticated list strategy, stay tuned while we gear up to extend this signal directly for your current lists as an optimization signal used in AdWords bidding.

We’ll be continuing to iterate on these models in order to help users better understand and act on their data. We’re also working on surfacing these signals elsewhere in your reports and in the product so you can dive into what factors help predict whether a user will likely convert.

We welcome your feedback and ideas. Please leave them right in the comments!

Happy Analyzing,
Ismail Sebe and Dan Stone
on behalf of the Google Analytics Team

Analytics & AdWords Bulk Account Linking

To maximize marketing investment and return, advertisers need insights into the effectiveness of their ads. However, gaining such insights is often overly cumbersome. This is why we’re pleased to announce that in the coming weeks, the Google Analytics and AdWords account linking process is becoming even more streamlined, making it easier for advertisers to quickly gain rich insights. The new linking process allows you to link multiple AdWords accounts all at once. This enables more tightly controlled linking access for each Google Analytics property. 

Enable Bulk AdWords Account Linking
Many Google Analytics users have multiple AdWords accounts. Until now, each AdWords account had to be individually linked. The new account linking wizard allows you to select any of the AdWords accounts in which you have Administrative access. The following screenshot shows what the wizard looks like for a user who has access to an AdWords MCC containing many AdWords accounts. Note that you can select multiple accounts:

Discover Unlinked Accounts
Many users want to quickly find unlinked AdWords accounts and link to them, and the new wizard makes this easy. A quick glance at the AdWords account list in the screenshot above shows which accounts are and aren’t linked. To link additional accounts, just mark the “X” in front of each account, and then continue.


Gain More Granular Control
With this launch, linking to AdWords now takes place at the Analytics property level instead of the account level. This is a benefit for those with many properties in a single Analytics account; if you have different teams of people managing each property, you no longer need to give them access to the full Analytics account in order to link to AdWords. Now, you can simply give that team access to only the appropriate property, and they can manage AdWords links. All it takes is property-level Edit permission to create and update AdWords links. This is another Analytics feature enabling large-scale Analytics customers to better control access to their Analytics accounts.

Visit The New AdWords Linking Section
Once the new linking process has launched to your account, you’ll be able to see all these features. Log in to your Analytics account, click the Admin button in the header, and you’ll see a new AdWords Linking section in the Property column:


These great new features are rolling out now and should fully launch to everyone in the coming weeks. Here’s what one of our users had to say:

"The linking process is now a lot more straightforward as I do not need to toggle between 2 different interfaces. Everything can be done in GA. In addition, all of the accounts that I manage are automatically listed in the interface so I do not need to look for them. This is a vast improvement from the previous experience." Sam Chew, Digital Manager, Air Asia

Log into your Analytics account soon to update your AdWords account links and gain rich marketing insights.

Posted by Dan Fielder and Matt Matyas, Google Analytics Team

Universal Analytics: Out of beta, into primetime

Universal Analytics is the re-imagining of Google Analytics for today’s multi-screen, multi-device world and all the measurement challenges that come with it. Since we launched UA in beta, we’ve seen some exciting use cases. Today we’re happy to finally announce: Universal Analytics is out of beta and everyone can use it with the same robust set of features you’re used to with classic Analytics!


Feature parity with Classic Analytics, new reports, better user-centric analysis
When we first introduced Universal Analytics and ran the beta trial, the number one request from our testers was for full access to all Google Analytics features and tools. Bringing Universal Analytics out of beta means that all the features, reports, and tools of Classic Analytics are now available in the product, including Remarketing and Audience reporting.

We’re also gradually rolling out the User ID feature to help you better understand your customers’ full journey. This feature shows anonymous engagement activity across different screens and visits to your site to provide a more user-centric view of your traffic, and help you build a more tailored experience for your customers as well. It will also enable new Cross Device reporting that shows how your users are interacting with your business across multiple devices. 

Additionally, Universal Analytics is also now covered by our Premium service-level agreement, which means that same level of service and additional product features Premium users have come to expect will stay the same when their accounts upgrade to Universal Analytics.

New Cross-Device Reports in GA let you see the full customer journey (click image for full-size).

Time Zone Based Processing: Fresher, more timely data
Today, all properties are processed in Pacific Standard Time. If you’re in a different time zone, this can create a lag in the data you see in your reports. With time zone based processing, you’ll see fresher data in your reports in a more timely manner.

Updates to the Measurement Protocol: User Agent / IP Override 
A top developer request, this feature allows developers to proxy data from devices and intranets, through internal servers, and finally onto Google Analytics. To support this, we added two fields to set the IP address and User Agent directly in the Measurement Protocol. With these features, we are also announcing the deprecation of the legacy mobile snippets. Users should update their code to use the Measurement Protocol

Our early Universal Analytics adopters have already seen some great results. This case study highlights some of the inspired ways our Certified Partner InfoTrust LLC has helped Beckfield College unlock the full capabilities of Universal Analytics including the use of Remarketing and Audience Reporting:

"Once we saw more than 25% of visits to Beckfield College's website were coming from a mobile device, we migrated them to Universal Analytics with plans on leveraging its cross-device tracking capabilities, and better understanding the full visitor journey across devices." -- James Love, InfoTrust LLC

If you use Google Analytics today, get started with Universal Analytics by upgrading your account. Learn more about the process in the Universal Analytics Upgrade Center, including auto-upgrade process, and timeline. 

If you are new to Google Analytics, learn more about Universal Analytics in the Help Center. 

We’ll share more creative implementations, case studies, and Universal Analytics resources in the coming months that we hope will inspire you to continue to grow your business with the insights you gain using Google Analytics. 

Posted by Nick Mihailovski, Product Manager, Google Analytics

Understand the full value of TrueView ads with the new Video Campaigns report

Advertisers know that video ads have the ability to reach and convince customers in ways that other formats can’t, but traditional TV ads are often prohibitively expensive, difficult to target, and hard to measure. That’s why so many advertisers have looked to YouTube TrueView ads for their video needs.  With more than 1 billion unique users each month from across the world and with 40% of that traffic on mobile, YouTube is one of the best places to reach your target audience with high-quality, compelling video.

We’ve heard lots of feedback from loyal Google Analytics users asking for better TrueView reporting, which is why we’re so excited to announce a new Google Analytics Video Campaigns report that focuses on your TrueView ads. With this new report rolling out over the next few days, users can now see the detailed effects of their TrueView campaigns on their website traffic and revenue. You can access the new report under Acquisition > AdWords > Video Campaigns.

Click for full-size image

If you’ve never created a TrueView ad, it’s easy to do with AdWords for Video. Just head into AdWords, and under the +Campaign button, select Online Video.  


Once you’ve created an auto-tagged TrueView ad in AdWords and linked your Google Analytics and AdWords accounts, your TrueView-ad-driven traffic will show up in the Video Campaigns report after about 24 hours. This report has the familiar look and feel of the other AdWords reports but includes TrueView-specific metrics like Paid Views, Cost Per View, and Website Clicks. There are also new metric groups like Engagement, which helps you understand how users engage with your video and your website.  

Using this newly available data, you can fine-tune your TrueView campaign settings to optimize for views, clicks, or goal conversions. You can also segment the reports by Ad Content or Video, helping you analyze the quality of your video creatives in the context of your website goals. 

In addition, since TrueView ads are often more brand-focused, traffic they generate to your site will often be indirect traffic.  In order to analyze this type of traffic, check out the new Google Display Network Impression Reporting pilot, which can help you understand conversions that resulted from unclicked impressions or video views.  With this report, it’s possible to see how your TrueView ads are generating value beyond just direct clicks; you can dive deeper to understand how impressions, views, and clicks all contributed directly or indirectly to conversions on your site.

Click for full-size image

To get started with Video Campaigns reporting, simply link your AdWords and Google Analytics accounts and start an auto-tagged TrueView campaign via AdWords for video. After that, head over to the new report to fine-tune your budgets and targeting.  See you on YouTube!

Posted by Jon Mesh, Google Analytics Product Manager

Tailored ads, better results: Dynamic Remarketing powered by Google Analytics

Back in August, 2012, we launched Remarketing with Google Analytics, which enabled advertisers to create sophisticated remarketing lists using Google Analytics’ 250+ dimensions and metrics. 
Today, we’re excited to announce a deeper remarketing integration between AdWords and Google Analytics. 

A single set of tags can now power both Google Analytics and Dynamic Remarketing on the Google Display Network using the Google Merchant Center. Retailers (with other verticals in beta) will gain power and precision for their remarketing along with access to detailed product level reporting through this integration.


What is Dynamic Remarketing?
[original article here]

Every customer is unique. Dynamic remarketing takes this into account, letting you create and deliver beautiful customized ads that connect visitors with their past shopping experiences on your site. If you’re a retailer with a Google Merchant Center account, you can use dynamic remarketing to construct remarketing ads on the fly with the products and messages that are predicted to perform best based on visitors’ past actions on your site.
For example: Customers who browsed the winter tires category on an advertiser’s website might see an ad that includes the exact products they’ve already viewed, in addition to related products from the company’s catalog. In the Tirendo example above, the ad also shows details of recently viewed tires, including the prices.
Early users are seeing great results

"We've been thrilled with the performance of Dynamic Remarketing with Google Analytics and Conversion Optimizer, which has so far driven a 203% increase in conversions and 100% increase in conversion rates vs. our display average. Combined with Google Analytics' powerful reporting on these same metrics, we've been able to derive actionable insights which we've put to good use throughout our other campaigns."
- Janina Rix, SEA Manager, tirendo.de

To begin using Dynamic Remarketing

  1. Create one or more remarketing lists using Google Analytics
  2. Update your tags to track Product ID, Cart Value, and Page Type as custom variables (or dimensions)
  3. Enable the Dynamic Link in Admin > Property > Dynamic Attributes. This will let Google Analytics send attributes to your AdWords account. [more below]
  4. Create a Dynamic Remarketing Display campaign in AdWords

    Here’s a quick visual guide to the new interface.

    Step 1: Configure account details


    Step 2: Make sure the attribute names match your custom variables


    Step 3: Click ‘Save’ and finish by creating your first Dynamic Remarketing campaign in AdWords


    Want more help? Download a remarketing starter pack from the solutions gallery. 

    Please stay tuned for more remarketing-related updates in the near future!

    Happy Analyzing, Dan Stone and Lan Huang on behalf of the Google Analytics Team

    8 Custom Reports from the Google Analytics Solutions Gallery

    The following is a guest post from Rachelle Maisner, who recently transitioned from Sr Analyst to Account Manager at Digitaria, a Google Analytics Certified Partner.
    New analysts have it easy these days. Back in my day, we have to walk uphill in the snow both ways to get decent enough web reporting. My first blush with web analytics came upon me when I was a marketing coordinator for an advertising agency several years ago. I got the hand-me-down grunt work of pulling stats for one of our client's websites using server logs. Server logs, people. It was painfully slow, and gut-wrenchingly inefficient. So for the sake of my sanity, I started looking into better solutions, and I knew if it could help the client out with more meaningful reporting, that would make me look really good. When I found a solution I liked, I needed to pitch the client for their buy in. That conversation went something like... "I found this great tool, and it's free- we can install it on your website and try out this fast new reporting. It's called Google Analytics."
    Since then, there are now so many fantastic resources available to budding young analysts. From the Analysis Exchange to Avinash's own Market Motive courses, not to mention GA's recently revamped Analytics Academy, there's a wealth of quality education and training just a click away to anyone who’s willing to learn. 
    I'm blogging to tell you all about one of my absolute favorite new resources-- a tremendous goldmine of knowledge sharing unlike anything else this industry has ever seen-- Google Analytics’ very own Solutions Gallery.
    The Solutions Gallery is a free and public platform that allows users to share custom reports, segments and dashboards. It's invaluable resource not only for those that are new to digital analytics, but also for analytics veterans looking for fresh ideas and new approaches. I mean, wow, you can download reports and dashboards from experts all over the globe and instantly apply them to your own Google Analytics account. 

    I was so excited about the Solutions Gallery that I uploaded 8 custom reports of my own to share with the community, and in about a month I had over 1,600+ imports. 
    I have received awesome feedback and gratitude for the custom reports I created, so I am absolutely thrilled to be able to share them here on the Google Analytics blog and showcase them to a wider audience. I hope you find these helpful and I hope they encourage you to not only get more from your data, but to upload some of your own solutions to the Gallery.
    All my custom reports are organized into four categories. These categories are based on the ABC's of analytics, plus D for bonus points: Acquisition, Behavior, Conversion, and Diagnostics.
    A is for Acquisition
    Visits and Goal Conversion by Traffic Source: Take your traffic source reports one step further by understanding volume & conversion by each channel. This is one way to see how your best visitors are getting to your site. I recommend setting up a goal for “engaged visits”, for this custom report and some of the following reports. When you import this custom report, change Goal One to your engaged visits goal, or another significant KPI configured as a goal.
    B is for Behavior
    Page Effectiveness: Ever ponder the question, “How is my content doing?” This custom report provides page-level performance, allowing you to discover your top and bottom performing pages using various traffic and engagement metrics.
    Social Sharing: A four-tab custom report chock full of site-to-social reporting. Tab 1 is the Shared Content Trend, showing how top pages are shared to social networks over time. Tab 2 is Top Shared Content by Network, a first step to discovering what content works for specific channels. Tab 3 is a report on Socially Engaged Visitors, providing a quick profile of visitors that engage in social sharing links. And finally, Tab 4 is Social Outcomes and Conversions, tying social engagement to site goals.
    C is for Conversion
    Simple E-Commerce Report: A starting point for trending revenue or purchases against visits, with a traffic sources breakdown.
    PPC Campaign Goal Performance: Analyze paid search performance against goal conversion by search engine. Change goal one completions to your engaged visits goal. This report filters for Google campaigns. To filter for Bing change the source filter for "Bing" or delete the filter to include all search engines.
    PPC Keywords: Get a paid keyword report with traffic volume, CPC, goal conversions, and cost per conversion.
    D is for Diagnostics
    Page Timing: Use this custom report to QA page load timing and reveal problem pages. Switch from the "data" table view to the "comparison" table view, and compare load time to bounce rate, allowing you to view the bounce rate for each page against the site average.
    Internal and External 404 Report: A custom report to help resolve 404 errors. Includes two report tabs. Tab 1: bad inbound links, and Tab 2: bad internal links. Be sure to change the filter for "page title" to the page title used on your site's 404 page.
    Posted by Rachelle Maisner, Account Manager at Digitaria, a Google Analytics Certified Partner