Tag Archives: climate

Generative AI to quantify uncertainty in weather forecasting

Accurate weather forecasts can have a direct impact on people’s lives, from helping make routine decisions, like what to pack for a day’s activities, to informing urgent actions, for example, protecting people in the face of hazardous weather conditions. The importance of accurate and timely weather forecasts will only increase as the climate changes. Recognizing this, we at Google have been investing in weather and climate research to help ensure that the forecasting technology of tomorrow can meet the demand for reliable weather information. Some of our recent innovations include MetNet-3, Google's high-resolution forecasts up to 24-hours into the future, and GraphCast, a weather model that can predict weather up to 10 days ahead.

Weather is inherently stochastic. To quantify the uncertainty, traditional methods rely on physics-based simulation to generate an ensemble of forecasts. However, it is computationally costly to generate a large ensemble so that rare and extreme weather events can be discerned and characterized accurately.

With that in mind, we are excited to announce our latest innovation designed to accelerate progress in weather forecasting, Scalable Ensemble Envelope Diffusion Sampler (SEEDS), recently published in Science Advances. SEEDS is a generative AI model that can efficiently generate ensembles of weather forecasts at scale at a small fraction of the cost of traditional physics-based forecasting models. This technology opens up novel opportunities for weather and climate science, and it represents one of the first applications to weather and climate forecasting of probabilistic diffusion models, a generative AI technology behind recent advances in media generation.


The need for probabilistic forecasts: the butterfly effect

In December 1972, at the American Association for the Advancement of Science meeting in Washington, D.C., MIT meteorology professor Ed Lorenz gave a talk entitled, “Does the Flap of a Butterfly's Wings in Brazil Set Off a Tornado in Texas?” which contributed to the term “butterfly effect”. He was building on his earlier, landmark 1963 paper where he examined the feasibility of “very-long-range weather prediction” and described how errors in initial conditions grow exponentially when integrated in time with numerical weather prediction models. This exponential error growth, known as chaos, results in a deterministic predictability limit that restricts the use of individual forecasts in decision making, because they do not quantify the inherent uncertainty of weather conditions. This is particularly problematic when forecasting extreme weather events, such as hurricanes, heatwaves, or floods.

Recognizing the limitations of deterministic forecasts, weather agencies around the world issue probabilistic forecasts. Such forecasts are based on ensembles of deterministic forecasts, each of which is generated by including synthetic noise in the initial conditions and stochasticity in the physical processes. Leveraging the fast error growth rate in weather models, the forecasts in an ensemble are purposefully different: the initial uncertainties are tuned to generate runs that are as different as possible and the stochastic processes in the weather model introduce additional differences during the model run. The error growth is mitigated by averaging all the forecasts in the ensemble and the variability in the ensemble of forecasts quantifies the uncertainty of the weather conditions.

While effective, generating these probabilistic forecasts is computationally costly. They require running highly complex numerical weather models on massive supercomputers multiple times. Consequently, many operational weather forecasts can only afford to generate ~10–50 ensemble members for each forecast cycle. This is a problem for users concerned with the likelihood of rare but high-impact weather events, which typically require much larger ensembles to assess beyond a few days. For instance, one would need a 10,000-member ensemble to forecast the likelihood of events with 1% probability of occurrence with a relative error less than 10%. Quantifying the probability of such extreme events could be useful, for example, for emergency management preparation or for energy traders.


SEEDS: AI-enabled advances

In the aforementioned paper, we present the Scalable Ensemble Envelope Diffusion Sampler (SEEDS), a generative AI technology for weather forecast ensemble generation. SEEDS is based on denoising diffusion probabilistic models, a state-of-the-art generative AI method pioneered in part by Google Research.

SEEDS can generate a large ensemble conditioned on as few as one or two forecasts from an operational numerical weather prediction system. The generated ensembles not only yield plausible real-weather–like forecasts but also match or exceed physics-based ensembles in skill metrics such as the rank histogram, the root-mean-squared error (RMSE), and the continuous ranked probability score (CRPS). In particular, the generated ensembles assign more accurate likelihoods to the tail of the forecast distribution, such as ±2σ and ±3σ weather events. Most importantly, the computational cost of the model is negligible when compared to the hours of computational time needed by supercomputers to make a forecast. It has a throughput of 256 ensemble members (at 2° resolution) per 3 minutes on Google Cloud TPUv3-32 instances and can easily scale to higher throughput by deploying more accelerators.

SEEDS generates an order-of-magnitude more samples to in-fill distributions of weather patterns.

Generating plausible weather forecasts

Generative AI is known to generate very detailed images and videos. This property is especially useful for generating ensemble forecasts that are consistent with plausible weather patterns, which ultimately result in the most added value for downstream applications. As Lorenz points out, “The [weather forecast] maps which they produce should look like real weather maps." The figure below contrasts the forecasts from SEEDS to those from the operational U.S. weather prediction system (Global Ensemble Forecast System, GEFS) for a particular date during the 2022 European heat waves. We also compare the results to the forecasts from a Gaussian model that predicts the univariate mean and standard deviation of each atmospheric field at each location, a common and computationally efficient but less sophisticated data-driven approach. This Gaussian model is meant to characterize the output of pointwise post-processing, which ignores correlations and treats each grid point as an independent random variable. In contrast, a real weather map would have detailed correlational structures.

Because SEEDS directly models the joint distribution of the atmospheric state, it realistically captures both the spatial covariance and the correlation between mid-tropospheric geopotential and mean sea level pressure, both of which are closely related and are commonly used by weather forecasters for evaluation and verification of forecasts. Gradients in the mean sea level pressure are what drive winds at the surface, while gradients in mid-tropospheric geopotential create upper-level winds that move large-scale weather patterns.

The generated samples from SEEDS shown in the figure below (frames Ca–Ch) display a geopotential trough west of Portugal with spatial structure similar to that found in the operational U.S. forecasts or the reanalysis based on observations. Although the Gaussian model predicts the marginal univariate distributions adequately, it fails to capture cross-field or spatial correlations. This hinders the assessment of the effects that these anomalies may have on hot air intrusions from North Africa, which can exacerbate heat waves over Europe.

Stamp maps over Europe on 2022/07/14 at 0:00 UTC. The contours are for the mean sea level pressure (dashed lines mark isobars below 1010 hPa) while the heatmap depicts the geopotential height at the 500 hPa pressure level. (A) The ERA5 reanalysis, a proxy for real observations. (Ba-Bb) 2 members from the 7-day U.S. operational forecasts used as seeds to our model. (Ca-Ch) 8 samples drawn from SEEDS. (Da-Dh) 8 non-seeding members from the 7-day U.S. operational ensemble forecast. (Ea-Ed) 4 samples from a pointwise Gaussian model parameterized by the mean and variance of the entire U.S. operational ensemble.

Covering extreme events more accurately

Below we show the joint distributions of temperature at 2 meters and total column water vapor near Lisbon during the extreme heat event on 2022/07/14, at 1:00 local time. We used the 7-day forecasts issued on 2022/07/07. For each plot, we generate 16,384-member ensembles with SEEDS. The observed weather event from ERA5 is denoted by the star. The operational ensemble is also shown, with squares denoting the forecasts used to seed the generated ensembles, and triangles denoting the rest of ensemble members.

SEEDS provides better statistical coverage of the 2022/07/14 European extreme heat event, denoted by the brown star . Each plot shows the values of the total column-integrated water vapor (TCVW) vs. temperature over a grid point near Lisbon, Portugal from 16,384 samples generated by our models, shown as green dots, conditioned on 2 seeds (blue squares) taken from the 7-day U.S. operational ensemble forecasts (denoted by the sparser brown triangles). The valid forecast time is 1:00 local time. The solid contour levels correspond to iso-proportions of the kernel density of SEEDS, with the outermost one encircling 95% of the mass and 11.875% between each level.

According to the U.S. operational ensemble, the observed event was so unlikely seven days prior that none of its 31 members predicted near-surface temperatures as warm as those observed. Indeed, the event probability computed from a Gaussian kernel density estimate is lower than 1%, which means that ensembles with less than 100 members are unlikely to contain forecasts as extreme as this event. In contrast, the SEEDS ensembles are able to extrapolate from the two seeding forecasts, providing an envelope of possible weather states with much better statistical coverage of the event. This allows both quantifying the probability of the event taking place and sampling weather regimes under which it would occur. Specifically, our highly scalable generative approach enables the creation of very large ensembles that can characterize very rare events by providing samples of weather states exceeding a given threshold for any user-defined diagnostic.


Conclusion and future outlook

SEEDS leverages the power of generative AI to produce ensemble forecasts comparable to those from the operational U.S. forecast system, but at an accelerated pace. The results reported in this paper need only 2 seeding forecasts from the operational system, which generates 31 forecasts in its current version. This leads to a hybrid forecasting system where a few weather trajectories computed with a physics-based model are used to seed a diffusion model that can generate additional forecasts much more efficiently. This methodology provides an alternative to the current operational weather forecasting paradigm, where the computational resources saved by the statistical emulator could be allocated to increasing the resolution of the physics-based model or issuing forecasts more frequently.

We believe that SEEDS represents just one of the many ways that AI will accelerate progress in operational numerical weather prediction in coming years. We hope this demonstration of the utility of generative AI for weather forecast emulation and post-processing will spur its application in research areas such as climate risk assessment, where generating a large number of ensembles of climate projections is crucial to accurately quantifying the uncertainty about future climate.


Acknowledgements

All SEEDS authors, Lizao Li, Rob Carver, Ignacio Lopez-Gomez, Fei Sha and John Anderson, co-authored this blog post, with Carla Bromberg as Program Lead. We also thank Tom Small who designed the animation. Our colleagues at Google Research have provided invaluable advice to the SEEDS work. Among them, we thank Leonardo Zepeda-Núñez, Zhong Yi Wan, Stephan Rasp, Stephan Hoyer, and Tapio Schneider for their inputs and useful discussion. We thank Tyler Russell for additional technical program management, as well as Alex Merose for data coordination and support. We also thank Cenk Gazen, Shreya Agrawal, and Jason Hickey for discussions in the early stage of the SEEDS work.

Source: Google AI Blog


Looking back at wildfire research in 2023

Wildfires are becoming larger and affecting more and more communities around the world, often resulting in large-scale devastation. Just this year, communities have experienced catastrophic wildfires in Greece, Maui, and Canada to name a few. While the underlying causes leading to such an increase are complex — including changing climate patterns, forest management practices, land use development policies and many more — it is clear that the advancement of technologies can help to address the new challenges.

At Google Research, we’ve been investing in a number of climate adaptation efforts, including the application of machine learning (ML) to aid in wildfire prevention and provide information to people during these events. For example, to help map fire boundaries, our wildfire boundary tracker uses ML models and satellite imagery to map large fires in near real-time with updates every 15 minutes. To advance our various research efforts, we are partnering with wildfire experts and government agencies around the world.

Today we are excited to share more about our ongoing collaboration with the US Forest Service (USFS) to advance fire modeling tools and fire spread prediction algorithms. Starting from the newly developed USFS wildfire behavior model, we use ML to significantly reduce computation times, thus enabling the model to be employed in near real time. This new model is also capable of incorporating localized fuel characteristics, such as fuel type and distribution, in its predictions. Finally, we describe an early version of our new high-fidelity 3D fire spread model.


Current state of the art in wildfire modeling

Today’s most widely used state-of-the-art fire behavior models for fire operation and training are based on the Rothermel fire model developed at the US Forest Service Fire Lab, by Rothermel et al., in the 1970s. This model considers many key factors that affect fire spread, such as the influence of wind, the slope of the terrain, the moisture level, the fuel load (e.g., the density of the combustible materials in the forest), etc., and provided a good balance between computational feasibility and accuracy at the time. The Rothermel model has gained widespread use throughout the fire management community across the world.

Various operational tools that employ the Rothermel model, such as BEHAVE, FARSITE, FSPro, and FlamMap, have been developed and improved over the years. These tools and the underlying model are used mainly in three important ways: (1) for training firefighters and fire managers to develop their insights and intuitions on fire behavior, (2) for fire behavior analysts to predict the development of a fire during a fire operation and to generate guidance for situation awareness and resource allocation planning, and (3) for analyzing forest management options intended to mitigate fire hazards across large landscapes.  These models are the foundation of fire operation safety and efficiency today.

However, there are limitations on these state-of-the art models, mostly associated with the simplification of the underlying physical processes (which was necessary when these models were created). By simplifying the physics to produce steady state predictions, the required inputs for fuel sources and weather became practical but also more abstract compared to measurable quantities.  As a result, these models are typically “adjusted” and “tweaked” by experienced fire behavior analysts so they work more accurately in certain situations and to compensate for uncertainties and unknowable environmental characteristics. Yet these expert adjustments mean that many of the calculations are not repeatable.

To overcome these limitations, USFS researchers have been working on a new model to drastically improve the physical fidelity of fire behavior prediction. This effort represents the first major shift in fire modeling in the past 50 years. While the new model continues to improve in capturing fire behavior, the computational cost and inference time makes it impractical to be deployed in the field or for applications with near real-time requirements. In a realistic scenario, to make this model useful and practical in training and operations, a speed up of at least 1000x would be needed.


Machine learning acceleration

In partnership with the USFS, we have undertaken a program to apply ML to decrease computation times for complex fire models. Researchers knew that many complex inputs and features could be characterized using a deep neural network, and if successful, the trained model would lower the computational cost and latency of evaluating new scenarios. Deep learning is a branch of machine learning that uses neural networks with multiple hidden layers of nodes that do not directly correspond to actual observations. The model’s hidden layers allow a rich representation of extremely complex systems — an ideal technique for modeling wildfire spread.

We used the USFS physics-based, numerical prediction models to generate many simulations of wildfire behavior and then used these simulated examples to train the deep learning model on the inputs and features to best capture the system behavior accurately. We found that the deep learning model can perform at a much lower computational cost compared to the original and is able to address behaviors resulting from fine-scale processes. In some cases, computation time for capturing the fine-scale features described above and providing a fire spread estimate was 100,000 times faster than running the physics-based numerical models.

This project has continued to make great progress since the first report at presentation at ICFFR 2022 and the USFS Fire Lab's project page provides a glimpse into the ongoing work in this direction. Our team has expanded the dataset used for training by an order of magnitude, from 40M up to 550M training examples. Additionally, we have delivered a prototype ML model that our USFS Fire Lab partner is integrating into a training app that is currently being developed for release in 2024.

Google researchers visiting the USFS Fire Lab in Missoula, MT, stopping by Big Knife Fire Operation Command Center.

Fine-grained fuel representation

Besides training, another key use-case of the new model is for operational fire prediction. To fully leverage the advantages of the new model’s capability to capture the detailed fire behavior changes from small-scale differences in fuel structures, high resolution fuel mapping and representation are needed. To this end, we are currently working on the integration of high resolution satellite imagery and geo information into ML models to allow fuel specific mapping at-scale. Some of the preliminary results will be presented at the upcoming 10th International Fire Ecology and Management Congress in November 2023.


Future work

Beyond the collaboration on the new fire spread model, there are many important and challenging problems that can help fire management and safety. Many such problems require even more accurate fire models that fully consider 3D flow interactions and fluid dynamics, thermodynamics and combustion physics. Such detailed calculations usually require high-performance computers (HPCs) or supercomputers.

These models can be used for research and longer-term planning purposes to develop insights on extreme fire development scenarios, build ML classification models, or establish a meaningful “danger index” using the simulated results. These high-fidelity simulations can also be used to supplement physical experiments that are used in expanding the operational models mentioned above.

In this direction, Google research has also developed a high-fidelity large-scale 3D fire simulator that can be run on Google TPUs. In the near future, there is a plan to further leverage this new capability to augment the experiments, and to generate data to build insights on the development of extreme fires and use the data to design a fire-danger classifier and fire-danger index protocol.

An example of 3D high-fidelity simulation. This is a controlled burn field experiment (FireFlux II) simulated using Google’s high fidelity fire simulator.

Acknowledgements

We thank Mark Finney, Jason Forthofer, William Chatham and Issac Grenfell from US Forest Service Missoula Fire Science Laboratory and our colleagues John Burge, Lily Hu, Qing Wang, Cenk Gazen, Matthias Ihme, Vivian Yang, Fei Sha and John Anderson for core contributions and useful discussions. We also thank Tyler Russell for his assistance with program management and coordination.

Source: Google AI Blog


Celebrating Earth Day with our inaugural Google for Startups Accelerator: Climate Change cohort

Posted by Jason Scott, Head of Startup Developer Ecosystem, USA | Nick Zakrasek, Global Product Lead, Sustainability

GIF of Climate Change Class Announcement

Today, people across the world will celebrate and participate in Earth Day. In line with Google’s broader commitment to address climate change, we are proud to join in this celebration by announcing the first cohort for our Google for Startups Accelerator: Climate Change program. The 10-week digital accelerator is designed to help North American sustainable technology startups take their businesses to the next level.

Meet the cohort of 11 companies, who are collectively leveraging technology and data to combat the challenge of climate change:

75F, Bloomington, Minnesota, USA

75F is a vertically-integrated building intelligence company using smart sensors, controllers and software to make commercial buildings more efficient and comfortable.

BlocPower, Brooklyn, New York, USA

BlocPower is providing software and financial tools to analyze, finance, and manage the challenge of converting millions of urban buildings off of fossil fuels.

CarbiCrete, Montreal, Quebec, Canada

CarbiCrete's concrete-making solution completely eliminates the need for cement, making it cheaper and stronger than traditional concrete, all through an overall carbon-negative process.

Enexor BioEnergy, Franklin, Tennessee, USA

Enexor BioEnergy delivers renewable electricity and thermal using organic, biomass, and plastic feedstock, helping to mitigate climate change while addressing global waste overabundance challenges.

FARM-TRACE, Vancouver, British Columbia, Canada

FARM-TRACE is a software platform which delivers verified reforestation impacts created by farmers to brands wanting to reduce their climate footprints.

Fermata Energy, Charlottesville, Virginia, USA

Fermata Energy designs, supplies, and operates technology that turns electric vehicles into energy storage assets that combat climate change, increase resilience, and dramatically lower the cost of ownership.

Flair, San Francisco, California, USA

Flair makes buildings more comfortable using less energy while promoting energy efficiency, electrification, and smart grid integration.

Heatworks, Mt. Pleasant, South Carolina, USA

Heatworks uses electronic controls and graphite electrodes to heat water instantly, endlessly, and precisely, without energy loss.

Wild Earth, Berkeley, California, USA

Wild Earth is a plant-based pet food company that harnesses biotech to create cruelty free products with less environmental impact.

Yard Stick PBC, Cambridge, Massachusetts, USA

Yard Stick fights climate change by measuring soil carbon accurately, instantly, and affordably, providing the “missing link” to carbon sequestration on the gigaton per year scale.

Zauben, Chicago, Illinois, USA

Zauben is designing the world's smartest green products, like sensor-driven, IoT-connected green roofs and living walls, to create healthier and happier environments for humans and our planet.

The program kicks off on Monday, June 7th and will focus on product design, technical infrastructure, customer acquisition, and leadership development - granting our founders access to an expansive network of mentors, senior executives, and industry leaders.

We are incredibly excited to support this group of entrepreneurs over the next three months and beyond, connecting them with the best of our people, products, and programming to advance their companies and solutions.

Be sure to join us as we showcase their accomplishments on Thursday, August 12th from 12:30pm - 2:00pm EST at our Google for Startups Accelerator: Climate Change Demo Day.

Environmental Insights Explorer Expands: 100 Australian councils and counting

Environmental Insights Explorer 

Reducing greenhouse gas (GHG) emissions is a crucial step in fighting the climate crisis. And cities now account for more than 70 percent of global emissions. But measuring exactly which activities—whether it’s buildings, cars, or public transport—are contributing to emissions, and by how much, is complex. Without this information, cities can neither understand the challenges they face, nor the impact of their environmental policies. 

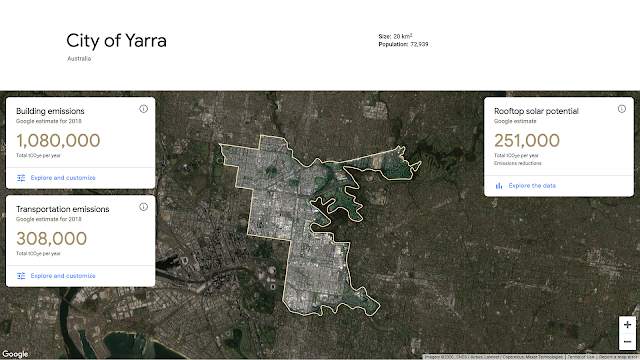
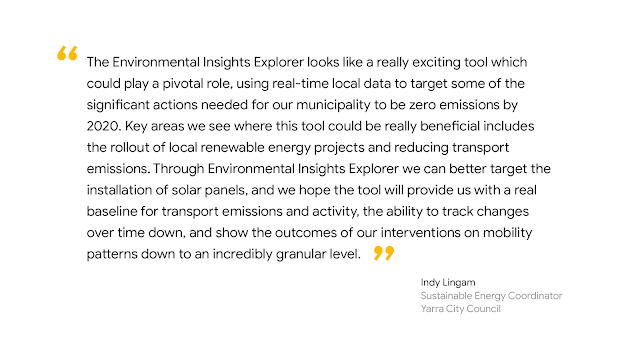
This is the problem we’re working to solve with Environmental Insights Explorer (EIE), an online platform that provides building and transportation emissions, as well as solar potential analysis to make it easier for cities to measure progress against their climate action plans. Launched in 2018 for a handful of cities around the world including Melbourne, with Sydney, Canberra and Adelaide then added in 2019, EIE has helped councils accelerate GHG reduction efforts. Today, we’ve expanded EIE data access to thousands of cities worldwide, including 100+ Australian councils. 

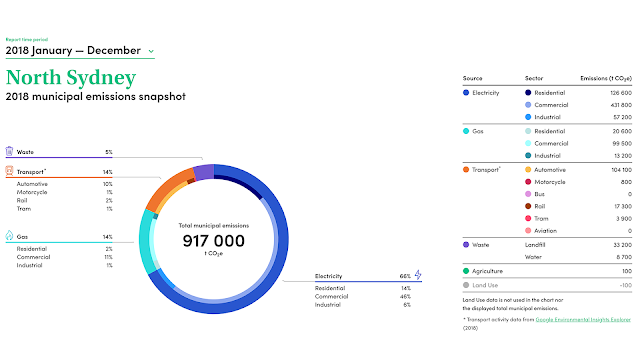
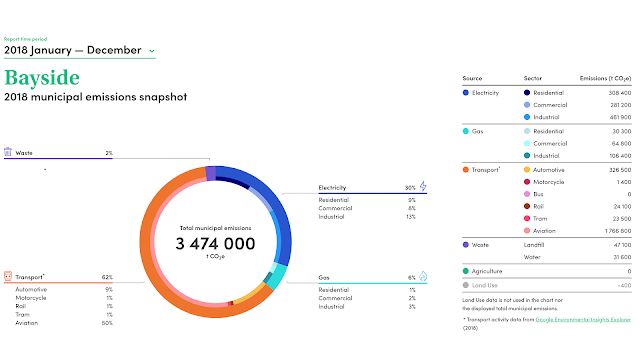
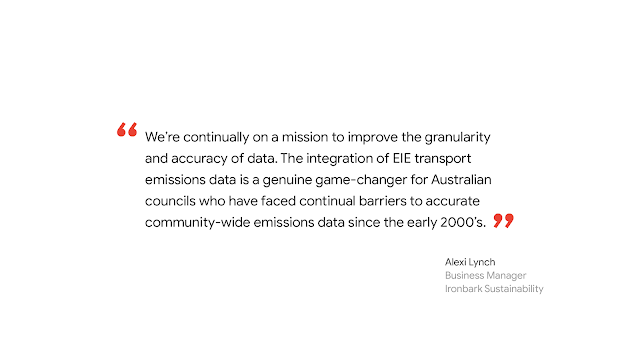
To scale data access to local governments, policy makers and community groups, we’re also developing partnerships with leading Australian organisations, councils, and climate change experts. This includes a new partnership with Ironbark Sustainability and Beyond Zero Emissions to make EIE transportation data available for 100+ councils in Snapshot—a free tool that calculates major sources of carbon emissions, including stationary energy, transport, waste, agriculture, and land-use change. Snapshot allows municipalities to easily compare their sources of carbon emissions. This data integration will provide updated GHG profiles and enable local government policy decision-making for more than 86 percent of the country's population to put councils on a fast track for delivering commitments, building local resilience, and ensuring economic recovery. 
Accelerated city-wide analysis 
By analysing Google’s comprehensive global mapping data together with GHG emission factors, EIE estimates city-scale building and transportation carbon emissions data with the ability to drill down into more specific data such as vehicle-kilometres travelled by mode (automobiles, public transit, biking, etc.) and the percentage of emissions generated by residential or non-residential buildings. 
The insights that EIE provides have traditionally required many months of research, and a lot of resources for cities undertaking a climate action plan. Using Google’s proprietary data coupled with machine learning capabilities, we can produce a complete survey of a city that can be assessed very quickly. In this way, EIE allows cities to leapfrog tedious and costly data collection and analysis. 
EIE transport data now available in Snapshot for 100+ councils 

The next chapter 
Over the next few months, we’ll be working together to help Australian councils learn more about data insights from EIE and expand data coverage to more councils. We hope that by making EIE data accessible to more councils across Australia, we’ll help nurture an ecosystem that can bring climate action plans to life. 


Environmental Insights Explorer Expands: 100 Australian councils and counting

Environmental Insights Explorer 

Reducing greenhouse gas (GHG) emissions is a crucial step in fighting the climate crisis. And cities now account for more than 70 percent of global emissions. But measuring exactly which activities—whether it’s buildings, cars, or public transport—are contributing to emissions, and by how much, is complex. Without this information, cities can neither understand the challenges they face, nor the impact of their environmental policies. 

This is the problem we’re working to solve with Environmental Insights Explorer (EIE), an online platform that provides building and transportation emissions, as well as solar potential analysis to make it easier for cities to measure progress against their climate action plans. Launched in 2018 for a handful of cities around the world including Melbourne, with Sydney, Canberra and Adelaide then added in 2019, EIE has helped councils accelerate GHG reduction efforts. Today, we’ve expanded EIE data access to thousands of cities worldwide, including 100+ Australian councils. 

To scale data access to local governments, policy makers and community groups, we’re also developing partnerships with leading Australian organisations, councils, and climate change experts. This includes a new partnership with Ironbark Sustainability and Beyond Zero Emissions to make EIE transportation data available for 100+ councils in Snapshot—a free tool that calculates major sources of carbon emissions, including stationary energy, transport, waste, agriculture, and land-use change. Snapshot allows municipalities to easily compare their sources of carbon emissions. This data integration will provide updated GHG profiles and enable local government policy decision-making for more than 86 percent of the country's population to put councils on a fast track for delivering commitments, building local resilience, and ensuring economic recovery. 
Accelerated city-wide analysis 
By analysing Google’s comprehensive global mapping data together with GHG emission factors, EIE estimates city-scale building and transportation carbon emissions data with the ability to drill down into more specific data such as vehicle-kilometres travelled by mode (automobiles, public transit, biking, etc.) and the percentage of emissions generated by residential or non-residential buildings. 
The insights that EIE provides have traditionally required many months of research, and a lot of resources for cities undertaking a climate action plan. Using Google’s proprietary data coupled with machine learning capabilities, we can produce a complete survey of a city that can be assessed very quickly. In this way, EIE allows cities to leapfrog tedious and costly data collection and analysis. 
EIE transport data now available in Snapshot for 100+ councils 

The next chapter 
Over the next few months, we’ll be working together to help Australian councils learn more about data insights from EIE and expand data coverage to more councils. We hope that by making EIE data accessible to more councils across Australia, we’ll help nurture an ecosystem that can bring climate action plans to life.