Tag Archives: Analytics

Beyond the ad: Conversion Optimization

Today, using data for driving business decisions has become common practice for most companies, with many having a dedicated analytics team checking the impact of marketing investments, which channels to invest in and effect. But the majority of these activities are focused on optimizing parameters before the audience click the ad. The question is: are you taking the same data driven approach to your website design?

If you don’t use data to optimize your site’s user experience, you risk low conversion rates and lost revenue. A well-designed user interface could increase your website’s conversion rate by up to 200 percent, and a better UX design could yield conversion rates up to 400 percent. 

Now take your revenue, check your conversion rate, and calculate what it would be if the conversion rate would increase +200%. The number right there is why the companies that will thrive in the future most likely will be the ones that are data driven in, and focus as much on, both crucial moments during the user journey—before and beyond the ad.

The solution

Building this strength comes down to working with the research methods within conversion optimization and step by step A/B testing your way to a website your customers will love using.

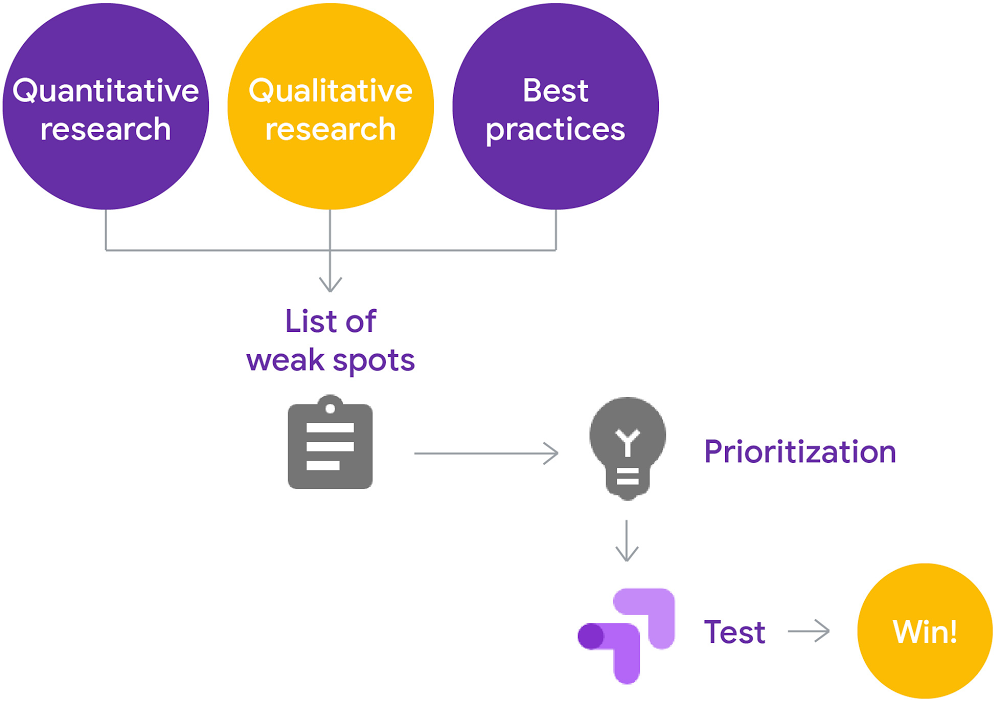
Here are three steps on how to get started:

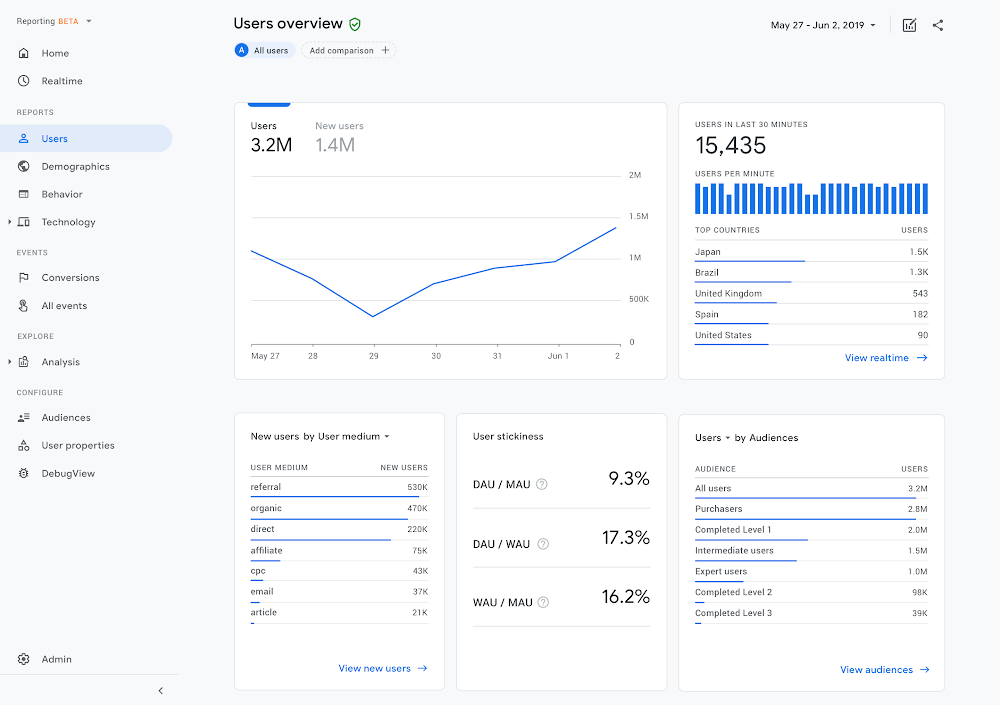
  1. Find the weak spots on the site. Combine quantitative research in Google Analytics, qualitative research such as user testing (in the Optimize Resource Hub you can find easy instructions) and inspiration from best practices. The Optimize Resource Hub gives you best practice suggestions from Google and a library of test results from other companies

  2. Prioritize the most impactful tests. Give each test idea a score of one to ten according to the uplift you think it will generate, and subtract a score of one to ten depending on the effort the test will require. 

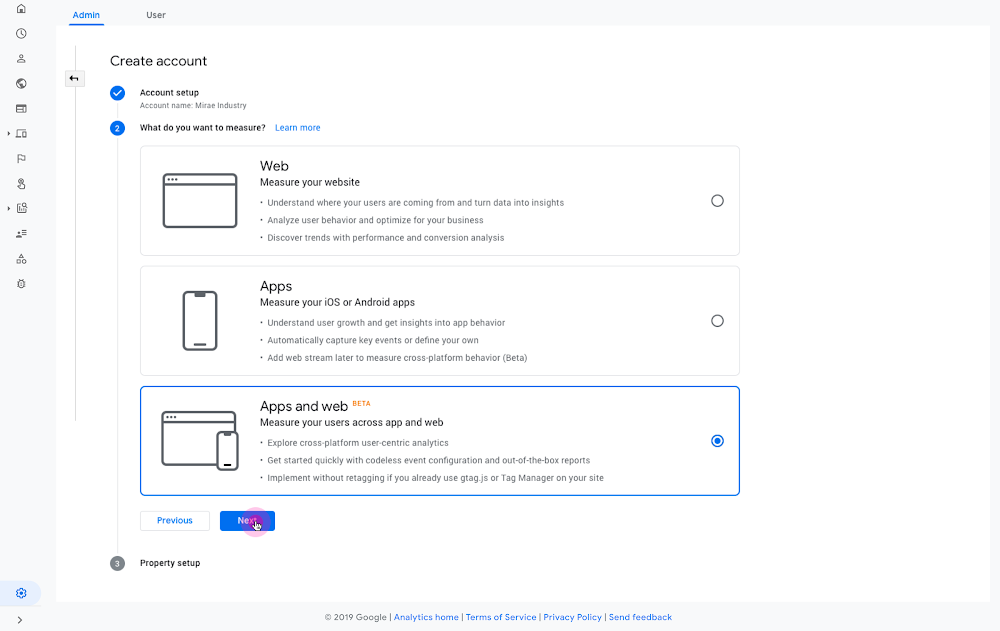
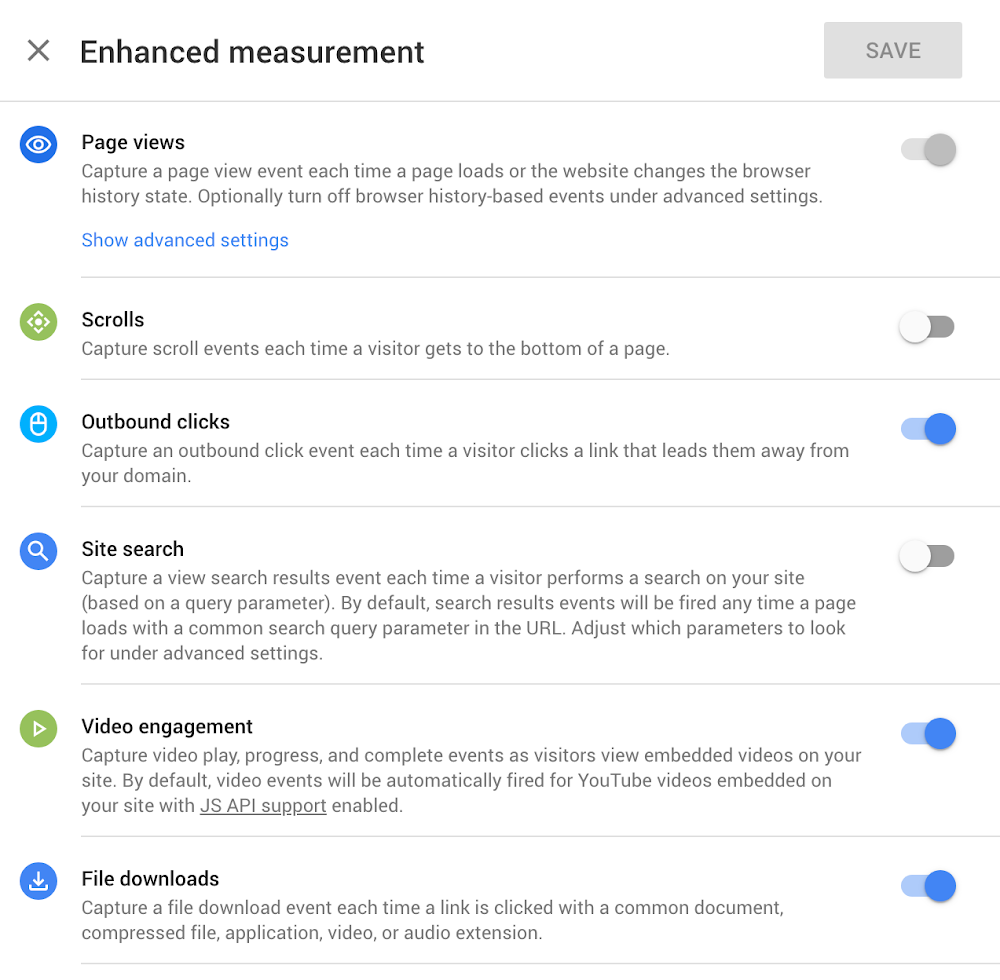
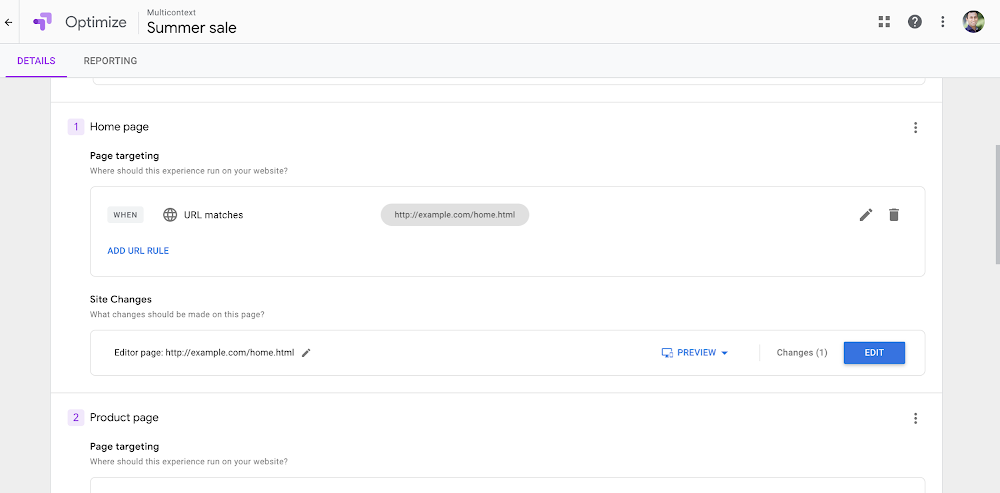
  3. Start testing. You can get started today by setting up Google Optimize—the tool that uses the full power of Google Analytics. A free version is available so you can have a test up and running within a few minutes. 

For more in-depth knowledge around the process of conversion optimization, check out the CRO tips in the Optimize Resource Hub.
Optimize CRO 1

Learn from experts

We have one more treat for you, in the form of a new series of articles that will be published here on the blog: The Optimize CRO Series—Experts share their secrets. In this series, CRO experts from all over the world will give their best advice around these topics:

  • Research methods

  • Prioritizing tests

  • Favorite frameworks for analyzing sites

  • How to do a QA (quality assurance) of an A/B test 

  • The experts’ best tests

  • Learn from the failing tests

Eager to know more? Make sure you start following the Google Analytics products blog through the channel that fits you to get the upcoming guides.

The mobile challenge, and how to measure it

Does your mobile website have a lower conversion rate than your desktop version? As some people are spending up to 70% of their time on mobile, imagine how much additional revenue you could gain if the conversion rate levels were the same. 

A recent report showed that mobile conversion rates are 47 percent of the levels achieved on desktop. As more and more of your customers are using mobile devices, you need to ensure your mobile conversion rate is keeping up, and maintain your revenue.


One way you can monitor your mobile website performance is by reviewing your Relative Mobile Conversion Rate (Rel mCvR), which is calculated by dividing the mobile conversion rate with the desktop conversion rate.

Mobile Site Challenge 1

The high traffic share for mobile, with lower conversion rates, will show your stakeholders that there is a gap the company will need to bridge by improving the mobile site.


Mobile and desktop conversion rates are influenced by two main parameters. The first is traffic influencers—this can be things like channel mix, marketing campaign, seasonality. The second is the performance of the website, for example UX and site speed. Any of these can cause your mobile or desktop conversion rate to go up or down.


The benefit of using Rel mCvR to evaluate your mobile performance is that traffic influencers tend to not impact the metric. Why? Because the same campaigns and seasonalities will reach both mobile and desktop versions of your website, a good marketing campaign will make both the mobile and desktop conversion rate go up but leave Rel mCvR stable. When you evaluate the metric over time, it will show us if we have improved our mobile website.


Things to keep in mind when evaluating Rel mCvR: 

  • Always keep an eye on your desktop conversion rate. If Rel mCvR has an abnormal peak, check if it’s due to the desktop having a technical problem that made the desktop conversion rate decrease. 

  • Track your Rel mCvR weekly. Because the metric is based on your entire website’s performance, driving improvement will take time. Reviewing your data daily can be too volatile, look for the large movements over time instead.

  • Be mindful of that companies with physical stores may never reach 100 percent in Rel mCvR, as mobile is often used for doing research before or while visiting a store. 70 percent is a good target to start with.

Mobile Site Challenge 2

How to improve your mobile site and Rel mCvR


A better user experience on your mobile site leads to increased revenue and better Rel mCvR. To get there, I recommend you start A/B testing on your mobile site to improve your mobile conversion rate. It’s through A/B tests that you become guided by your customers and provide what they need. 


Start with these three steps: 

  1. Review the process of conversion optimization in the Optimize Resource Hub. 

  2. Get inspired by what other companies have done.

  3. Set up your first test–for free–in Google Optimize


When you’re focused on improving your mobile site with conversion optimization and A/B tests—your Rel mCvR will start to show your progress.

A new way to unify app and website measurement in Google Analytics

People expect to interact with businesses when and how they like, such as browsing a brand's website to research a product and then purchasing it later using the brand's app. Getting insight into these cross-platform journeys is critical for businesses to predict customer needs and provide great experiences—but it can be very challenging.

Currently, many businesses measure app engagement with Google Analytics for Firebase and website engagement with Google Analytics. While each of these products separately offer powerful insights, getting a more unified picture of engagement across your app and website can be a manual and painstaking process. 

To make this simpler, we’re announcing a new way to measure apps and websites together for the first time in Google Analytics.

Unified app and web analytics  

First, we’re introducing a new property type, App + Web, that allows you to combine app and web data for unified reporting and analysis.

Onboarding

 Measure your app and website together in Google Analytics

Reports for this new property use a single set of consistent metrics and dimensions, making it possible to see integrated reporting across app and web like never before. Now you can answer questions like: Which marketing channel is responsible for acquiring the most new users across your different platforms? How many total unique users do you have, regardless of which platform they use? How many conversions have occurred on your app and website in the last week—and which platform is driving most of these conversions?

User Overview

See combined metrics across your app and website

You can also go deeper to understand the effectiveness of your marketing campaigns across platforms. For example, you can see how many users started on your app then visited your website to make a purchase.

Flexible event measurement

Understanding how people engage with your app and website means that you need to measure a diverse range of user interactions like clicks, page views, app opens, and more. We’re making it easier to measure those actions on all of your platforms in a consistent way. The new property type utilizes a more flexible event-based model for collecting the unique interactions that users have with your content, allowing you to measure any custom event that you set up. 

This event-based model also allows you to automate the manual work of tagging some of the events on your site with no additional coding required. In addition to page views, enhanced measurement allows you to measure many common web events like scrolls, downloads, video views and more with the flip of a toggle in the admin settings for your property.

Enhanced measurement helps you measure events with the flip of a toggle

Enhanced measurement helps you measure events with the flip of a toggle

Cross-platform analysis

Given the many different ways people interact with your brand between app and web, you need flexible tools to make sense of your data and discover insights unique to your business. The new Analysis module enables you to examine your data in ways that are not limited by pre-defined reports.

There are a number of techniques you can use including: 

  • Exploration: Conduct ad-hoc analysis by dragging and dropping multiple variables—the different segments, dimensions, and metrics you use to measure your business—onto a canvas to see instant visualizations of yourdata.

The Exploration technique allows you to visualize your data with drag and drop ease

The Exploration technique allows you to visualize your data with drag and drop ease

  • Funnels: Identify important steps to conversion and understand how users navigate among them—where they enter the funnel, as well as where they drop off—with both open and closed funnel options

Understand how users engage with a sequences of key events on your app and website using the Funnels technique

Understand how users engage with a sequence of key events on your app and website using the Funnels technique

  • Path analysis: Understand the actions users take between the steps within a funnel to help explain why users did or did not convert.

Visualize actions taken on the users’ path to conversion with the Path analysis technique

Visualize actions taken on the users’ path to conversion with the Path analysis technique

Once you’ve surfaced insights from your analysis, you can use the results to create audiences and use those audiences to deliver more relevant marketing experiences to your customers. 

Start measuring across platforms

The first version of this new app and web experience—including the new event model and new analysis capabilities—will be available to all Analytics and Analytics 360 accounts in beta in the coming weeks. If you use Google Tag Manager or the global site tag for Google Analytics today, there’s no re-tagging required for your website. To include your app data, you’ll need the Firebase SDK implemented in your app. See how to get started in Google Analytics, or if you’re an existing Firebase customer, here’s how to upgrade.

If your business has both an app and website, and is looking for a more complete view of how your customers engage across both, we encourage you to participate in this beta and share your feedback. We are working to make Google Analytics the best possible solution for helping you understand the customer journey and create great customer experiences across platforms. Your partnership is essential to help us get there.

A new way to unify app and website measurement in Google Analytics

People expect to interact with businesses when and how they like, such as browsing a brand's website to research a product and then purchasing it later using the brand's app. Getting insight into these cross-platform journeys is critical for businesses to predict customer needs and provide great experiences—but it can be very challenging.

Currently, many businesses measure app engagement with Google Analytics for Firebase and website engagement with Google Analytics. While each of these products separately offer powerful insights, getting a more unified picture of engagement across your app and website can be a manual and painstaking process. 

To make this simpler, we’re announcing a new way to measure apps and websites together for the first time in Google Analytics.

Unified app and web analytics  

First, we’re introducing a new property type, App + Web, that allows you to combine app and web data for unified reporting and analysis.

Onboarding

 Measure your app and website together in Google Analytics

Reports for this new property use a single set of consistent metrics and dimensions, making it possible to see integrated reporting across app and web like never before. Now you can answer questions like: Which marketing channel is responsible for acquiring the most new users across your different platforms? How many total unique users do you have, regardless of which platform they use? How many conversions have occurred on your app and website in the last week—and which platform is driving most of these conversions?

User Overview

See combined metrics across your app and website

You can also go deeper to understand the effectiveness of your marketing campaigns across platforms. For example, you can see how many users started on your app then visited your website to make a purchase.

Flexible event measurement

Understanding how people engage with your app and website means that you need to measure a diverse range of user interactions like clicks, page views, app opens, and more. We’re making it easier to measure those actions on all of your platforms in a consistent way. The new property type utilizes a more flexible event-based model for collecting the unique interactions that users have with your content, allowing you to measure any custom event that you set up. 

This event-based model also allows you to automate the manual work of tagging some of the events on your site with no additional coding required. In addition to page views, enhanced measurement allows you to measure many common web events like scrolls, downloads, video views and more with the flip of a toggle in the admin settings for your property.

Enhanced measurement helps you measure events with the flip of a toggle

Enhanced measurement helps you measure events with the flip of a toggle

Cross-platform analysis

Given the many different ways people interact with your brand between app and web, you need flexible tools to make sense of your data and discover insights unique to your business. The new Analysis module enables you to examine your data in ways that are not limited by pre-defined reports.

There are a number of techniques you can use including: 

  • Exploration: Conduct ad-hoc analysis by dragging and dropping multiple variables—the different segments, dimensions, and metrics you use to measure your business—onto a canvas to see instant visualizations of yourdata.

The Exploration technique allows you to visualize your data with drag and drop ease

The Exploration technique allows you to visualize your data with drag and drop ease

  • Funnels: Identify important steps to conversion and understand how users navigate among them—where they enter the funnel, as well as where they drop off—with both open and closed funnel options

Understand how users engage with a sequences of key events on your app and website using the Funnels technique

Understand how users engage with a sequence of key events on your app and website using the Funnels technique

  • Path analysis: Understand the actions users take between the steps within a funnel to help explain why users did or did not convert.

Visualize actions taken on the users’ path to conversion with the Path analysis technique

Visualize actions taken on the users’ path to conversion with the Path analysis technique

Once you’ve surfaced insights from your analysis, you can use the results to create audiences and use those audiences to deliver more relevant marketing experiences to your customers. 

Start measuring across platforms

The first version of this new app and web experience—including the new event model and new analysis capabilities—will be available to all Analytics and Analytics 360 accounts in beta in the coming weeks. If you use Google Tag Manager or the global site tag for Google Analytics today, there’s no re-tagging required for your website. To include your app data, you’ll need the Firebase SDK implemented in your app. See how to get started in Google Analytics, or if you’re an existing Firebase customer, here’s how to upgrade.

If your business has both an app and website, and is looking for a more complete view of how your customers engage across both, we encourage you to participate in this beta and share your feedback. We are working to make Google Analytics the best possible solution for helping you understand the customer journey and create great customer experiences across platforms. Your partnership is essential to help us get there.

Get to insights quicker with Data Studio’s new home page

It should be easy for everyone to discover and share insights from their data. As of today, Data Studio has a new home page, making finding and creating reports more efficient. Together with recent improvements to chart interactivity and sharing, and the 25+ Data Studio features launched this year, you can go from data to insights to action faster than ever.

Data Studio Home Page

Create in a snap with a streamlined home page

Data Studio’s clean new look puts the focus on what’s most important, so you can start digging into your data right away. We’ve heard that you frequently use search to find reports, so we put the search box front and center. You can also create a Report, Data Source, or Explorer in less time with the new Create button. Finally, the new design should be familiar to users of G Suite products like Drive and Gmail, and is in line with our material design principles.

Data Studio Design

Reveal additional insights with interactive charts

Earlier this year, we introduced the ability to interact with charts to filter other charts on the report page. Since then, we’ve brought even more interactivity to charts. If a report viewer wants to sort a chart differently, you can now allow them to do so right from the chart, without needing to edit the report. If they want to see a breakdown at a lower level of detail—for example, by city rather than by country—you can now allow them to drill down right within the chart.

Data Studio Interactive Charts

Explore your data at the speed of thought with BigQuery BI Engine

We also launched support for BigQuery BI Engine (Beta), a super-fast in-memory engine for interactive visual analysis. Together, Data Studio and BigQuery BI Engine enable you to interact with your data and see results in a fraction of a second.

Share insights with others through scheduled email

Want to send someone an offline copy or snapshot of a report? You can download a report as a PDF. Want to send someone a report on a regular basis? Automate the task with scheduled email delivery.

Data Studio Scheduled Email

Data Studio’s new home page and these new features make it easier than ever to find and create reports, discover insights, and share them with others. 

Extend the reach of your site personalization in Google Optimize

Personalization features in Google Optimize help businesses customize sites so their customers can find exactly what they’re looking for, when they’re looking for it. For example, marketers can display a special promotion on their site for all visitors, or provide product recommendations based on customers’ previous purchase behavior.


Multi-page experiences in Optimize help you more easily deliver what your customers are looking for. Now, when you create a personalization or experiment, you’ll see an option to add additional pages so that you can extend its reach throughout your entire site—from the initial landing page to the final checkout page. Let’s take a look at two examples:


Coordinated customization across your entire site


Picture this: You’re planning for a sale next month and will be offering a 20 percent off discount code to all visitors. You want to see if displaying this code across your entire site will increase site conversions. Because each type of page on your site has a unique layout, you need to find a different spot to display your promotion on each page. 


Now with Optimize, you can test this idea by creating a single experiment and adding multiple pages to it using the “+ Add page” button.


From there, you’ll have the option to edit those pages so that you can display the promotion wherever it looks best in each case—whether that’s at the top of your site on the homepage or next to the pricing on your product page. 


When you are happy with the results of the multi-page experiment, you can turn it into a multi-page personalization with just one click.


The right experience to the right audience


If you’re using Optimize 360, you have the added ability to focus your experiment or personalization to your Google Analytics audiences.  


Using the same sale example, let’s say you want to offer a 35 percent off discount to your most loyal customers. You can create a multi-page personalization in the same way as described above. You can place the 35 percent discount banner and copy in all the pages that your loyal customers visit. When this personalization is launched, your loyal customers will always see this discount as they move from the home page, through your site, to the checkout page.


Optimize Summer Sale

Want to learn how you can use this feature? Visit this article on our Help Center.

Multi-page experiences are already available to all Optimize and Optimize 360 accounts.  You’ll be able to ensure your customers see the right message at the right time—even as they explore multiple pages on your site. And by creating a more valuable online experience, they’ll keep visiting you again and again. 

Introducing BigQuery parameters in Data Studio

If you’re one of the many Data Studio users writing custom queries for BigQuery, you can now run parameterized queries. This provides better customization and interaction options to your users while making your reports faster.


When connecting to BigQuery from Data Studio you can use special date parameters or define your own named parameters as part of a custom query. Parameters in custom queries introduce two key benefits: queries can be dynamically updated from the report - no need to create new data sources; this works even if the report user does not have edit access to the data source. You can optimize query cost and gain dashboard performance improvements since less data is passed from BigQuery to Data Studio for parameterized queries.

Creating parameterized custom queries


Let's say you're interested in analyzing word usage by corpus for a selected set of Shakepeare's works. The following BigQuery Public Dataset, bigquery-public-data.samples.shakespeare,is available to carry out this analysis:
BQ Public Dataset

To allow report editors to choose which corpus to analyze from Shakespeare’s works you can use the Custom Query interface of the BigQuery connector in Data Studio to define corpus as a parameter as part of a filter. You can define the type of UI element for the parameter (e.g., text input, single select, checkbox, etc.) and provide default values.


In the following example, the corpus parameter has been defined as a single-select dropdown with Hamlet as the default value along with other works as options such as Othello, King Lear, etc.

A BigQuery custom query with a custom corpus parameter

A BigQuery custom query with a custom corpus parameter

What’s really cool is that once you’ve defined the configuration, report editors will then be able to choose a specific corpus to analyze by using the dropdown from the parameters section of the report property panel:

Report Property Panel

E.g. The corpus parameter options in the

Data Studio property panel.

Using date parameters


Prior to date parameters, custom queries for date sharded or partitioned tables could not be limited to a date range based on a report’s date control. Instead, your custom query would have to fetch all rows for all dates, leaving Data Studio to do the job of filtering for the date range selected by the report user. The result is slower and less efficient reports.


With date parameters, you can use the reserved start and end date parameters as part of a custom query. When report users select a date range for analysis the dates selected will automatically be included as part of your custom query, resulting in a much more efficient query and fetching only the rows needed for the requested date range.


The following example custom query uses the @DS_START_DATE and @DS_END_DATE parameters as part of a filter on the creation date column of a table. The records produced by the query will be limited to the date range selected by the report user, reducing the number of records returned and resulting in a faster query:


BQ Custom Query

A BigQuery custom query using start and end date parameters

The standard Data Studio date settings and controls will determine the date values for your custom query. A report editor can set a default date or add a date control to a report and the start and end dates for your query will change based on the report date control.


In both cases, named and date parameters offer a more efficient way to retrieve data from a single BigQuery data source while giving your report users flexible options to analyze different data.


Try it out!

To learn more about how parameters work review data source parameters and connecting to BigQuery


As you have a chance to experiment with parameters, send us feedback or give us a shout out at @googleanalytics.


Tag Manager: Introducing Custom Templates

Google Tag Manager and Tag Manager 360 help you more easily and safely deploy tags for all your marketing and measurement tools. Security and collaboration features give IT teams more control over the tagging process, while features like auto-event triggers and built-in templates help marketers get the data they need without having to deal with code.


For scenarios where the built-in templates don’t cover your needs, we also offer options to deploy your own custom HTML and JavaScript. To help protect the security of your users and sites, we already scan all custom HTML tags for malware. Developers can also choose to blacklist custom scripts directly on page. But, we want to help make tagging even safer.


Today, we’re introducing Custom Templates—a new set of features in Tag Manager and Tag Manager 360 to give you more transparency and control over the tags on your site.


With Custom Templates, you can use a built-in Template Editor to design tag and variable templates that can be used throughout your container.

custom gtm animation

This means that less technical users can manage instances of your custom tags just like the built-in tags, without messing with code. (Custom Templates will show up alongside the built-in templates when you go to add a new tag or variable.) And, since you can write your template once and reuse it, less code will need to be loaded on your site.

Template permissions


In order to provide a safer execution environment for your tags, Custom Templates use a sandboxed version of JavaScript. With sandboxed JavaScript, certain potentially sensitive operations (e.g. loading external scripts, accessing cookies, sending pixels, etc.) require the use of sandbox APIs:


Custom GTM Code

When you use these APIs, associated template permissions will automatically be surfaced and require that you declare how you’re using them (e.g. where external scripts can be loaded from, which cookies can be accessed, where data can be sent, etc.):

Custom GTM Perms

The behavior of your templates is tightly controlled by these permissions. Other users will be able to see exactly what your custom tags and variables are permitted to do. And, developers can write on-page policies to govern their behavior.


Starting today, you’ll see a new Templates section in the left sidebar of your containers. Whether you’re a marketer wanting to do more in Tag Manager without code or a developer wanting more control over third-party tags on your site, Custom Templates will improve your tagging capabilities.


Visit our developer documentationto learn more about Custom Templates, sandboxed Javascript, and permissions.

Gathering insights in Google Analytics can be as easy as A-B-C

Today’s customers are deeply curious, searching high and low for information about a product before making a purchase. And this curiosity applies to purchases big and small—just consider the fact that mobile searches for “best earbuds” have grown by over 130 percent over the last two years. (Google Data, US, Oct 2015 - Sep 2016 vs. Oct 2017 - Sep 2018. ) To keep up with this curious customer, marketers are putting insights at the center of the strategy so that they can understand customers’ intentions and deliver a helpful, timely experience.

In our new guide about linking Google Analytics and Google Ads, we explore the broad range of reports available in Analytics. These reports give you crucial insights about the customer journey that can then be used to inform your campaigns in Google Ads. Here’s what you should know about the A-B-Cs of reporting.


Acquisition reports

How did your customers end up on your site in the first place? Acquisition reports answer this question, offering insights about how effectively your ads drive users to your site, which keywords and search queries are bringing new users to your site, and much more. This video gives you a quick overview of how Acquisition reports work.  


Behavior reports

How do you users engage with your site once they visit? Behavior reports give you valuable insights about how users respond to the content on your site. You can learn how each page is performing, what actions users are taking on your site, and much more about the site experience. Learn more about behavior reporting here.


Conversion reports

What path are users taking towards conversion? Conversion reporting in Analytics gathers valuable insights about those actions that are important to the success of your business—such as a purchase or completed sign-up for your email newsletter. Goal Flow reports help you see how a user engages as they move toward a conversion while Ecommerce reports are specifically designed to deliver insights for sites centered around purchases.


Reports open up a world of actionable insights that help you deeply understand and then quickly enhance a customer journey that is more complex than ever.


Missed the other posts in this series? Catch up now to read how creating effective campaigns for the modern customer journey can be achieved by bringing Google Analytics and Google Ads together.

And, download our new guide and learn how getting started with these reports is easy as A-B-C.

5 steps to improve media performance using Google Analytics

This is the second post in a series about how linking Google Analytics and Google Ads can help marketers gain deeper insights, create smarter campaigns, and drive better business outcomes.


Today’s customers expect the right message at the right time—even as their journeys become more fast-paced and less linear. How are marketers responding? With ad experiences that aim to be assistive and personalized. To create these experiences, marketers are turning to integrated analytics and ads.


In our new guide about linking Google Analytics and Google Ads, we highlight some of the actionable steps you and your team can take to deliver the right ad at the right time.


Step 1: Link your accounts

Linking Google Analytics and Google Ads puts insight-gathering and ad creation side by side—so that you can easily create campaigns that are informed by detailed site metrics and conversion data. And linking your accounts only requires a few easy steps. Here’s how to get started.


Step 2: Activate Cross Device capabilities

Cross Device capabilities in Analytics help you understand how your customers are behaving across their different devices so that you can optimize your strategy. For instance, you might find that, based on cross device insights, you want to increase your mobile ad spend to drive more conversions. Activating Google signals makes Cross Device capabilities available to you.


Step 3: Create an Analytics audience and share with Google Ads

When you create an audience in Analytics then share it with Google Ads, you’re able to create ad campaigns that are specifically tailored to specific segments of your audience. For instance, you can create an audience of all of your returning customers, then create a Google Ads campaign specifically for this audience. Here's how you get started sharing audiences in Google Ads.


Step 4: Create and import Goals

Goals in Google Analytics can represent any site metric you find important—such as time spent on your site, a specific action taken on your site, or a conversion. Importing these Goals into Google Ads enables you to access valuable conversion insights and site engagement metrics right in Google Ads. Here’s how  to create Goals in Analytics and then import them into Google Ads.   


Step 5: Generate and view reports

When you link Google Analytics and Google Ads, you gain access to a variety of reports about your Google Ads campaigns right in your Analytics account — giving you important campaign performance insights that can be used to improve your marketing strategy. Learn more about Acquisition, Behavior, and Conversion reports.


Read our new guide to read about how bringing Google Analytics and Google Ads together can bring your media performance to the next level.


In case you missed how integrating Google Analytics and Google Ads can be a marketer's solution to delivering experiences that meet consumers’ rising expectations, check out our post Google Analytics and Google Ads: A Powerful Pairing. Next up, we'll cover how you can easily gather the insights you need to better understand the customer journey with Google Analytics.

Source: Google Ads