Simulated Policy Learning in Video Models


Deep reinforcement learning (RL) techniques can be used to learn policies for complex tasks from visual inputs, and have been applied with great success to classic Atari 2600 games. Recent work in this field has shown that it is possible to get super-human performance in many of them, even in challenging exploration regimes such as that exhibited by Montezuma's Revenge. However, one of the limitations of many state-of-the-art approaches is that they require a very large number of interactions with the game environment, often much larger than what people would need to learn to play well. One plausible hypothesis explaining why people learn these tasks so much more efficiently is that they are able to predict the effect of their own actions, and thus implicitly learn a model of which action sequences will lead to desirable outcomes. This general idea—building a so-called model of the game and using it to learn a good policy for selecting actions—is the main premise of model-based reinforcement learning (MBRL).

In "Model-Based Reinforcement Learning for Atari", we introduce the Simulated Policy Learning (SimPLe) algorithm, an MBRL framework to train agents for Atari gameplay that is significantly more efficient than current state-of-the-art techniques, and shows competitive results using only ~100K interactions with the game environment (equivalent to roughly two hours of real-time play by a person). In addition, we have open sourced our code as part of the tensor2tensor open source library. The release contains a pretrained world model that can be run with a simple command line and that can be played using an Atari-like interface.

Learning a SimPLe World Model
At a high-level, the idea behind SimPLe is to alternate between learning a world model of how the game behaves and using that model to optimize a policy (with model-free reinforcement learning) within the simulated game environment. The basic principles behind this algorithm are well established and have been employed in numerous recent model-based reinforcement learning methods.
Main loop of SimPLe. 1) The agent starts interacting with the real environment. 2) The collected observations are used to update the current world model. 3) The agent updates the policy by learning inside the world model.
To train an Atari game playing model we first need to generate plausible versions of the future in pixel space. In other words, we seek to predict what the next frame will look like, by taking as input a sequence of already observed frames and the commands given to the game, such as "left", "right", etc. One of the important reasons for training a world model in observation space is that it is, in effect, a form of self-supervision, where the observations—pixels, in our case—form a dense and rich supervision signal.

If successful in training such a model (e.g. a video predictor), one essentially has a learned simulator of the game environment that can be used to generate trajectories for training a good policy for a gaming agent, i.e. choosing a sequence of actions such that long-term reward of the agent is maximized. In other words, instead of having the policy be trained on sequences from the real game, which is prohibitively intensive in both time and computation, we train the policy on sequences coming from the world model / learned simulator.

Our world model is a feedforward convolutional network that takes in four frames and predicts the next frame as well as the reward (see figure above). However, in the case of Atari, the future is non-deterministic given only a horizon of the previous four frames. For example, a pause in the game longer than four frames, such as when the ball falls out of the frame in Pong, can lead to a failure of the model to predict subsequent frames successfully. We handle stochasticity problems such as these with a new video model architecture that does much better in this setting, inspired by previous work.
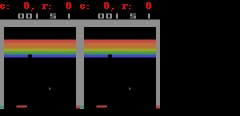
One example of an issue arising from stochasticity is seen when the SimPle model is applied to Kung Fu Master. In the animation, the left is the output of the model, the middle is the groundtruth, and the right panel is the pixel-wise difference between the two. Here the model's predictions deviate from the real game by spawning a different number of opponents.
At each iteration, after the world model is trained, we use this learned simulator to generate rollouts (i.e. sample sequences of actions, observations and outcomes) that are used to improve the game playing policy using the Proximal Policy Optimization (PPO) algorithm. One important detail for making SimPLe work is that the sampling of rollouts starts from the real dataset frames. Because prediction errors typically compound over time and make long-term predictions very difficult, SimPLe only uses medium-length rollouts. Luckily, the PPO algorithm can learn long-term effects between actions and rewards from its internal value function too, so rollouts of limited length are sufficient even for games with sparse rewards like Freeway.

SimPLe Efficiency
One measure of success is to demonstrate that the model is highly efficient. For this, we evaluated the output of our policies after 100K interactions with the environment, which corresponds to roughly two hours of real-time game play by a person. We compare our SimPLe method with two state of the art model-free RL methods, Rainbow and PPO, applied to 26 different games. In most cases, the SimPLe approach has a sample efficiency more than 2x better than the other methods.
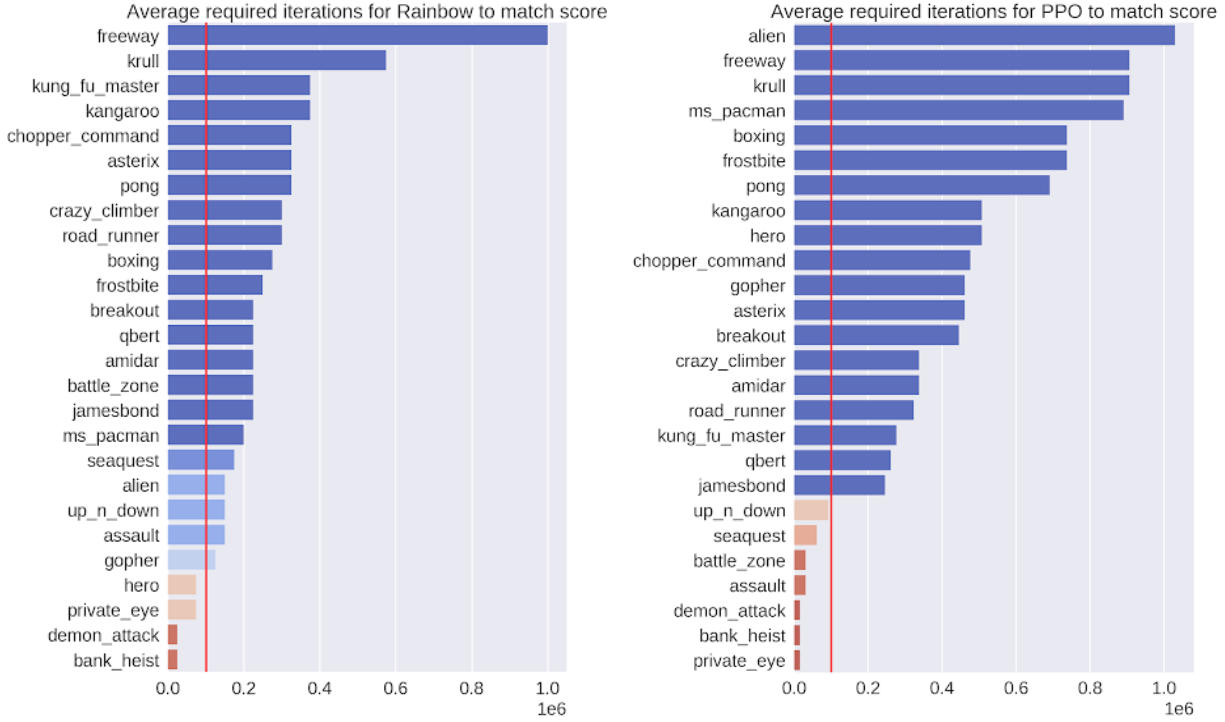
The number of interactions needed by the respective model-free algorithms (left - Rainbow; right - PPO) to match the score achieved using our SimPLe training method. The red line indicates the number of interactions used by our method.
SimPLe Success
An exciting result of the SimPLe approach is that for two of the games, Pong and Freeway, an agent trained in the simulated environment is able to achieve the maximum score. Here is a video of our agent playing the game using the game model that we learned for Pong:
For Freeway, Pong and Breakout, SimPLe can generate nearly pixel-perfect predictions up to 50 steps into the future, as shown below.
Nearly pixel perfect predictions can be made by SimPLe, on Breakout (top) and Freeway (bottom). In each animation, the left is the output of the model, the middle is the groundtruth, and the right pane is the pixel-wise difference between the two.
SimPLe Surprises
SimPLe does not always make correct predictions, however. The most common failure is due to the world model not accurately capturing or predicting small but highly relevant objects. Some examples are: (1) in Atlantis and Battlezone bullets are so small that they tend to disappear, and (2) Private Eye, in which the agent traverses different scenes, teleporting from one to the other. We found that our model generally struggled to capture such large global changes.
In Battlezone, we find the model struggles with predicting small, relevant parts, such as the bullet.
Conclusion
The main promise of model-based reinforcement learning methods is in environments where interactions are either costly, slow or require human labeling, such as many robotics tasks. In such environments, a learned simulator would enable a better understanding of the agent's environment and could lead to new, better and faster ways for doing multi-task reinforcement learning. While SimPLe does not yet match the performance of standard model-free RL methods, it is substantially more efficient, and we expect future work to further improve the performance of model-based techniques.

If you'd like to develop your own models and experiments, head to our repository and colab where you'll find instructions on how to reproduce our work along with pre-trained world models.

Acknowledgements
This work was done in collaboration with the University of Illinois at Urbana-Champaign, the University of Warsaw and deepsense.ai. We would like to give special recognition to paper co-authors Mohammad Babaeizadeh, Piotr Miłos, Błażej Osiński, Roy H Campbell, Konrad Czechowski, Chelsea Finn, Piotr Kozakowski, Sergey Levine, Ryan Sepassi, George Tucker and Henryk Michalewski.

Source: Google AI Blog


New data tools from the Google News Initiative, built for publishers

Thirteen years ago, as a new manager in the Strategic Planning department at The New York Times, my boss shared an article about what it takes to transform your organization into one that's “data-driven."  As someone who loves numbers, I was thrilled. Data means rigor, in both thinking and processes. I knew it was critical for evaluating where we were and where we wanted to go. Now, with more than ten years under my belt at the Times, and another three at Google, I have a more nuanced view of the complexity required to become truly data-centered—particularly what it means for people, processes and the technological obstacles that must be overcome.

It’s this appreciation for the power and challenges of mastering data that drives much of our work with the Google News Initiative. And today, we're introducing a suite of new resources and programs to help news organizations with their data, including using data to drive business decisions, creating foundational data strategies and understanding data capabilities and gaps.

Realtime Content Insights: Informing content and product strategy with audience data

A year ago, we launched News Consumer Insights: a report built on top of Google Analytics that helps news organizations of all sizes understand and segment their audiences with a subscriptions strategy in mind. Thousands of news organizations around the world, including BuzzFeed News, Business Insider, Conde Nast and Village Media, have used this tool to measure, understand and grow their businesses.

Today, we’re launching a new, free insights tool called Realtime Content Insights (RCI), built to help newsrooms make quick, data-driven decisions on content creation and distribution. Journalists will be able to identify which articles are the most popular across their audience and what broader topics are trending in their regions. RCI also helps newsrooms visualize their data with a full screen display mode. It’s now available for publishers using all versions of Google Analytics.

The RCI “Newsroom View” feature, which displays in full screen real-time data from publishers' top articles.

RCI’s “Newsroom View” feature, which displays in full screen real-time data from your top articles.

Propensity to Subscribe: Using data to improve user experiences and unlock reader revenue

Last year we also launched Propensity to Subscribe, a signal within Google Ad Manager based on machine learning models, to help publishers identify who’s likely to pay for content and who isn't. Publishers can use this signal to present potential subscribers with the right offer at the right time. We’re making progress on our propensity modeling: early tests from our model suggest that readers in the top 20 percent of likely subscribers are 50 times more likely to subscribe than readers in the bottom 20 percent. As of today, we’re in a closed beta of product development with 11 partners, including the Washington Post and McClatchy. We plan to integrate this signal within Subscribe with Google later this year.

GNI Data Lab: Transform your advertising business through responsible data use

As anyone who’s worked with a 500-row spreadsheet can tell you, more data doesn’t always lead to better decisions. That’s why we created the GNI Data Lab, in collaboration with The Local Media Association, enable selected news organizations to transform their businesses through responsible data use. Six publishers will be selected to participate in the Lab, and will undergo a 12-week-long program to understand and improve their underlying data capabilities. They’ll also receive support to build and test new digital advertising strategies, including:

  • Serving the most relevant advertisements to readers based on context and reader behavior
  • Optimizing advertising pricing based on the behavior of different audience segments
  • Optimizing the mix across direct sales, private marketplaces, and open auctions

As with the GNI Subs Lab announced last week, we’ll share best practices with the broader community of news organizations.

Data Maturity Benchmark: Assess your data capabilities and move up the scale

The first step to improving your data capabilities is understanding where you are compared to other companies in your field. That’s why today, in collaboration with Deloitte, we’re introducing a Data Maturity Benchmarking Tool that will help publishers assess their data maturity, compare themselves to other news organizations and take steps to improve. The tool accompanies a new report published today by Deloitte that examines how news and media companies can use data to increase user engagement on digital platforms and drive value through the monetization of those platforms.

A screenshot of the Data Maturity Benchmarking Tool on a mobile phone.

The Data Maturity Benchmark, which shows news companies how they score on data maturity.

Those of us working on the Google News Initiative believe that data, if used securely and responsibly, is a key contributor to news organizations’ digital success. To learn more about our data tools, you can access the new Realtime Consumer Insights tool here, take the Data Maturity Benchmarking assessment here, and download the Data Activation guide here.

Accepting student applications for Google Summer of Code 2019

We are now accepting applications from university students who want to participate in Google Summer of Code (GSoC) 2019. Want to hone your software development skills while doing good for the open source community?

This year we are celebrating 15 years of introducing university students from around the world to open source software communities and our passionate community of mentors. For 3three months students code from the comfort of their homes and receive stipends based on thefor successful completion of their project milestones.

Past participants say the real-world experience that GSoC provides sharpened their technical skills, boosted their confidence, expanded their professional network and enhanced their resume.

Interested students can submit proposals on the program site between now and Tuesday, April 9, 2019 at 18:00 UTC.

While many students began preparing in late February when we announced the 200+ participating open source organizations, it’s not too late for you to start! The first step is to browse the list of organizations and look for project ideas that appeal to you. Next, reach out to the organization to introduce yourself and determine if your skills and interests are a good fit. Since spots are limited, we recommend writing a strong proposal and submitting a draft early so you can get feedback from the organization and increase the odds of being selected.

You can learn more about how to prepare by watching the video below and checking out the Student Guide and Advice for Students.


You can find more information on our website, including a full timeline of important dates. We also highly recommend reviewing the FAQ and Program Rules.

Remember to submit your proposals early as you only have until Tuesday, April 9 at 18:00 UTC. Good luck to all who apply!

By Stephanie Taylor, Google Open Source

How I teach my friends to know what’s actually true online

Editor's note: Madelyn Knight, 18, is a senior at Southport High School in Indianapolis and is the editor-in-chief of the school news magazine, The Journal. She was recently awarded the 2019 Indiana High School Journalist of the Year by the Indiana High School Press AssociationMediaWise is part of the Google News Initiative and is a Google.orgfunded partnership between The Poynter Institute for Media Studies, the Stanford History Education Group (SHEG), theLocal Media Association(LMA) and the National Association for Media Literacy Education(NAMLE). MediaWise aims to teach one million students how to discern fact from fiction online by 2020.

The average time I spend on my phone each day is four hours and 48 minutes, according to a screen-time tracker on my smartphone. Three of these hours are devoted almost entirely to being on social media. When my friends from my high school use the same trackers, their results are similar to mine.

This means that every day, for three or more hours a day, I am exposed to an endless amount of information, and not all of it is true. Each day, I scroll through social media feeds, liking and commenting on my favorite posts. And every once in a while, I come across a post that makes me stop. Maybe it’s a claim about the world ending or a cool solar event captured by NASA. Maybe it’s about a new government policy or the latest celebrity news. But almost every time, I stop and think, “Is this real?”

In this area, I have an advantage over my peers. I am a student journalist, who has learned about media literacy and how news spreads. I’ve learned about fact-checking and bias within news sites because of being on my school’s news magazine. I know that not everything on the internet is true.

But not all of my friends are that lucky. I know that not everyone is as aware that there may be false information, and they don’t have the knowledge to combat it.

This is why we need MediaWise. Today’s teenagers and children have quite literally grown up on the internet. Yet we aren’t taught how to tell if something shared on the internet is real. It only makes sense to give teenagers a guide to notice the signs and how to conduct their own research on something they see online.

The first time I heard about MediaWise was at the High School Journalism Institute at Indiana University the summer before the beginning of my senior year. At the time, MediaWise had just begun, and they weren’t sure how or when they were going to have teens help fact-check. However, I knew I wanted to be a part of MediaWise right away. I kept up with the details and emails until finally, I joined theteen fact-checking network for the winter session in January.

As a part of the network, I’ve had the opportunity to make videos for MediaWise’s social media platforms, teaching people how to fact-check what they see online. One of my favorite tricks and tips is thereverse Google Image search, which makes finding an image on the internet super simple. I used it in my first fact-check, and I think it’s probably one of the most useful tools out there. What I noticed, however, is that a lot of my friends and peers didn’t even know it existed. Because of that fact-check, I know I am teaching people my age how to use that resource and create a simpler, more accurate online world.

Personally, I’ve definitely adjusted the way I look at the internet. When I show my friends a meme, they always joke, “Hey! Did you fact-check that?” They’ve sent me links to posts I could possibly fact-check, and that means they, too, are thinking about what they see online. It helps me realize that what I am doing is actually making a difference.

Being a teen fact-checker with MediaWise has taught me a lot about myself. But mostly, it’s taught me that I have the ability to make a difference in the world. I’m no longer complaining that people don’t know what they’re talking about online. I’m actually showing them how they can get better.

Rove around “Mars on Earth” in Street View

Devon Island, a desolate land mass in Canada’s Arctic with a polar climate and treacherous terrain, is the largest uninhabited island on Earth. Yet the factors that make the island unlivable also make it indispensable to the scientists and researchers who work there—its climate and landscape are the closest thing to Mars that can be found on Earth.  

Mars on Earth: A Visit to Devon Island

Now anyone can visit "Mars on Earth" in Street View. Last year, I received a special invite from Dr. Pascal Lee, chairman of the Mars Institute and director of the Haughton-Mars Project, to visit Devon Island and learn about the research done there. We spent three months preparing for the expedition, and after 72 hours on seven flights, found ourselves at basecamp surrounded by an untouched landscape.

Devon Island, much like a future base on Mars, lacks the infrastructure we take for granted. All the supplies needed for camp—food, gasoline, tools and personal supplies—must be brought along on each excursion, and all the waste packed up and brought back to the mainland. At the research base, everyone has their job. Even Dr. Lee’s dog KingKong has a responsibility—he’s there to serve as an advance warning in case a polar bear wanders into camp.


Every morning, before heading out to collect Street View on ATVs, we would brief as a group to make sure everybody knew the plan that day: who was leading, who would ride rear, and who was staying at camp to cook and handle maintenance. This provided a real insight into how humans who will go to Mars will explore the new planet: detailed planning and preparation is key.

Visit Devon Island in Google Earth

Visit Devon Island on Google Earth

Throughout the week, we rode to some of the places of most interest to NASA’s research and exploration: Haughton Crater, an impact crater 20-kilometers in diameter; Astronaut Canyon, similar to many of the V-shaped, winding valleys on Mars; and the ancient lake beds of Breccia Hills. What strikes you most about Devon Island is how vast and desolate everything is. Yet every rock, hill and canyon tells a story. Breccia Hills, for example, is filled with shatter cones, rocks created by meteor impact millions of years ago.

We were also able to capture our experience on a Pixel 3, shooting the first-ever documentary filmed on Pixel to showcase just how majestic, and sometimes trying, training for a Mars Mission on Devon Island can be.


Explore “Mars on Earth” and learn about the work being done there in a new Google Earth guided tour.

Beta Channel Update for Desktop

The Chrome team is excited to announce the promotion of Chrome 74 to the beta channel for Windows, Mac and Linux. Chrome 74.0.3729.28 contains our usual under-the-hood performance and stability tweaks, but there are also some cool new features to explore - please head to the Chromium blog to learn more!


A full list of changes in this build is available in the log. Interested in switching release channels?  Find out how here. If you find a new issue, please let us know by filing a bug. The community help forum is also a great place to reach out for help or learn about common issues.


Krishna Govind
Google Chrome

Dev Channel Update for Desktop

The dev channel has been updated to 74.0.3729.28 for Windows, Mac & Linux.


A partial list of changes is available in the log. Interested in switching release channels? Find out how. If you find a new issue, please let us know by filing a bug. The community help forum is also a great place to reach out for help or learn about common issues.
Krishna Govind
Google Chrome

A new app to map and monitor the world’s freshwater supply

Water affects all of us, no matter where we live. Drought harms everyone, from farmers in the western United States dealing with long-term drought, to people in Kazakhstan and Uzbekistan suffering debilitating health consequences from the Aral Sea draining, to millions of people displaced by floods in Kerala, India. About four billion people, or almost two-thirds of the world’s population, experience severe water scarcity at least one month of the year.


Water, critical to daily life, and a key priority in the United Nations Sustainable Development Goals (SDG 6), has proven difficult for most countries to measure. In 2017, of the roughly 200 United Nations Environment member countries, 80 percent of them were unable to provide fundamental national statistics. Even still, many knew substantial changes were happening.
2

The Aral Sea has shrunk by around 80 percent since 1985

Today, on World Water Day, we’re proud to showcase a new platform enabling all countries to freely measure and monitor when and where water is changing: UN’s Water-Related Ecosystems, or sdg661.app. Released last week in Nairobi at the UN Environment Assembly (UNEA), the app provides statistics for every country’s annual surface water (like lakes and rivers). It also shows changes from 1984 through 2018 through interactive maps, graphs and full-data downloads.

This project is only possible because of the unique partnerships between three very different organizations. In 2016, European Commission's Joint Research Centre (JRC) and Google released the Global Surface Water Explorer in tandem with a publication in “Nature.” An algorithm developed by the JRC to map water was run on Google Earth Engine. The process took more than 10 million hours of computing time, spread across more than 10,000 computers in parallel, a feat that would have taken 600 years if run on a modern desktop computer. But the sheer magnitude of the high resolution global data product tended to limit analysis to only the most tech savvy users and countries.

The new app, created in partnership with United Nations Environment, aims to make this water data available to everyone. Working with member countries to understand their needs, it features smaller, more easily manageable tables and maps at national and water body levels. Countries can compare data with one another, and for the first time gain greater understanding of the effects of water policy, and infrastructure like dams, diversions, and irrigation practices on water bodies that are shared across borders.
3

Lake Mead, the largest man-made reservoir in the United States, has fluctuated as Las Vegas expands.

Lakes

Egypt's Toshka Lakes lakes were created by diverting water from Lake Nasser so crops could be irrigated in the desert region. When the project was abandoned, the lakes evaporated.

Today, countries have very different capacities when it comes to monitoring their waters. Countries with substantial existing resources have found the app results align closely with their current methods, and are evaluating using this new data source, which will enable them to reallocating resources toward other priorities in the future. For countries that have never had this information, the app provides free, scientifically validated data, that will now inform their environmental policies. For the first time ever, we have a globally consistent way of measuring water and its changes over time. And it’s accessible to everyone.


The UN’s theme for this year’s World Water Day is “Leaving no one behind,” and we’re working to do just that. Google platforms are playing an important role to help every country better understand their own environment and resources, so we can all design for a sustainable world.

Beta Channel Update for Chrome OS

The Beta channel has been updated to Chrome Version: 73.0.3683.88 (Platform version: 11647.104.0) for most Chrome OS devices. This build contains a number of bug fixes, security updates and feature enhancements. A list of changes can be found here


If you find new issues, please let us know by visiting our forum or filing a bug. Interested in switching channels? Find out how. You can submit feedback using 'Report an issue...' in the Chrome menu (3 vertical dots in the upper right corner of the browser).


Cindy Bayless
Google Chrome