You’ve heard of Street View, but have you heard of Sheep View? As un-bahh-lievable as it may sound, these wooly creatures have helped us collect truly ewe-nique Street View imagery. That’s just one of the unexpected ways we’ve added imagery to our Street View collection. Through the years, we’ve captured images on remote islands, along rough terrain and underwater. Since we can’t reach all of those locations by car, we’ve naturally had to get creative. For a peek behind the curtain, here are 13 of the most creative ways we’ve collected Street View imagery — some of which have led to our favorite Street Views ever.
1. By trike
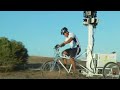
During a coffee run in 2010, one of Google’s senior mechanical engineers spotted a pedi-cab riding through Mountain View. Inspired, he got to talking with the owner, and the Google Trike was born. The Street View Trike allowed Google to map locations that were previously inaccessible to our fleet of cars, making its debut collecting off-road imagery at California's LegoLand. Cyclists rode the modified pedicab in decorative Google jerseys through zoos, landmarks and universities.

We developed the Street View Trike to help us access off-road locations.
2. By boat
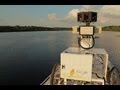
Next, the team wanted to capture the beauty of the Amazon, but you can’t exactly cycle down the world’s largest river. Our solution was to put the Street View Trike onto a boat and see what happened. We ended up collecting imagery of the Rio Negro, an Amazon Forest trail and five river communities. Weeks after, when program manager Karin Tuxen-Bettman reviewed the footage, she was surprised to find it was partially obscured by a frog that had perched itself on the lens.
“I wasn't aware while it was happening, so there was nothing I could do to change it,” says Karin. “But I was delighted. It represents the unexpected, which we grew to expect on this imagery collection expedition.”
A frog landed on the lens during a Street View shoot of the Amazon, showing us it isn’t always smooth sailing.
3. By snorkelers and scuba divers
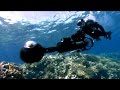
Boats are great, but what about taking Street View pictures underwater? We’ve done that, too. The ocean covers 71% of the Earth's surface, yet only 5% has been explored. Over the years, our team has partnered with snorkelers and divers to bring underwater imagery to Street View. In ourGoogle Earth collection, you can swim by shipwrecks, reefs and coral gardens across the world.

Scuba diving and snorkeling allowed us to create underwater images.
4. By snowmobile
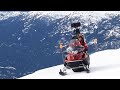
Another one of our Street View goals was to make imagery of the ski slopes in Vancouver globally accessible in time for the 2010 Winter Olympics. We achieved this by introducing the Street View Snowmobile. After customizing a snowmobile by attaching a pole-mounted camera, we took to the slopes.
“I am originally from Poland, and I love skiing,” says Magdalena Filak, one of the Googlers leading operations for our Street View Special Collects at the time. “It was so much fun to map the ski resorts with the snowmobile, and then share the captured imagery with my friends and family to plan our skiing trips. The imagery that we captured was just so serene, calm and beautiful.”
There was snow much fun to be had while collecting these cool pictures.
5. By backpack
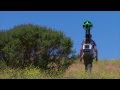
Even with trikes and snowmobiles, there continued to be locations and landmarks we couldn’t access. That’s where the Street View Trekker came in. Originally introduced in 2012, the first Trekker featured a 360-degree camera system mounted onto a wearable backpack. This allowed wearers to collect images on foot. In 2018, the device got an upgrade with 140-megapixel cameras and laser sensors that can quickly create a digital map of the area.
The backpack Trekker provided flexibility and freedom, expanding Street View’s reach.
6. By camel

The Trekker was fashioned onto a camel, gathering images as the animal walked through the desert.
Yes, you read that right. In order to capture the beauty of the Liwa desert, the Street View Trekker was mounted atop an Arabian one-humped camel, also known as a dromedary. Home to early settlers back in the Late Stone Age, the Liwa desert sand dunes reach a height of up to 131 feet. Using camels for the collection allowed us to collect authentic imagery and minimize our disruption of this fragile environment.
“I had never gone to a desert before, and although I adore animals, I had never been so fortunate to be near a camel,” says Valentina Frassi, a Googler who led some collections for the Middle East and North Africa region at the time. “Dealing with unconventional means of transport, like our stubborn camel friend Raffia, is not an everyday task.”
7. By sheep
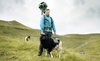
We worked with sheep, the local community and the Street View team to document the Faroe Islands.
Camels aren’t our only fuzzy photographer friends. Home to just 50,000 people, the Faroe Islands are an archipelago in the middle of the North Atlantic Ocean known for having more sheep than human residents. In 2016, a few of those sheep were equipped with solar powered cameras to collect Street View imagery, documenting the local islands.
8. By astronaut

Reaching for the stars, our team partnered with astronaut Thomas Pesquet to give a tour of the International Space Station. Because of the constraints of working in space (and the whole zero gravity thing), Thomas couldn’t use just any equipment. Our team worked with NASA at the Johnson Space Center in Houston and Marshall Space Flight Center in Huntsville, Alabama, to design a gravity-free solution that used DSLR cameras and equipment already on the ISS. Then Thomas sent the pictures down to Earth where we stitched them together to create panoramic 360-degree imagery.
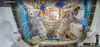
We worked with astronaut Thomas Pesquet, NASA and Marshall Space Flight Center to bring Street View to space.
9. By ATV
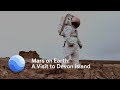
Made uninhabitable by its rough terrain and polar climate, Devon Island in Canada’s Arctic is an important site for researchers and scientists as its environment is the closest to Mars that can be found without leaving the planet. In 2019, we partnered with Dr. Pascal Lee, chairman of the Mars Institute and director of the Haughton-Mars Project, to get imagery on ATVs of “Mars on Earth.” Just like a trip to Mars, our trip to collect Street View imagery required careful planning and preparation. The team delegated tasks including leading explorations, packing supplies, cooking, handling ATV maintenance and collecting imagery. Dr. Lee’s dog even served as a lookout for polar bears.
10. By raft
Going with the flow, the Street View raft rode the tides of Atol das Rocas.
As part of a partnership with the federal institute for biodiversity in Brazil, ICMBio, we mounted a Street View camera onto a raft and floated out to a ring shaped island, or atoll, that is only accessible to crews with authorization from The Brazilian Navy and ICMBio. According to Tom Nora, a Googler who led the collection team, the raft was a useful solution to one of the team’s biggest challenges: the changing tides that caused the atoll to quickly fill and empty.
“Because of the tide changes, we had to stay in the atoll – which is pretty much an island without clean water – so no shower or sink,” says Tom. “The power on the island, coming from a local solar power plant, was not working. All three people that were living on the island were biologists, so they didn't know how to fix it. Since I'm an electrical engineer and had experience with power electronics, I was able to fix it for them. It was a great win-win situation.”
11. By trolley
We created the Street View Trolley for art lovers with the goal of bringing the world’s most acclaimed museums to Maps. Since we can’t drive the Street View car indoors, our team designed a stable four-wheeled push cart that could bear a heavy load. We equipped it with a panoramic camera to collect 360-degree views, lasers to capture distances to walls, motion sensors to track Trolley’s position, a hard drive to store data and a laptop to operate the system.
12. By rappel
Sometimes the best shots require some extra work, like when New Zealand Googler Matthew Davison came up with the idea of taking a Street View Trekker inside an active volcano. Matthew and a team of explorers rappelled over 1,300 feet into the Marum crater in the South Pacific island nation of Vanuatu, suspending over a molten lava lake the size of two football fields!
“When I came up with the idea, my colleagues thought it was an elaborate prank,” says Matthew, who leads volcano expeditions around the world as a hobby. “When volcanoes aren’t impacting people, they're a beautiful spectacle to look at. Capturing such a rare phenomenon and being able to share it with the world was a huge privilege.” It was also a huge responsibility, Matthew notes: “We had to use specialized heat suits to protect ourselves from the immense heat. Our most important priority was keeping everyone safe.”
13. By model train

We’d traveled far and wide, but a 2016 Street View project in Hamburg, Germany presented a new challenge: shrinking down. The Miniatur Wunderland attraction features the world’s largest model railway with over 42,000 feet of track. Our team partnered with Ubilabs, a data and location technology company, to create our own miniature vehicles that could drive over train tracks and down the streets of the fictional town Knuffingen, one of Miniatur Wunderland’s “theme worlds.” Miniatur Wunderland was crafted with an eye for detail, with thousands of tiny citizens going about their days. Our Street View collection allows you to explore a rowdy Oktoberfest celebration, replicas of several famous landmarks across the world and even some details not visible to museum visitors.