 Learn more about the history of Google Earth as it turns 20.
Our favorite moments from 20 years of Google Earth
Learn more about the history of Google Earth as it turns 20.
Learn more about the history of Google Earth as it turns 20.
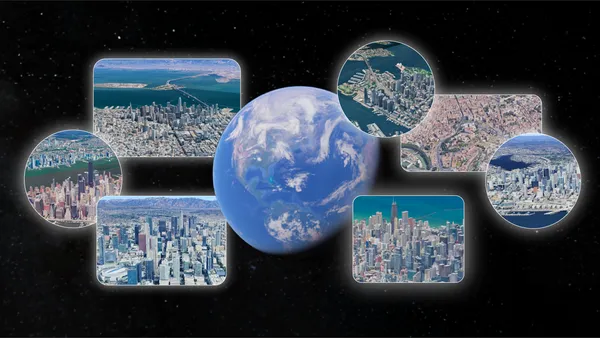 Take Google Earth’s quiz to see if you can identify city skylines as they’ve changed over time.
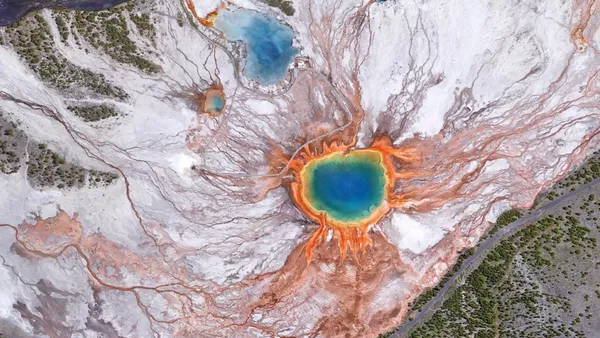
 Two decades ago, Google Earth launched and changed the way we see our planet forever. To mark this incredible milestone, we're sharing a collection of historical imagery…
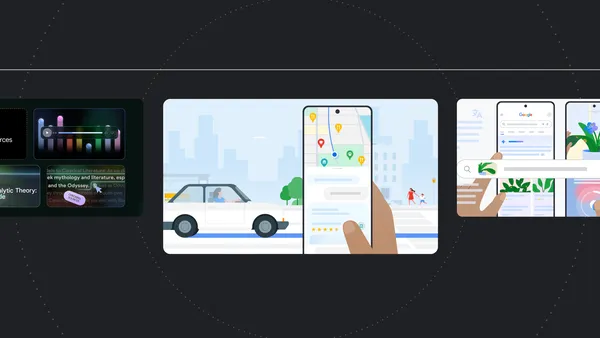 Here are 7 of Google’s latest AI updates from October.
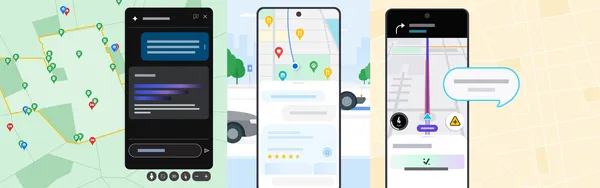 Here are all the latest updates for Google Maps, Earth, Waze and our developer platforms.
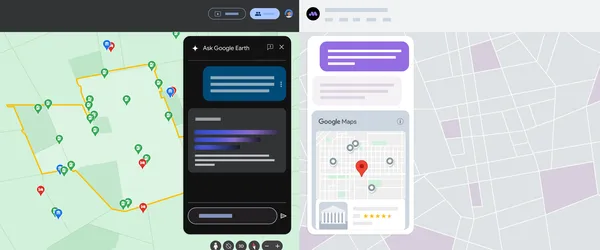 Check out the latest developer updates for Google Earth and Google Maps Platform, including grounding with Maps.
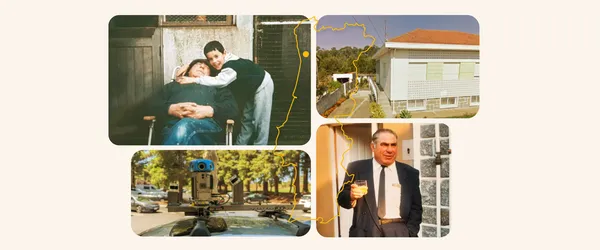 Here’s one Googler’s story of discovering an unexpected and meaningful memory of his grandfather on Google Street View.
 Google Earth adds historical imagery and Street View expands to nearly 80 places in the latest update.
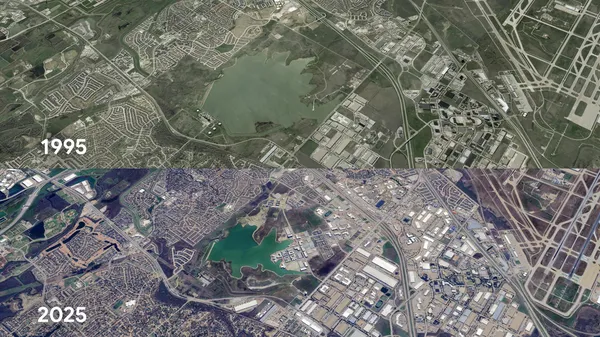
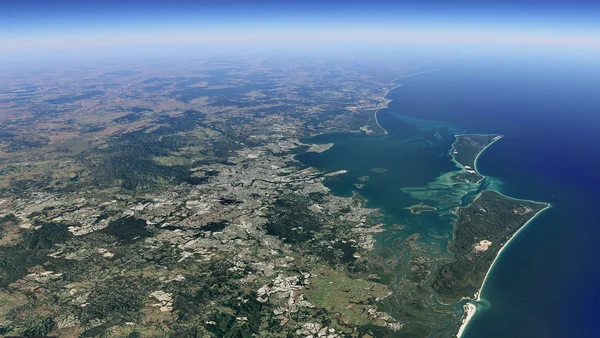 We’re adding imagery from 2021-2022 to Timelapse in Google Earth, so you can see how the earth’s surface has changed over time.
We’re adding imagery from 2021-2022 to Timelapse in Google Earth, so you can see how the earth’s surface has changed over time.
We’re adding imagery from 2021-2022 to Timelapse in Google Earth, so you can see how the earth’s surface has changed over time.