Posted by Dianne Hackborn, Android framework team
Android 4.4 KitKat introduced a new system service called procstats that helps you better understand how your app is using the RAM resources on a device. Procstats makes it possible to see how your app is behaving over time — including how long it runs in the background and how much memory it uses during that time. It helps you quickly find inefficiencies and misbehaviors in your app that can affect how it performs, especially when running on low-RAM devices.
You can access procstats data using an adb shell command, but for convenience there is also a new Process Stats developer tool that provides a graphical front-end to that same data. You can find Process Stats in Settings > Developer options > Process Stats.
In this post we’ll first take a look at the Process Stats graphical tool, then dig into the details of the memory data behind it, how it's collected, and why it's so useful to you as you analyze your app.

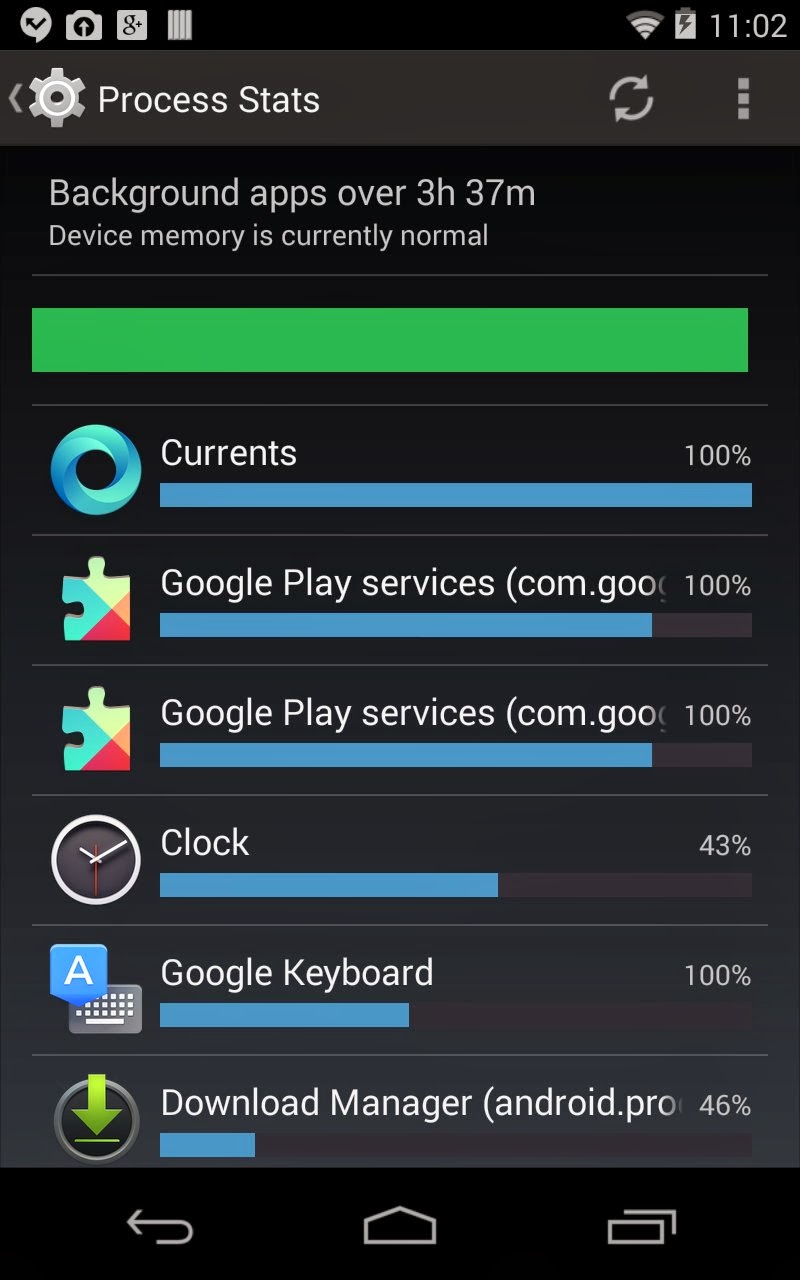
Process Stats overview of memory used by background processes over time.
Looking at systemwide memory use and background processes
When you open Process Stats, you see a summary of systemwide memory conditions and details on how processes are using memory over time. The image at right gives you an example of what you might see on a typical device.
At the top of the screen we can see that:
- We are looking at that data collected over the last ~3.5 hours.
- Currently the device’s RAM is in good shape ("Device memory is currently normal").
- During that entire time the memory state has been good — this is shown by the green bar. If device memory was getting low, you would see yellow and red regions on the left of the bar representing the amount of total time with low memory.
Below the green bar, we can see an overview of the processes running in the background and the memory load they've put on the system:
- The percentage numbers on the right indicate the amount of time each process has spent running during the total duration.
- The blue bars indicate the relative computed memory load of each process. (The memory load is
runtime*avg_pss, which we will go into more detail on later.)
- Some apps may be listed multiple times, since what is being shown is processes (for example, Google Play services runs in two processes). The memory load of these apps is the sum of the load of their individual processes.
- There are a few processes at the top that have all been running for 100% of the time, but with different weights because of their relative memory use.
Analyzing memory for specific processes
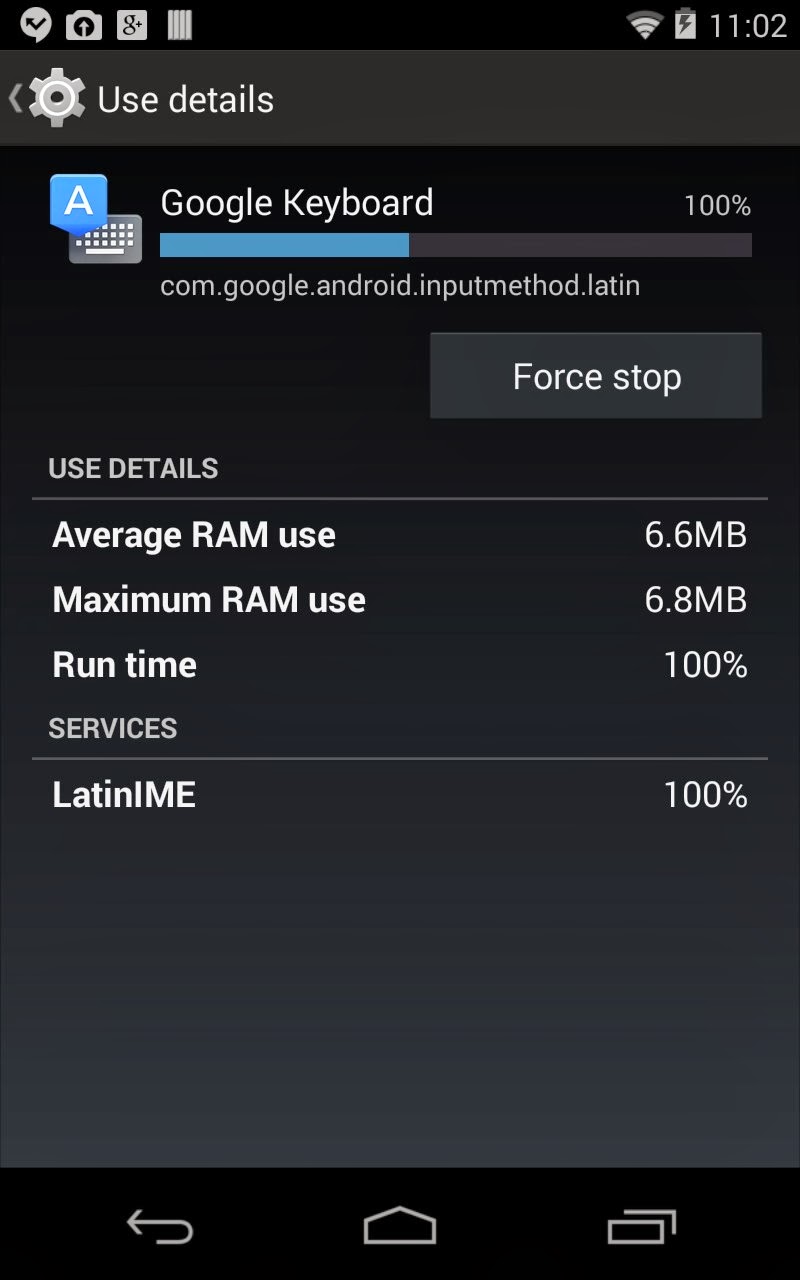
The example shows some interesting data: we have a Clock app with a higher memory weight than Google Keyboard, even though it ran for less than half the time. We can dig into the details of these processes just by tapping on them:
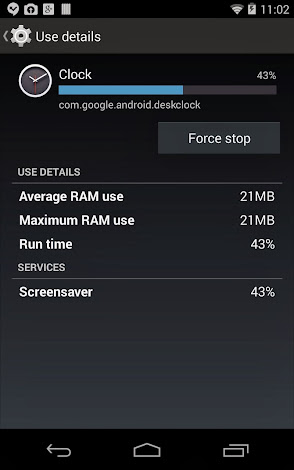

Process Stats memory details for Clock and Keyboard processes over the past 3.5 hours.
The details for these two processes reveal that:
- The reason that Clock has been running at all is because it is being used as the current screen saver when the device is idle.
- Even though the Clock process ran for less than half the time of the Keyboard, its ram use was significantly larger (almost 3x), which is why its overall weight is larger.
Essentially, procstats provides a “memory use” gauge that's much like the storage use or data use gauges, showing how much RAM the apps running in the background are using. Unlike with storage or data, though, memory use is much harder to quantify and measure, and procstats uses some tricks to do so. To illustrate the complexity of measuring memory use, consider a related topic: task managers.
Understanding task managers and their memory info
We’ve had a long history of task managers on Android. Android has always deeply supported multitasking, which means the geeky of us will tend to want to have some kind of UI for seeing and controlling this multitasking like the traditional UI we are used to from the desktop. However, multitasking on Android is actually quite a bit more complicated and fundamentally different than on a traditional desktop operating system, as I previously covered in Multitasking the Android Way. This deeply impacts how we can show it to the user.
Multitasking and continuous process management
To get a feel for just how different process management is on Android, you can take a look at the output of an important system service, the activity manager, with adb shell dumpsys activity. The example below shows a snapshot of current application processes on Android 4.4, listing them from most important to least:
ACTIVITY MANAGER RUNNING PROCESSES (dumpsys activity processes)
Process LRU list (sorted by oom_adj, 22 total, non-act at 2, non-svc at 2):
  PERS #21: sys   F/ /P  trm: 0 23064:system/1000 (fixed)
  PERS #20: pers  F/ /P  trm: 0 23163:com.android.systemui/u0a12 (fixed)
  PERS #19: pers  F/ /P  trm: 0 23344:com.nuance.xt9.input/u0a77 (fixed)
  PERS #18: pers  F/ /P  trm: 0 23357:com.android.phone/1001 (fixed)
  PERS #17: pers  F/ /P  trm: 0 23371:com.android.nfc/1027 (fixed)
  Proc # 3: fore  F/ /IB trm: 0 13892:com.google.android.apps.magazines/u0a59 (service)
    com.google.android.apps.magazines/com.google.apps.dots.android.app.service.SyncService<=Proc{23064:system/1000}
  Proc # 2: fore  F/ /IB trm: 0 23513:com.google.process.gapps/u0a8 (provider)
    com.google.android.gsf/.gservices.GservicesProvider<=Proc{13892:com.google.android.apps.magazines/u0a59}
  Proc # 0: fore  F/A/T  trm: 0 24811:com.android.settings/1000 (top-activity)
  Proc # 4: vis   F/ /IF trm: 0 23472:com.google.process.location/u0a8 (service)
    com.google.android.backup/.BackupTransportService<=Proc{23064:system/1000}
  Proc #14: prcp  F/ /IF trm: 0 23298:com.google.android.inputmethod.latin/u0a57 (service)
    com.google.android.inputmethod.latin/com.android.inputmethod.latin.LatinIME<=Proc{23064:system/1000}
  Proc # 1: home  B/ /HO trm: 0 23395:com.android.launcher/u0a13 (home)
  Proc #16: cch   B/ /CA trm: 0 23966:com.google.android.deskclock/u0a36 (cch-act)
  Proc # 6: cch   B/ /CE trm: 0 7716:com.google.android.music:main/u0a62 (cch-empty)
  Proc # 5: cch   B/ /CE trm: 0 8644:com.google.android.apps.docs/u0a39 (cch-empty)
  Proc # 8: cch+2 B/ /CE trm: 0 5131:com.google.android.youtube/u0a78 (cch-empty)
  Proc # 7: cch+2 B/ /CE trm: 0 23338:com.google.android.gms/u0a8 (cch-empty)
  Proc #10: cch+4 B/ /CE trm: 0 8937:com.google.android.apps.walletnfcrel/u0a24 (cch-empty)
  Proc # 9: cch+4 B/ /CE trm: 0 24689:com.google.android.apps.plus/u0a70 (cch-empty)
  Proc #15: cch+6 B/ /S  trm: 0 23767:com.google.android.apps.currents/u0a35 (cch-started-services)
  Proc #13: cch+6 B/ /CE trm: 0 9115:com.google.android.gm/u0a44 (cch-empty)
  Proc #12: cch+6 B/ /S  trm: 0 7738:android.process.media/u0a6 (cch-started-services)
  Proc #11: cch+6 B/ /CE trm: 0 8922:com.google.android.setupwizard/u0a19 (cch-empty)
Example output of dumpsys activity command, showing all processes currently running.
There are a few major groups of processes here — persistent system processes, the foreground processes, background processes, and finally cached processes — and the category of a process is extremely important for understanding its impact on the system.
At the same time, processes on this list change all of the time. For example, in the snapshot above we can see that “com.google.android.gm” is currently an important process, but that is because it is doing a background sync, something the user would not generally be aware of or want to manage.
Snapshotting per-process RAM use
The traditional use of a task manager is closely tied to RAM use, and Android provides a tool called meminfo for looking at a snapshot of current per-process RAM use. You can access it with the command adb shell dumpsys meminfo. Here's an example of the output.
Total PSS by OOM adjustment:
    31841 kB: Native
               13173 kB: zygote (pid 23001)
                4372 kB: surfaceflinger (pid 23000)
                3721 kB: mediaserver (pid 126)
                3317 kB: glgps (pid 22993)
                1656 kB: drmserver (pid 125)
                 995 kB: wpa_supplicant (pid 23148)
                 786 kB: netd (pid 121)
                 518 kB: sdcard (pid 132)
                 475 kB: vold (pid 119)
                 458 kB: keystore (pid 128)
                 448 kB: /init (pid 1)
                 412 kB: adbd (pid 134)
                 254 kB: ueventd (pid 108)
                 238 kB: dhcpcd (pid 10617)
                 229 kB: tf_daemon (pid 130)
                 200 kB: installd (pid 127)
                 185 kB: dumpsys (pid 14207)
                 144 kB: healthd (pid 117)
                 139 kB: debuggerd (pid 122)
                 121 kB: servicemanager (pid 118)
    48217 kB: System
               48217 kB: system (pid 23064)
    49095 kB: Persistent
               34012 kB: com.android.systemui (pid 23163 / activities)
                7719 kB: com.android.phone (pid 23357)
                4676 kB: com.android.nfc (pid 23371)
                2688 kB: com.nuance.xt9.input (pid 23344)
    24945 kB: Foreground
               24945 kB: com.android.settings (pid 24811 / activities)
    17136 kB: Visible
               14026 kB: com.google.process.location (pid 23472)
                3110 kB: com.android.defcontainer (pid 13976)
     6911 kB: Perceptible
                6911 kB: com.google.android.inputmethod.latin (pid 23298)
    14277 kB: A Services
               14277 kB: com.google.process.gapps (pid 23513)
    26422 kB: Home
               26422 kB: com.android.launcher (pid 23395 / activities)
    21798 kB: B Services
               16242 kB: com.google.android.apps.currents (pid 23767)
                5556 kB: android.process.media (pid 7738)
   145869 kB: Cached
               41588 kB: com.google.android.apps.plus (pid 24689)
               21417 kB: com.google.android.deskclock (pid 23966 / activities)
               14463 kB: com.google.android.apps.docs (pid 8644)
               14303 kB: com.google.android.gm (pid 9115)
               11014 kB: com.google.android.music:main (pid 7716)
               10688 kB: com.google.android.apps.magazines (pid 13892)
               10240 kB: com.google.android.gms (pid 23338)
                9882 kB: com.google.android.youtube (pid 5131)
                8807 kB: com.google.android.apps.walletnfcrel (pid 8937)
                3467 kB: com.google.android.setupwizard (pid 8922)

Total RAM: 998096 kB
 Free RAM: 574945 kB (145869 cached pss + 393200 cached + 35876 free)
 Used RAM: 392334 kB (240642 used pss + 107196 buffers + 3856 shmem + 40640 slab)
 Lost RAM: 30817 kB
   Tuning: 64 (large 384), oom 122880 kB, restore limit 40960 kB (high-end-gfx)
Example output of dumpsys meminfo command, showing memory currently used by running processes.
We are now looking at the same processes as above, again organized by importance, but now with on their impact on RAM use.
Usually when we measure RAM use in Android, we do this with Linux’s PSS (Proportional Set Size) metric. This is the amount of RAM actually mapped into the process, but weighted by the amount it is shared across processes. So if there is a 4K page of RAM mapped in to two processes, its PSS amount for each process would be 2K.
The nice thing about using PSS is that you can add up this value across all processes to determine the actual total RAM use. This characteristic is used at the end of the meminfo report to compute how much RAM is in use (which comes in part from all non-cached processes), versus how much is "free" (which includes cached processes).

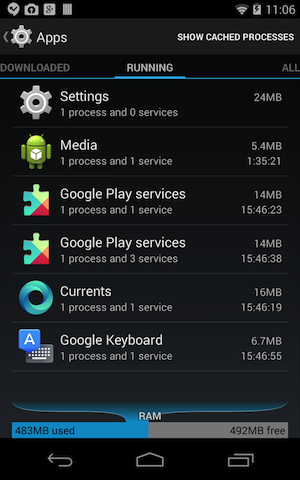
Task-manager style memory info, showing a snapshot of memory used by running apps.
Task manager UI based on PSS snapshot
Given the information we have so far, we can imagine various ways to present this in a somewhat traditional task manager UI. In fact, the UI you see in Settings > Apps > Running is derived from this information. It shows all processes running services (“svc” adjustment in the LRU list) and on behalf of the system (the processes with a “<=Proc{489:system/1000}” dependency), computing the PSS RAM for each of these and any other processes they have dependencies on.
The problem with visualizing memory use in this way is that it gives you the instantaneous state of the apps, without context over time. On Android, users don’t directly control the creation and removal of application processes — they may be kept for future use, removed when the system decides, or run in the background without the user explicitly launching them. So looking only at the instantaneous state of memory use only, you would be missing important information about what is actually going on over time.
For example, in our first look at the process state we see the com.google.android.apps.magazines process running for a sync, but when we collected the RAM use right after that it was no longer running in the background but just being kept around as an old cached process.
To address this problem, the new procstats tool continually monitors the state of all application processes over time, aggregating that information and collecting PSS samples from those processes while doing so. You can view the raw data being collected by procstats with the command adb shell dumpsys procstats.
Seeing memory use over time with procstats
Let’s now go back to procstats and take a look at the context it provides by showing memory use over time. We can use the command adb shell dumpsys procstats --hours 3 to output memory information collected over the last 3 hours. This is the same data as represented graphically in the first Process Stats example.
The output shows all of the processes that have run in the last 3 hours, sorted with the ones running the most first. (Processes in a cached state don’t count for the total time in this sort.) Like the initial graphical representation, we now clearly see a big group of processes that run all of the time, and then some that run occasionally — this includes the Magazines process, which we can now see ran for 3.6% of the time over the last 3 hours.
  * com.google.android.inputmethod.latin / u0a57:
           TOTAL: 100% (6.4MB-6.7MB-6.8MB/5.4MB-5.4MB-5.4MB over 21)
          Imp Fg: 100% (6.4MB-6.7MB-6.8MB/5.4MB-5.4MB-5.4MB over 21)
  * com.google.process.gapps / u0a8:
           TOTAL: 100% (12MB-13MB-14MB/10MB-11MB-12MB over 211)
          Imp Fg: 0.11%
          Imp Bg: 0.83% (13MB-13MB-13MB/11MB-11MB-11MB over 1)
         Service: 99% (12MB-13MB-14MB/10MB-11MB-12MB over 210)
  * com.android.systemui / u0a12:
           TOTAL: 100% (29MB-32MB-34MB/26MB-29MB-30MB over 21)
      Persistent: 100% (29MB-32MB-34MB/26MB-29MB-30MB over 21)
  * com.android.phone / 1001:
           TOTAL: 100% (6.5MB-7.1MB-7.6MB/5.4MB-5.9MB-6.4MB over 21)
      Persistent: 100% (6.5MB-7.1MB-7.6MB/5.4MB-5.9MB-6.4MB over 21)
  * com.nuance.xt9.input / u0a77:
           TOTAL: 100% (2.3MB-2.5MB-2.7MB/1.5MB-1.5MB-1.5MB over 21)
      Persistent: 100% (2.3MB-2.5MB-2.7MB/1.5MB-1.5MB-1.5MB over 21)
  * com.android.nfc / 1027:
           TOTAL: 100% (4.2MB-4.5MB-4.6MB/3.2MB-3.2MB-3.3MB over 21)
      Persistent: 100% (4.2MB-4.5MB-4.6MB/3.2MB-3.2MB-3.3MB over 21)
  * com.google.process.location / u0a8:
           TOTAL: 100% (13MB-13MB-14MB/10MB-11MB-11MB over 21)
          Imp Fg: 100% (13MB-13MB-14MB/10MB-11MB-11MB over 21)
  * system / 1000:
           TOTAL: 100% (42MB-46MB-56MB/39MB-42MB-48MB over 21)
      Persistent: 100% (42MB-46MB-56MB/39MB-42MB-48MB over 21)
  * com.google.android.apps.currents / u0a35:
           TOTAL: 100% (16MB-16MB-16MB/14MB-14MB-14MB over 17)
         Service: 100% (16MB-16MB-16MB/14MB-14MB-14MB over 17)
  * com.android.launcher / u0a13:
           TOTAL: 77% (25MB-26MB-27MB/22MB-23MB-24MB over 73)
             Top: 77% (25MB-26MB-27MB/22MB-23MB-24MB over 73)
          (Home): 23% (25MB-26MB-26MB/23MB-23MB-24MB over 12)
  * android.process.media / u0a6:
           TOTAL: 48% (5.0MB-5.3MB-5.5MB/4.0MB-4.2MB-4.2MB over 11)
          Imp Fg: 0.00%
          Imp Bg: 0.00%
         Service: 48% (5.0MB-5.3MB-5.5MB/4.0MB-4.2MB-4.2MB over 11)
        Receiver: 0.00%
        (Cached): 22% (4.1MB-4.5MB-4.8MB/3.0MB-3.5MB-3.8MB over 8)
  * com.google.android.deskclock / u0a36:
           TOTAL: 42% (20MB-21MB-21MB/18MB-19MB-19MB over 8)
          Imp Fg: 42% (20MB-21MB-21MB/18MB-19MB-19MB over 8)
         Service: 0.00%
        Receiver: 0.01%
        (Cached): 58% (17MB-20MB-21MB/16MB-18MB-19MB over 14)
  * com.android.settings / 1000:
           TOTAL: 23% (19MB-22MB-28MB/15MB-19MB-24MB over 31)
             Top: 23% (19MB-22MB-28MB/15MB-19MB-24MB over 31)
      (Last Act): 77% (9.7MB-14MB-20MB/7.5MB-11MB-18MB over 8)
        (Cached): 0.02%
  * com.google.android.apps.magazines / u0a59:
           TOTAL: 3.6% (10MB-10MB-10MB/8.7MB-9.0MB-9.0MB over 6)
          Imp Bg: 0.03%
         Service: 3.6% (10MB-10MB-10MB/8.7MB-9.0MB-9.0MB over 6)
        (Cached): 17% (9.9MB-10MB-10MB/8.7MB-8.9MB-9.0MB over 5)
  * com.android.defcontainer / u0a5:
           TOTAL: 1.4% (2.7MB-3.0MB-3.0MB/1.9MB-1.9MB-1.9MB over 7)
             Top: 1.2% (3.0MB-3.0MB-3.0MB/1.9MB-1.9MB-1.9MB over 6)
          Imp Fg: 0.19% (2.7MB-2.7MB-2.7MB/1.9MB-1.9MB-1.9MB over 1)
         Service: 0.00%
        (Cached): 15% (2.6MB-2.6MB-2.6MB/1.8MB-1.8MB-1.8MB over 1)
  * com.google.android.youtube / u0a78:
           TOTAL: 1.3% (9.0MB-9.0MB-9.0MB/7.8MB-7.8MB-7.8MB over 1)
          Imp Bg: 1.0% (9.0MB-9.0MB-9.0MB/7.8MB-7.8MB-7.8MB over 1)
         Service: 0.27%
      Service Rs: 0.01%
        Receiver: 0.00%
        (Cached): 99% (9.1MB-9.4MB-9.7MB/7.7MB-7.9MB-8.1MB over 24)
  * com.google.android.gms / u0a8:
           TOTAL: 0.91% (9.2MB-9.2MB-9.2MB/7.6MB-7.6MB-7.6MB over 1)
          Imp Bg: 0.79% (9.2MB-9.2MB-9.2MB/7.6MB-7.6MB-7.6MB over 1)
         Service: 0.11%
        Receiver: 0.00%
        (Cached): 99% (8.2MB-9.4MB-10MB/6.5MB-7.6MB-8.1MB over 25)
  * com.google.android.gm / u0a44:
           TOTAL: 0.56%
          Imp Bg: 0.55%
         Service: 0.01%
        Receiver: 0.00%
        (Cached): 99% (11MB-13MB-14MB/10MB-12MB-13MB over 24)
  * com.google.android.apps.plus / u0a70:
           TOTAL: 0.22%
          Imp Bg: 0.22%
         Service: 0.00%
        Receiver: 0.00%
        (Cached): 100% (38MB-40MB-41MB/36MB-38MB-39MB over 17)
  * com.google.android.apps.docs / u0a39:
           TOTAL: 0.15%
          Imp Bg: 0.09%
         Service: 0.06%
        (Cached): 54% (13MB-14MB-14MB/12MB-12MB-13MB over 17)
  * com.google.android.music:main / u0a62:
           TOTAL: 0.11%
          Imp Bg: 0.04%
         Service: 0.06%
        Receiver: 0.01%
        (Cached): 70% (7.7MB-10MB-11MB/6.4MB-9.0MB-9.3MB over 20)
  * com.google.android.apps.walletnfcrel / u0a24:
           TOTAL: 0.01%
        Receiver: 0.01%
        (Cached): 69% (8.1MB-8.4MB-8.6MB/7.0MB-7.1MB-7.1MB over 13)
  * com.google.android.setupwizard / u0a19:
           TOTAL: 0.00%
        Receiver: 0.00%
        (Cached): 69% (2.7MB-3.2MB-3.4MB/1.8MB-2.0MB-2.2MB over 13)

Run time Stats:
  SOff/Norm: +1h43m29s710ms
  SOn /Norm: +1h37m14s290ms
      TOTAL: +3h20m44s0ms

          Start time: 2013-11-06 07:24:27
  Total elapsed time: +3h42m23s56ms (partial) libdvm.so chromeview
Example output of dumpsys procstats --hours 3 command, showing memory details for processes running in the background over the past ~3 hours.
The percentages tell you how much of the overall time each process has spent in various key states. The memory numbers tell you about memory samples in those states, as minPss-avgPss-maxPss / minUss-avgUss-maxUss. The procstats tool also has a number of command line options to control its output — use adb shell dumpsys procstats -h to see a list of the available options.
Comparing this raw data from procstats with the visualization of its data we previously saw, we can see that it is showing only process run data from a subset of states: Imp Fg, Imp Bg, Service, Service Rs, and Receiver. These are the situations where the process is actively running in the background, for as long as it needs to complete the work it is doing. In terms of device memory use, these are the process states that tend to cause the most trouble: apps running in the background taking RAM from other things.
Getting started with procstats
We have already found the new procstats tool to be invaluable in better understanding the overall memory behavior of Android systems, and it has been a key part of the Project Svelte effort in Android 4.4.
As you develop your own applications, be sure to use procstats and the other tools mentioned here to help understand how your own app is behaving, especially how much it runs in the background and how much RAM it uses during that time.
More information about how to analyze and debug RAM use on Android is available on the developer page Investigating Your RAM Usage.

 Posted by Nick Butcher – Product Manager


.gif)