Tag Archives: TensorFlow

XLA – TensorFlow, compiled

By the XLA team within Google, in collaboration with the TensorFlow team


One of the design goals and core strengths of TensorFlow is its flexibility. TensorFlow was designed to be a flexible and extensible system for defining arbitrary data flow graphs and executing them efficiently in a distributed manner using heterogenous computing devices (such as CPUs and GPUs).


But flexibility is often at odds with performance. While TensorFlow aims to let you define any kind of data flow graph, it’s challenging to make all graphs execute efficiently because TensorFlow optimizes each op separately. When an op with an efficient implementation exists or when each op is a relatively heavyweight operation, all is well; otherwise, the user can still compose this op out of lower-level ops, but this composition is not guaranteed to run in the most efficient way.


This is why we’ve developed XLA (Accelerated Linear Algebra), a compiler for TensorFlow. XLA uses JIT compilation techniques to analyze the TensorFlow graph created by the user at runtime, specialize it for the actual runtime dimensions and types, fuse multiple ops together and emit efficient native machine code for them - for devices like CPUs, GPUs and custom accelerators (e.g. Google’s TPU).


Fusing composable ops for increased performance

Consider the tf.nn.softmax op, for example. It computes the softmax activations of its parameter as follows:

CodeCogsEqn.gif


Softmax can be implemented as a composition of primitive TensorFlow ops (exponent, reduction, elementwise division, etc.):

softmax = exp(logits) / reduce_sum(exp(logits), dim)


This could potentially be slow, due to the extra data movement and materialization of temporary results that aren’t needed outside the op. Moreover, on co-processors like GPUs such a decomposed implementation could result in multiple “kernel launches” that make it even slower.


XLA is the secret compiler sauce that helps TensorFlow optimize compositions of primitive ops automatically. Tensorflow, augmented with XLA, retains flexibility without sacrificing runtime performance, by analyzing the graph at runtime, fusing ops together and producing efficient machine code for the fused subgraphs.


For example, a decomposed implementation of softmax as shown above would be optimized by XLA to be as fast as the hand-optimized compound op.


More generally, XLA can take whole subgraphs of TensorFlow operations and fuse them into efficient loops that require a minimal number of kernel launches. For example:

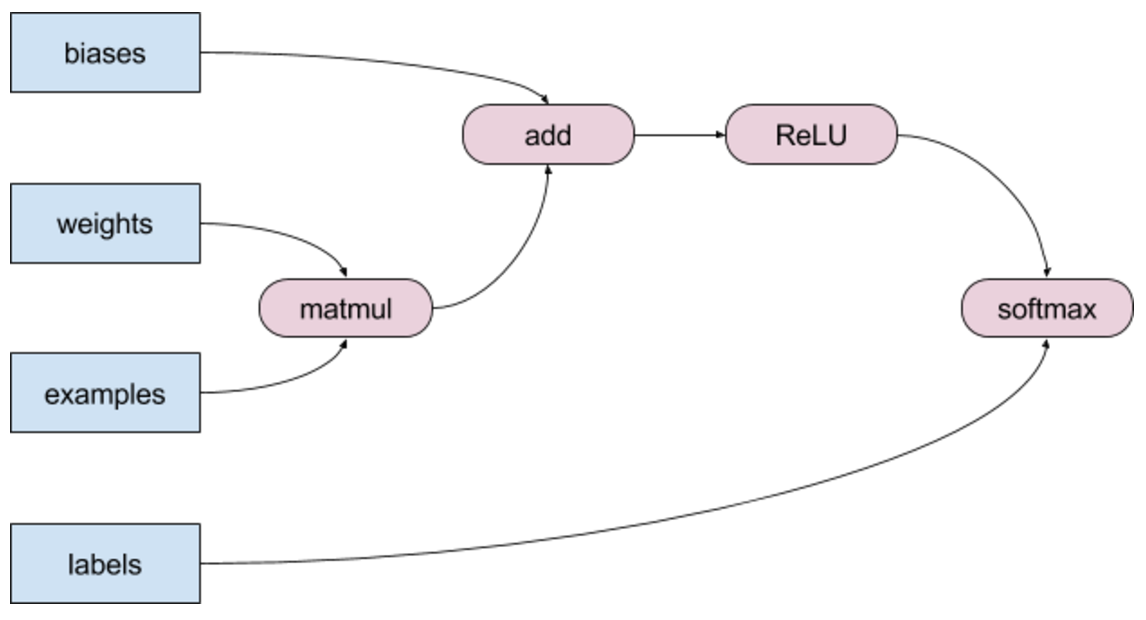
Many of the operations in this graph can be fused into a single element-wise loop. Consider a single element of the bias vector being added to a single element from the matmul result, for example. The result of this addition is a single element that can be compared with 0 (for ReLU). The result of the comparison can be exponentiated and divided by the sum of exponents of all inputs, resulting in the output of softmax. We don’t really need to create the intermediate arrays for matmul, add, and ReLU in memory.


s[j] = softmax[j](ReLU(bias[j] + matmul_result[j]))


A fused implementation can compute the end result within a single element-wise loop, without allocating needless memory. In more advanced scenarios, these operations can even be fused into the matrix multiplication.


XLA helps TensorFlow retain its flexibility while eliminating performance concerns.


On internal benchmarks, XLA shows up to 50% speedups over TensorFlow without XLA on Nvidia GPUs. The biggest speedups come, as expected, in models with long sequences of elementwise operations that can be fused to efficient loops. However, XLA should still be considered experimental, and some benchmarks may experience slowdowns.


In this talk from TensorFlow Developer Summit, Chris Leary and Todd Wang describe how TensorFlow can make use of XLA, JIT, AOT, and other compilation techniques to minimize execution time and maximize computing resources.


Extreme specialization for executable size reduction


In addition to improved performance, TensorFlow models can benefit from XLA for restricted-memory environments (such as mobile devices) due to the executable size reduction it provides. tfcompile is a tool that leverages XLA for ahead-of-time compilation (AOT) - a whole graph is compiled to XLA, which then emits tight machine code that implements the ops in the graph. Coupled with a minimal runtime this scheme provides considerable size reductions.


For example, given a 3-deep, 60-wide stacked LSTM model on android-arm, the original TF model size is 2.6 MB (1 MB runtime + 1.6 MB graph); when compiled with XLA, the size goes down to 600 KB.


This size reduction is achieved by the full specialization of the model implied by its static compilation. When the model runs, the full power and flexibility of the TensorFlow runtime is not required - only the ops implementing the actual graph the user is interested in are compiled to native code. That said, the performance of the code emitted by the CPU backend of XLA is still far from optimal; this part of the project requires more work.

Support for alternative backends and devices


To execute TensorFlow graphs on a new kind of computing device today, one has to re-implement all the TensorFlow ops (kernels) for the new device. Depending on the device, this can be a very significant amount of work.


By design, XLA makes supporting new devices much easier by adding custom backends. Since TensorFlow can target XLA, one can add a new device backend to XLA and thus enable it to run TensorFlow graphs. XLA provides a significantly smaller implementation surface for new devices, since XLA operations are just the primitives (recall that XLA handles the decomposition of complex ops on its own). We’ve documented the process for adding a custom backend to XLA on this page. Google uses this mechanism to target TPUs from XLA.


Conclusion and looking forward


XLA is still in early stages of development. It is showing very promising results for some use cases, and it is clear that TensorFlow can benefit even more from this technology in the future. We decided to release XLA to TensorFlow Github early to solicit contributions from the community and to provide a convenient surface for optimizing TensorFlow for various computing devices, as well as retargeting the TensorFlow runtime and models to run on new kinds of hardware.


Preprocessing for Machine Learning with tf.Transform


When applying machine learning to real world datasets, a lot of effort is required to preprocess data into a format suitable for standard machine learning models, such as neural networks. This preprocessing takes a variety of forms, from converting between formats, to tokenizing and stemming text and forming vocabularies, to performing a variety of numerical operations such as normalization.

Today we are announcing tf.Transform, a library for TensorFlow that allows users to define preprocessing pipelines and run these using large scale data processing frameworks, while also exporting the pipeline in a way that can be run as part of a TensorFlow graph. Users define a pipeline by composing modular Python functions, which tf.Transform then executes with Apache Beam, a framework for large-scale, efficient, distributed data processing. Apache Beam pipelines can be run on Google Cloud Dataflow with planned support for running with other frameworks. The TensorFlow graph exported by tf.Transform enables the preprocessing steps to be replicated when the trained model is used to make predictions, such as when serving the model with Tensorflow Serving.

A common problem encountered when running machine learning models in production is "training-serving skew", where the data seen at serving time differs in some way from the data used to train the model, leading to reduced prediction quality. tf.Transform ensures that no skew can arise during preprocessing, by guaranteeing that the serving-time transformations are exactly the same as those performed at training time, in contrast to when training-time and serving-time preprocessing are implemented separately in two different environments (e.g., Apache Beam and TensorFlow, respectively).

In addition to facilitating preprocessing, tf.Transform allows users to compute summary statistics for their datasets. Understanding the data is very important in every machine learning project, as subtle errors can arise from making wrong assumptions about what the underlying data look like. By making the computation of summary statistics easy and efficient, tf.Transform allows users to check their assumptions about both raw and preprocessed data.
tf.Transform allows users to define a preprocessing pipeline. Users can materialize the preprocessed data for use in TensorFlow training, and also export a tf.Transform graph that encodes the transformations as a TensorFlow graph. This transformation graph can then be incorporated into the model graph used for inference.
We’re excited to be releasing this latest addition to the TensorFlow ecosystem, and we hope users will find it useful for preprocessing and understanding their data.

Acknowledgements
We wish to thank the following members of the tf.Transform team for their contributions to this project: Clemens Mewald, Robert Bradshaw, Rajiv Bharadwaja, Elmer Garduno, Afshin Rostamizadeh, Neoklis Polyzotis, Abhi Rao, Joe Toth, Neda Mirian, Dinesh Kulkarni, Robbie Haertel, Cyril Bortolato and Slaven Bilac. We also wish to thank the TensorFlow, TensorFlow Serving and Cloud Dataflow teams for their support.


Debug TensorFlow Models with tfdbg

Posted by Shanqing Cai, Software Engineer, Tools and Infrastructure.

We are excited to share TensorFlow Debugger (tfdbg), a tool that makes debugging of machine learning models (ML) in TensorFlow easier.
TensorFlow, Google's open-source ML library, is based on dataflow graphs. A typical TensorFlow ML program consists of two separate stages:
  1. Setting up the ML model as a dataflow graph by using the library's Python API,
  2. Training or performing inference on the graph by using the Session.run()method.
If errors and bugs occur during the second stage (i.e., the TensorFlow runtime), they are difficult to debug.

To understand why that is the case, note that to standard Python debuggers, the Session.run() call is effectively a single statement and does not exposes the running graph's internal structure (nodes and their connections) and state (output arrays or tensors of the nodes). Lower-level debuggers such as gdb cannot organize stack frames and variable values in a way relevant to TensorFlow graph operations. A specialized runtime debugger has been among the most frequently raised feature requests from TensorFlow users.

tfdbg addresses this runtime debugging need. Let's see tfdbg in action with a short snippet of code that sets up and runs a simple TensorFlow graph to fit a simple linear equation through gradient descent.

import numpy as np
import tensorflow as tf
import tensorflow.python.debug as tf_debug
xs = np.linspace(-0.5, 0.49, 100)
x = tf.placeholder(tf.float32, shape=[None], name="x")
y = tf.placeholder(tf.float32, shape=[None], name="y")
k = tf.Variable([0.0], name="k")
y_hat = tf.multiply(k, x, name="y_hat")
sse = tf.reduce_sum((y - y_hat) * (y - y_hat), name="sse")
train_op = tf.train.GradientDescentOptimizer(learning_rate=0.02).minimize(sse)

sess = tf.Session()
sess.run(tf.global_variables_initializer())

sess = tf_debug.LocalCLIDebugWrapperSession(sess)
for _ in range(10):
sess.run(train_op, feed_dict={x: xs, y: 42 * xs})

As the highlighted line in this example shows, the session object is wrapped as a class for debugging (LocalCLIDebugWrapperSession), so the calling the run() method will launch the command-line interface (CLI) of tfdbg. Using mouse clicks or commands, you can proceed through the successive run calls, inspect the graph's nodes and their attributes, visualize the complete history of the execution of all relevant nodes in the graph through the list of intermediate tensors. By using the invoke_stepper command, you can let the Session.run() call execute in the "stepper mode", in which you can step to nodes of your choice, observe and modify their outputs, followed by further stepping actions, in a way analogous to debugging procedural languages (e.g., in gdb or pdb).

A class of frequently encountered issue in developing TensorFlow ML models is the appearance of bad numerical values (infinities and NaNs) due to overflow, division by zero, log of zero, etc. In large TensorFlow graphs, finding the source of such nodes can be tedious and time-consuming. With the help of tfdbg CLI and its conditional breakpoint support, you can quickly identify the culprit node. The video below demonstrates how to debug infinity/NaN issues in a neural network with tfdbg:

A screencast of the TensorFlow Debugger in action, from this tutorial.


Compared with alternative debugging options such as Print Ops, tfdbg requires fewer lines of code change, provides more comprehensive coverage of the graphs, and offers a more interactive debugging experience. It will speed up your model development and debugging workflows. It offers additional features such as offline debugging of dumped tensors from server environments and integration with tf.contrib.learn. To get started, please visit this documentation. This research paperlays out the design of tfdbg in greater detail.

The minimum required TensorFlow version for tfdbgis 0.12.1. To report bugs, please open issues on TensorFlow's GitHub Issues Page. For general usage help, please post questions on StackOverflow using the tag tensorflow.
Acknowledgements
This project would not be possible without the help and feedback from members of the Google TensorFlow Core/API Team and the Applied Machine Intelligence Team.


Announcing TensorFlow 1.0

Originally posted on the Google Developer Blog

In just its first year, TensorFlow has helped researchers, engineers, artists, students, and many others make progress with everything from language translation to early detection of skin cancer and preventing blindness in diabetics. We're excited to see people using TensorFlow in over 6000 open source repositories online.

Today, as part of the first annual TensorFlow Developer Summit, hosted in Mountain View and livestreamed around the world, we're announcing TensorFlow 1.0:

It's faster: TensorFlow 1.0 is incredibly fast! XLA lays the groundwork for even more performance improvements in the future, and tensorflow.org now includes tips & tricksfor tuning your models to achieve maximum speed. We'll soon publish updated implementations of several popular models to show how to take full advantage of TensorFlow 1.0 - including a 7.3x speedup on 8 GPUs for Inception v3 and 58x speedup for distributed Inception v3 training on 64 GPUs!

It's more flexible: TensorFlow 1.0 introduces a high-level API for TensorFlow, with tf.layers, tf.metrics, and tf.losses modules. We've also announced the inclusion of a new tf.keras module that provides full compatibility with Keras, another popular high-level neural networks library.

It's more production-ready than ever: TensorFlow 1.0 promises Python API stability (details here), making it easier to pick up new features without worrying about breaking your existing code.

Other highlights from TensorFlow 1.0:
  • Python APIs have been changed to resemble NumPy more closely. For this and other backwards-incompatible changes made to support API stability going forward, please use our handy migration guide and conversion script.
  • Experimental APIs for Javaand Go
  • Higher-level API modules tf.layers, tf.metrics, and tf.losses - brought over from tf.contrib.learnafter incorporating skflowand TF Slim
  • Experimental release of XLA, a domain-specific compiler for TensorFlow graphs, that targets CPUs and GPUs. XLA is rapidly evolving - expect to see more progress in upcoming releases.
  • Introduction of the TensorFlow Debugger (tfdbg), a command-line interface and API for debugging live TensorFlow programs.
  • New Android demos for object detection and localization, and camera-based image stylization.
  • Installation improvements: Python 3 docker images have been added, and TensorFlow's pip packages are now PyPI compliant. This means TensorFlow can now be installed with a simple invocation of pip install tensorflow.
We're thrilled to see the pace of development in the TensorFlow community around the world. To hear more about TensorFlow 1.0 and how it's being used, you can watch the TensorFlow Developer Summit talks on YouTube, covering recent updates from higher-level APIs to TensorFlow on mobile to our new XLA compiler, as well as the exciting ways that TensorFlow is being used:


Click herefor a link to the livestream and video playlist (individual talks will be posted online later in the day).

The TensorFlow ecosystem continues to grow with new techniques like Foldfor dynamic batching and tools like the Embedding Projector along with updatesto our existing tools like TensorFlow Serving. We're incredibly grateful to the community of contributors, educators, and researchers who have made advances in deep learning available to everyone. We look forward to working with you on forums like GitHub issues, Stack Overflow, @TensorFlow, the [email protected]group, and at future events.

By Amy McDonald Sandjideh, Technical Program Manager, TensorFlow

Announcing TensorFlow 1.0

Posted By: Amy McDonald Sandjideh, Technical Program Manager, TensorFlow

In just its first year, TensorFlow has helped researchers, engineers, artists, students, and many others make progress with everything from language translation to early detection of skin cancer and preventing blindness in diabetics. We're excited to see people using TensorFlow in over 6000 open-source repositories online.


Today, as part of the first annual TensorFlow Developer Summit, hosted in Mountain View and livestreamed around the world, we're announcing TensorFlow 1.0:


It's faster: TensorFlow 1.0 is incredibly fast! XLA lays the groundwork for even more performance improvements in the future, and tensorflow.org now includes tips & tricksfor tuning your models to achieve maximum speed. We'll soon publish updated implementations of several popular models to show how to take full advantage of TensorFlow 1.0 - including a 7.3x speedup on 8 GPUs for Inception v3 and 58x speedup for distributed Inception v3 training on 64 GPUs!


It's more flexible: TensorFlow 1.0 introduces a high-level API for TensorFlow, with tf.layers, tf.metrics, and tf.losses modules. We've also announced the inclusion of a new tf.keras module that provides full compatibility with Keras, another popular high-level neural networks library.


It's more production-ready than ever: TensorFlow 1.0 promises Python API stability (details here), making it easier to pick up new features without worrying about breaking your existing code.

Other highlights from TensorFlow 1.0:

  • Python APIs have been changed to resemble NumPy more closely. For this and other backwards-incompatible changes made to support API stability going forward, please use our handy migration guide and conversion script.
  • Experimental APIs for Javaand Go
  • Higher-level API modules tf.layers, tf.metrics, and tf.losses - brought over from tf.contrib.learnafter incorporating skflowand TF Slim
  • Experimental release of XLA, a domain-specific compiler for TensorFlow graphs, that targets CPUs and GPUs. XLA is rapidly evolving - expect to see more progress in upcoming releases.
  • Introduction of the TensorFlow Debugger (tfdbg), a command-line interface and API for debugging live TensorFlow programs.
  • New Android demos for object detection and localization, and camera-based image stylization.
  • Installation improvements: Python 3 docker images have been added, and TensorFlow's pip packages are now PyPI compliant. This means TensorFlow can now be installed with a simple invocation of pip install tensorflow.

We're thrilled to see the pace of development in the TensorFlow community around the world. To hear more about TensorFlow 1.0 and how it's being used, you can watch the TensorFlow Developer Summit talks on YouTube, covering recent updates from higher-level APIs to TensorFlow on mobile to our new XLA compiler, as well as the exciting ways that TensorFlow is being used:


Click herefor a link to the livestream and video playlist (individual talks will be posted online later in the day).


The TensorFlow ecosystem continues to grow with new techniques like Foldfor dynamic batching and tools like the Embedding Projector along with updates to our existing tools like TensorFlow Serving. We're incredibly grateful to the community of contributors, educators, and researchers who have made advances in deep learning available to everyone. We look forward to working with you on forums like GitHub issues, Stack Overflow, @TensorFlow, the [email protected]group, and at future events.


Announcing TensorFlow 1.0


In just its first year, TensorFlow has helped researchers, engineers, artists, students, and many others make progress with everything from language translation to early detection of skin cancer and preventing blindness in diabetics. We’re excited to see people using TensorFlow in over 6000 open-source repositories online.

Today, as part of the first annual TensorFlow Developer Summit, hosted in Mountain View and livestreamed around the world, we’re announcing TensorFlow 1.0:

It’s faster: TensorFlow 1.0 is incredibly fast! XLA lays the groundwork for even more performance improvements in the future, and tensorflow.org now includes tips & tricks for tuning your models to achieve maximum speed. We’ll soon publish updated implementations of several popular models to show how to take full advantage of TensorFlow 1.0 - including a 7.3x speedup on 8 GPUs for Inception v3 and 58x speedup for distributed Inception v3 training on 64 GPUs!

It’s more flexible: TensorFlow 1.0 introduces a high-level API for TensorFlow, with tf.layers, tf.metrics, and tf.losses modules. We’ve also announced the inclusion of a new tf.keras module that provides full compatibility with Keras, another popular high-level neural networks library.

It’s more production-ready than ever: TensorFlow 1.0 promises Python API stability (details here), making it easier to pick up new features without worrying about breaking your existing code.

Other highlights from TensorFlow 1.0:
  • Python APIs have been changed to resemble NumPy more closely. For this and other backwards-incompatible changes made to support API stability going forward, please use our handy migration guide and conversion script.
  • Experimental APIs for Java and Go
  • Higher-level API modules tf.layers, tf.metrics, and tf.losses - brought over from tf.contrib.learn after incorporating skflow and TF Slim
  • Experimental release of XLA, a domain-specific compiler for TensorFlow graphs, that targets CPUs and GPUs. XLA is rapidly evolving - expect to see more progress in upcoming releases.
  • Introduction of the TensorFlow Debugger (tfdbg), a command-line interface and API for debugging live TensorFlow programs.
  • New Android demos for object detection and localization, and camera-based image stylization.
  • Installation improvements: Python 3 docker images have been added, and TensorFlow’s pip packages are now PyPI compliant. This means TensorFlow can now be installed with a simple invocation of pip install tensorflow.
We’re thrilled to see the pace of development in the TensorFlow community around the world. To hear more about TensorFlow 1.0 and how it’s being used, you can watch the TensorFlow Developer Summit talks on YouTube, covering recent updates from higher-level APIs to TensorFlow on mobile to our new XLA compiler, as well as the exciting ways that TensorFlow is being used:


Click here for a link to the livestream and video playlist (individual talks will be posted online later in the day).

The TensorFlow ecosystem continues to grow with new techniques like Fold for dynamic batching and tools like the Embedding Projector along with updates to our existing tools like TensorFlow Serving. We’re incredibly grateful to the community of contributors, educators, and researchers who have made advances in deep learning available to everyone. We look forward to working with you on forums like GitHub issues, Stack Overflow, @TensorFlow, the [email protected] group and at future events.

Android Things Developer Preview 2


Posted by Wayne Piekarski, Developer Advocate for IoT

Today we are releasing Developer Preview 2 (DP2) for Android Things, bringing new features and bug fixes to the platform. We are committed to providing regular updates to developers, and aim to have new preview releases approximately every 6-8 weeks. Android Things is a comprehensive solution to building Internet of Things (IoT) products with the power of Android. Now any Android developer can quickly build a smart device using Android APIs and Google services, while staying highly secure with updates direct from Google. It includes familiar tools such as Android Studio, the Android Software Development Kit (SDK), Google Play Services, and Google Cloud Platform. Android Things supports a System-on-Module (SoM) architecture, where a core computing module can be initially used with development boards and then easily scaled to large production runs with custom designs, while continuing to use the same Board Support Package (BSP) from Google.
New features and bug fixes
Thanks to great developer feedback from our Developer Preview 1, we have now added support for USB Audio to the Hardware Abstraction Layer (HAL) for Intel Edison and Raspberry Pi 3. NXP Pico already contains direct support for audio on device. We have also resolved many bugs related to Peripheral I/O (PIO). Other feature requests such as Bluetooth support are known issues, and the team is actively working to fix these. We have added support for the Intel Joule platform, which offers the most computing power in our lineup to date.
Native I/O and user drivers
There are many developers who use native C or C++ code to develop IoT software, and Android Things supports the standard Android NDK. We have now released a library to provide native access to the Peripheral API (PIO), so developers can easily use their existing native code. The documentation explains the new API, and the sample provides a demonstration of how to use it.
An important new feature that was made available with Android Things DP1 was support for user drivers. Developers can create a user driver in their APK, and then bind it to the framework. For example, your driver code could read a GPIO pin and trigger a regular Android KeyEvent, or read in an external GPS via a serial port and feed this into the Android location APIs. This allows any application to inject hardware events into the framework, without customizing the Linux kernel or HAL. We maintain a repository of user drivers for a variety of common hardware interfaces such as sensors, buttons, and displays. Developers are also able to create their own drivers and share them with the community.
TensorFlow for Android Things
One of the most interesting features of Android Things is the ability to easily deploy machine learning and computer vision. We have created a highly requested sample that shows how to use TensorFlow on Android Things devices. This sample demonstrates accessing the camera, performing object recognition and image classification, and speaking out the results using text-to-speech (TTS). An early-access TensorFlow inference library prebuilt for ARM and x86 is provided for you to easily add TensorFlow to any Android app with just a single line in your build.gradle file.


TensorFlow sample identifying a dog's breed (American Staffordshire terrier) 
on a Raspberry Pi 3 with camera

Feedback
Thank you to all the developers who submitted feedback for the previous developer preview. Please continue to send us your feedback by filing bug reports and feature requests, and ask any questions on stackoverflow. To download images for Developer Preview 2, visit the Android Things download page, and find the changes in the release notes. You can also join Google's IoT Developers Community on Google+, a great resource to keep up to date and discuss ideas, with over 2900 new members.


Announcing TensorFlow Fold: Deep Learning With Dynamic Computation Graphs


In much of machine learning, data used for training and inference undergoes a preprocessing step, where multiple inputs (such as images) are scaled to the same dimensions and stacked into batches. This lets high-performance deep learning libraries like TensorFlow run the same computation graph across all the inputs in the batch in parallel. Batching exploits the SIMD capabilities of modern GPUs and multi-core CPUs to speed up execution. However, there are many problem domains where the size and structure of the input data varies, such as parse trees in natural language understanding, abstract syntax trees in source code, DOM trees for web pages and more. In these cases, the different inputs have different computation graphs that don't naturally batch together, resulting in poor processor, memory, and cache utilization.

Today we are releasing TensorFlow Fold to address these challenges. TensorFlow Fold makes it easy to implement deep-learning models that operate over data of varying size and structure. Furthermore, TensorFlow Fold brings the benefits of batching to such models, resulting in a speedup of more than 10x on CPU, and more than 100x on GPU, over alternative implementations. This is made possible by dynamic batching, introduced in our paper Deep Learning with Dynamic Computation Graphs.
This animation shows a recursive neural network run with dynamic batching. Operations with the same color are batched together, which lets TensorFlow run them faster. The Embed operation converts words to vector representations. The fully connected (FC) operation combines word vectors to form vector representations of phrases. The output of the network is a vector representation of an entire sentence. Although only a single parse tree of a sentence is shown, the same network can run, and batch together operations, over multiple parse trees of arbitrary shapes and sizes.
The TensorFlow Fold library will initially build a separate computation graph from each input.
Because the individual inputs may have different sizes and structures, the computation graphs may as well. Dynamic batching then automatically combines these graphs to take advantage of opportunities for batching, both within and across inputs, and inserts additional instructions to move data between the batched operations (see our paper for technical details).

To learn more, head over to our github site. We hope that TensorFlow Fold will be useful for researchers and practitioners implementing neural networks with dynamic computation graphs in TensorFlow.

Acknowledgements
This work was done under the supervision of Peter Norvig.

Open sourcing the Embedding Projector: a tool for visualizing high dimensional data

Originally posted on the Google Research Blog

Recent advances in machine learning (ML) have shown impressive results, with applications ranging from image recognition, language translation, medical diagnosis and more. With the widespread adoption of ML systems, it is increasingly important for research scientists to be able to explore how the data is being interpreted by the models. However, one of the main challenges in exploring this data is that it often has hundreds or even thousands of dimensions, requiring special tools to investigate the space.

To enable a more intuitive exploration process, we are open-sourcing the Embedding Projector, a web application for interactive visualization and analysis of high-dimensional data recently shown as an A.I. Experiment, as part of TensorFlow. We are also releasing a standalone version at projector.tensorflow.org, where users can visualize their high-dimensional data without the need to install and run TensorFlow.


Exploring Embeddings

The data needed to train machine learning systems comes in a form that computers don't immediately understand. To translate the things we understand naturally (e.g. words, sounds, or videos) to a form that the algorithms can process, we use embeddings, a mathematical vector representation that captures different facets (dimensions) of the data. For example, in this language embedding, similar words are mapped to points that are close to each other.

With the Embedding Projector, you can navigate through views of data in either a 2D or a 3D mode, zooming, rotating, and panning using natural click-and-drag gestures. Below is a figure showing the nearest points to the embedding for the word “important” after training a TensorFlow model using the word2vec tutorial. Clicking on any point (which represents the learned embedding for a given word) in this visualization, brings up a list of nearest points and distances, which shows which words the algorithm has learned to be semantically related. This type of interaction represents an important way in which one can explore how an algorithm is performing.


Methods of Dimensionality Reduction

The Embedding Projector offers three commonly used methods of data dimensionality reduction, which allow easier visualization of complex data: PCA, t-SNE and custom linear projections. PCA is often effective at exploring the internal structure of the embeddings, revealing the most influential dimensions in the data. t-SNE, on the other hand, is useful for exploring local neighborhoods and finding clusters, allowing developers to make sure that an embedding preserves the meaning in the data (e.g. in the MNIST dataset, seeing that the same digits are clustered together). Finally, custom linear projections can help discover meaningful "directions" in data sets - such as the distinction between a formal and casual tone in a language generation model - which would allow the design of more adaptable ML systems.

A custom linear projection of the 100 nearest points of "See attachments." onto the "yes" - "yeah" vector (“yes” is right, “yeah” is left) of a corpus of 35k frequently used phrases in emails
The Embedding Projector website includes a few datasets to play with. We’ve also made it easy for users to publish and share their embeddings with others (just click on the “Publish” button on the left pane). It is our hope that the Embedding Projector will be a useful tool to help the research community explore and refine their ML applications, as well as enable anyone to better understand how ML algorithms interpret data. If you'd like to get the full details on the Embedding Projector, you can read the paper here. Have fun exploring the world of embeddings!

By Daniel Smilkov and the Big Picture group

Open sourcing the Embedding Projector: a tool for visualizing high dimensional data


Recent advances in Machine Learning (ML) have shown impressive results, with applications ranging from image recognition, language translation, medical diagnosis and more. With the widespread adoption of ML systems, it is increasingly important for research scientists to be able to explore how the data is being interpreted by the models. However, one of the main challenges in exploring this data is that it often has hundreds or even thousands of dimensions, requiring special tools to investigate the space.

To enable a more intuitive exploration process, we are open-sourcing the Embedding Projector, a web application for interactive visualization and analysis of high-dimensional data recently shown as an A.I. Experiment, as part of TensorFlow. We are also releasing a standalone version at projector.tensorflow.org, where users can visualize their high-dimensional data without the need to install and run TensorFlow.


Exploring Embeddings

The data needed to train machine learning systems comes in a form that computers don't immediately understand. To translate the things we understand naturally (e.g. words, sounds, or videos) to a form that the algorithms can process, we use embeddings, a mathematical vector representation that captures different facets (dimensions) of the data. For example, in this language embedding, similar words are mapped to points that are close to each other.

With the Embedding Projector, you can navigate through views of data in either a 2D or a 3D mode, zooming, rotating, and panning using natural click-and-drag gestures. Below is a figure showing the nearest points to the embedding for the word “important” after training a TensorFlow model using the word2vec tutorial. Clicking on any point (which represents the learned embedding for a given word) in this visualization, brings up a list of nearest points and distances, which shows which words the algorithm has learned to be semantically related. This type of interaction represents an important way in which one can explore how an algorithm is performing.


Methods of Dimensionality Reduction

The Embedding Projector offers three commonly used methods of data dimensionality reduction, which allow easier visualization of complex data: PCA, t-SNE and custom linear projections. PCA is often effective at exploring the internal structure of the embeddings, revealing the most influential dimensions in the data. t-SNE, on the other hand, is useful for exploring local neighborhoods and finding clusters, allowing developers to make sure that an embedding preserves the meaning in the data (e.g. in the MNIST dataset, seeing that the same digits are clustered together). Finally, custom linear projections can help discover meaningful "directions" in data sets - such as the distinction between a formal and casual tone in a language generation model - which would allow the design of more adaptable ML systems.
A custom linear projection of the 100 nearest points of "See attachments." onto the "yes" - "yeah" vector (“yes” is right, “yeah” is left) of a corpus of 35k frequently used phrases in emails
The Embedding Projector website includes a few datasets to play with. We’ve also made it easy for users to publish and share their embeddings with others (just click on the “Publish” button on the left pane). It is our hope that the Embedding Projector will be a useful tool to help the research community explore and refine their ML applications, as well as enable anyone to better understand how ML algorithms interpret data. Have fun exploring the world of embeddings!