Tag Archives: Physics

Formation of Robust Bound States of Interacting Photons

When quantum computers were first proposed, they were hoped to be a way to better understand the quantum world. With a so-called “quantum simulator,” one could engineer a quantum computer to investigate how various quantum phenomena arise, including those that are intractable to simulate with a classical computer.

But making a useful quantum simulator has been a challenge. Until now, quantum simulations with superconducting qubits have predominantly been used to verify pre-existing theoretical predictions and have rarely explored or discovered new phenomena. Only a few experiments with trapped ions or cold atoms have revealed new insights. Superconducting qubits, even though they are one of the main candidates for universal quantum computing and have demonstrated computational capabilities beyond classical reach, have so far not delivered on their potential for discovery.

In “Formation of Robust Bound States of Interacting Photons”, published in Nature, we describe a previously unpredicted phenomenon first discovered through experimental investigation. First, we present the experimental confirmation of the theoretical prediction of the existence of a composite particle of interacting photons, or a bound state, using the Google Sycamore quantum processor. Second, while studying this system, we discovered that even though one might guess the bound states to be fragile, they remain robust to perturbations that we expected to have otherwise destroyed them. Not only does this open the possibility of designing systems that leverage interactions between photons, it also marks a step forward in the use of superconducting quantum processors to make new scientific discoveries by simulating non-equilibrium quantum dynamics.


Overview

Photons, or quanta of electromagnetic radiation like light and microwaves, typically don’t interact. For example, two intersecting flashlight beams will pass through one another undisturbed. In many applications, like telecommunications, the weak interactions of photons is a valuable feature. For other applications, such as computers based on light, the lack of interactions between photons is a shortcoming.

In a quantum processor, the qubits host microwave photons, which can be made to interact through two-qubit operations. This allows us to simulate the XXZ model, which describes the behavior of interacting photons. Importantly, this is one of the few examples of integrable models, i.e., one with a high degree of symmetry, which greatly reduces its complexity. When we implement the XXZ model on the Sycamore processor, we observe something striking: the interactions force the photons into bundles known as bound states.

Using this well-understood model as a starting point, we then push the study into a less-understood regime. We break the high level of symmetries displayed in the XXZ model by adding extra sites that can be occupied by the photons, making the system no longer integrable. While this nonintegrable regime is expected to exhibit chaotic behavior where bound states dissolve into their usual, solitary selves, we instead find that they survive!


Bound Photons

To engineer a system that can support the formation of bound states, we study a ring of superconducting qubits that host microwave photons. If a photon is present, the value of the qubit is “1”, and if not, the value is “0”. Through the so-called “fSim” quantum gate, we connect neighboring sites, allowing the photons to hop around and interact with other photons on the nearest-neighboring sites.

Superconducting qubits can be occupied or unoccupied with microwave photons. The “fSim” gate operation allows photons to hop and interact with each other. The corresponding unitary evolution has a hopping term between two sites (orange) and an interaction term corresponding to an added phase when two adjacent sites are occupied by a photon.
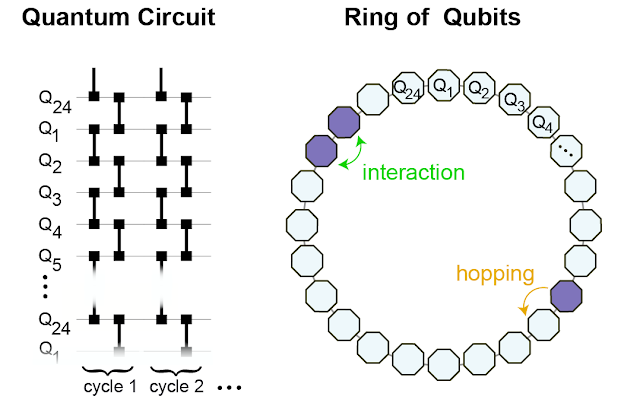
We implement the fSim gate between neighboring qubits (left) to effectively form a ring of 24 interconnected qubits on which we simulate the behavior of the interacting photons (right).

The interactions between the photons affect their so-called “phase.” This phase keeps track of the oscillation of the photon’s wavefunction. When the photons are non-interacting, their phase accumulation is rather uninteresting. Like a well-rehearsed choir, they’re all in sync with one another. In this case, a photon that was initially next to another photon can hop away from its neighbor without getting out of sync. Just as every person in the choir contributes to the song, every possible path the photon can take contributes to the photon’s overall wavefunction. A group of photons initially clustered on neighboring sites will evolve into a superposition of all possible paths each photon might have taken.

When photons interact with their neighbors, this is no longer the case. If one photon hops away from its neighbor, its rate of phase accumulation changes, becoming out of sync with its neighbors. All paths in which the photons split apart overlap, leading to destructive interference. It would be like each choir member singing at their own pace — the song itself gets washed out, becoming impossible to discern through the din of the individual singers. Among all the possible configuration paths, the only possible scenario that survives is the configuration in which all photons remain clustered together in a bound state. This is why interaction can enhance and lead to the formation of a bound state: by suppressing all other possibilities in which photons are not bound together.

Left: Evolution of interacting photons forming a bound state. Right: Time goes from left to right, each path represents one of the paths that can break the 2-photon bonded state. Due to interactions, these paths interfere destructively, preventing the photons from splitting apart.
Occupation probability versus gate cycle, or discrete time step, for n-photon bound states. We prepare bound states of varying sizes and watch them evolve. We observe that the majority of the photons (darker colors) remain bound together.

In our processor, we start by putting two to five photons on adjacent sites (i.e., initializing two to five adjacent qubits in “1”, and the remaining qubits in “0”), and then study how they propagate. First, we notice that in the theoretically predicted parameter regime, they remain stuck together. Next, we find that the larger bound states move more slowly around the ring, consistent with the fact that they are “heavier”. This can be seen in the plot above where the lattice sites closest to Site 12, the initial position of the photons, remain darker than the others with increasing number of photons (nph) in the bound state, indicating that with more photons bound together there is less propagation around the ring.


Bound States Behave Like Single Composite Particles

To more rigorously show that the bound states indeed behave as single particles with well-defined physical properties, we devise a method to measure how the energy of the particles changes with momentum, i.e., the energy-momentum dispersion relation.

To measure the energy of the bound state, we use the fact that the energy difference between two states determines how fast their relative phase grows with time. Hence, we prepare the bound state in a superposition with the state that has no photons, and measure their phase difference as a function of time and space. Then, to convert the result of this measurement to a dispersion relation, we utilize a Fourier transform, which translates position and time into momentum and energy, respectively. We’re left with the familiar energy-momentum relationship of excitations in a lattice.

Spectroscopy of bound states. We compare the phase accumulation of an n-photon bound state with that of the vacuum (no photons) as a function of lattice site and time. A 2D Fourier transform yields the dispersion relation of the bound-state quasiparticle.

Breaking Integrability

The above system is “integrable,” meaning that it has a sufficient number of conserved quantities that its dynamics are constrained to a small part of the available computational space. In such integrable regimes, the appearance of bound states is not that surprising. In fact, bound states in similar systems were predicted in 2012, then observed in 2013. However, these bound states are fragile and their existence is usually thought to derive from integrability. For more complex systems, there is less symmetry and integrability is quickly lost. Our initial idea was to probe how these bound states disappear as we break integrability to better understand their rigidity.

To break integrability, we modify which qubits are connected with fSim gates. We add qubits so that at alternating sites, in addition to hopping to each of its two nearest-neighboring sites, a photon can also hop to a third site oriented radially outward from the ring.

While a bound state is constrained to a very small part of phase space, we expected that the chaotic behavior associated with integrability breaking would allow the system to explore the phase space more freely. This would cause the bound states to break apart. We find that this is not the case. Even when the integrability breaking is so strong that the photons are equally likely to hop to the third site as they are to hop to either of the two adjacent ring sites, the bound state remains intact, up to the decoherence effect that makes them slowly decay (see paper for details).

Top: New geometry to break integrability. Alternating sites are connected to a third site oriented radially outward. This increases the complexity of the system, and allows for potentially chaotic behavior. Bottom: Despite this added complexity pushing the system beyond integrability, we find that the 3-photon bound state remains stable even for a relatively large perturbation. The probability of remaining bound decreases slowly due to decoherence (see paper).

Conclusion

We don’t yet have a satisfying explanation for this unexpected resilience. We speculate that it may be related to a phenomenon called prethermalization, where incommensurate energy scales in the system can prevent a system from reaching thermal equilibrium as quickly as it otherwise would. We believe further investigations will hopefully lead to new insights into many-body quantum physics, including the interplay of prethermalization and integrability.


Acknowledgements

We would like to thank our Quantum Science Communicator Katherine McCormick for her help writing this blog post.

Source: Google AI Blog


Finding Complex Metal Oxides for Technology Advancement

A crystalline material has atoms systematically arranged in repeating units, with this structure and the elements it contains determining the material’s properties. For example, silicon’s crystal structure allows it to be widely used in the semiconductor industry, whereas graphite’s soft, layered structure makes for great pencils. One class of crystalline materials that are critical for a wide range of applications, ranging from battery technology to electrolysis of water (i.e., splitting H2O into its component hydrogen and oxygen), are crystalline metal oxides, which have repeating units of oxygen and metals. Researchers suspect that there is a significant number of crystalline metal oxides that could prove to be useful, but their number and the extent of their useful properties is unknown.

In “Discovery of complex oxides via automated experiments and data science”, a collaborative effort with partners at the Joint Center for Artificial Photosynthesis (JCAP), a Department of Energy (DOE) Energy Innovation Hub at Caltech, we present a systematic search for new complex crystalline metal oxides using a novel approach for rapid materials synthesis and characterization. Using a customized inkjet printer to print samples with different ratios of metals, we were able to generate more than 350k distinct compositions, a number of which we discovered had interesting properties. One example, based on cobalt, tantalum and tin, exhibited tunable transparency, catalytic activity, and stability in strong acid electrolytes, a rare combination of properties of importance for renewable energy technologies. To stimulate continued research in this field, we are releasing a database consisting of nine channels of optical absorption measurements, which can be used as an indicator of interesting properties, across 376,752 distinct compositions of 108 3-metal oxide systems, along with model results that identify the most promising compositions for a variety of technical applications.

Background
There are on the order of 100 properties of interest in materials science that are relevant to enhancing existing technologies and to creating new ones, ranging from electrical, optical, and magnetic to thermal and mechanical. Traditionally, exploring materials for a target technology involves considering only one or a few such properties at a time, resulting in many parallel efforts where the same materials are being evaluated. Machine learning (ML) for material properties prediction has been successfully deployed in many of these parallel efforts, but the models are inherently specialized and fail to capture the universality of the prediction problem. Instead of asking traditional questions of how ML can help find a suitable material for a particular property, we instead apply ML to find a short-list of materials that may be exceptional for any given property. This strategy combines high throughput materials experiments with a physics-aware data science workflow.

A challenge in realizing this strategy is that the search space for new crystalline metal oxides is enormous. For example, the Inorganic Crystal Structure Database (ICSD) lists 73 metals that exist in oxides composed of a single metal and oxygen. Generating novel compounds simply by making various combinations of these metals would yield 62,196 possible 3-metal oxide systems, some of which will contain several unique structures. If, in addition, one were to vary the relative quantities of each metal, the set of possible combinations would be orders of magnitude larger.

However, while this search space is large, only a small fraction of these novel compositions will form new crystalline structures, with the majority simply resulting in combinations of existing structures. While these combinations of structures may be interesting for some applications, the goal is to find the core single-structure compositions. Of the possible 3-metal oxide systems, the ICSD reports only 2,205 with experimentally confirmed compositions, indicating that the vast majority of possible compositions either have not been explored or have yielded negative results and have not been published. In the present work we do not directly measure the crystal structures of new materials, but instead use high throughput experiments to enable ML-based inferences of where new structures can be found.

Synthesis
Our goal was to explore a large swath of chemical space as quickly as possible. Whereas traditional synthesis techniques like physical vapor deposition can create high quality thin films, we decided to reuse an existing technology that was already optimized to mix and deposit small amounts of material very quickly: an inkjet printer. We made each metal element printable by dissolving a metal nitrate or metal chloride into an ink solution. We then printed a series of lines on glass plates, where the ratios of the elements used in the printing varied along each line according to our experiment design so that we could generate thousands of unique compositions per plate. Several such plates were then dried and baked together in a series of ovens to oxidize the metals. Due to the inherent variability in the printing, drying, and baking of the plates, we opted to print 10 duplicates of each composition. Even with this level of replication, we still were able to generate novel compositions 100x faster than traditional vapor deposition techniques.

The modified professional grade inkjet printer.
Top: A printed and baked plate that is 10 x 15 cm. Bottom: A close-up of a portion of the plate. Since the optical properties vary with composition, the gradient in composition appears as a color gradient along each line.

Characterization
When making samples at this rate, it is hard to find a characterization technique that can keep up. A traditional approach to design a material for a specific purpose would require significant time to measure the pertinent properties of each combination, but for the analysis to keep up with our high-throughput printing method, we needed something faster. So, we built a custom microscope capable of taking pictures at nine discrete wavelengths ranging from the ultraviolet (385 nm), through the visible, to the infrared (850 nm). This microscope produced over 20 TB of image data over the course of the project, which we used to calculate the optical absorption coefficients of each sample at each wavelength. While optical absorption itself is important for technologies such as solar energy harvesting, in our work we are interested in optical absorption vs. wavelength as a fingerprint of each material.

Analysis
After generating 376,752 distinct compositions, we needed to know which ones were actually interesting. We hypothesized that since the structure of a material determines its properties, when a material property (in this case, the optical absorption spectrum) changes in a nontrivial way, that could indicate a structural change. To test this, we built two ML models to identify potentially interesting compositions.

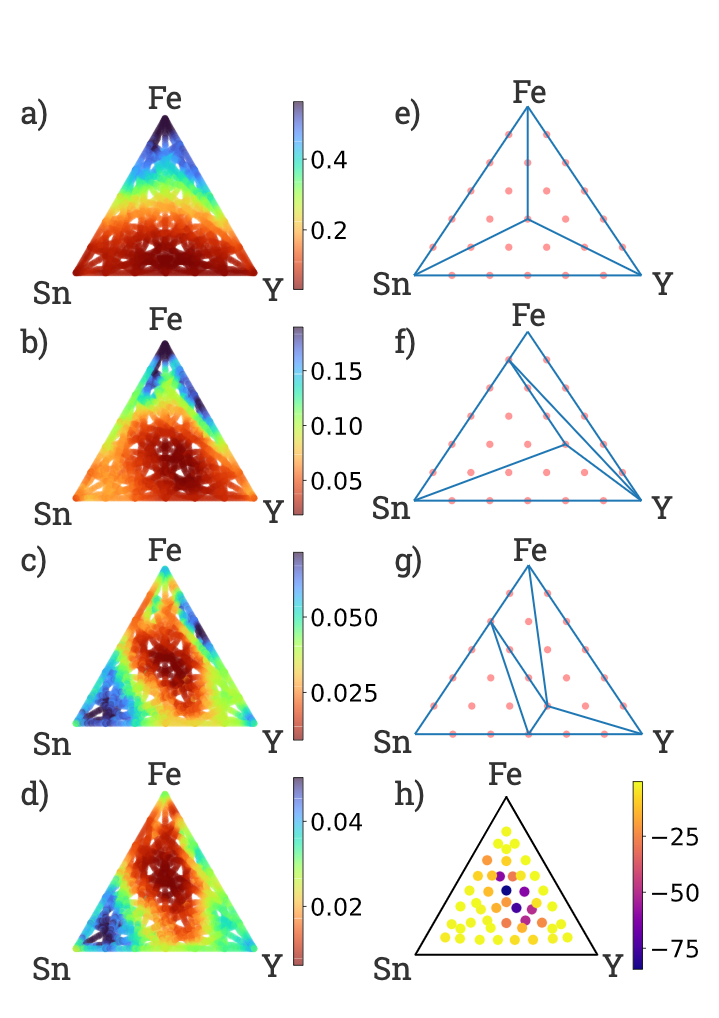
As the composition of metals changes in a metal oxide, the crystal structure of the resulting material may change. The map of the compositions that crystallize into the same structure, which we call the phase, is the “phase diagram”. The first model, the ‘phase diagram’ model, is a physics-based model that assumes thermodynamic equilibrium, which imposes limits on the number of phases that can coexist. Assuming that the optical properties of a combination of crystalline phases vary linearly with the ratio of each crystalline phase, the model generates a set of phases that best fit the optical absorption spectra. The phase diagram model involved a comprehensive search through the space of thermodynamically allowed phase diagrams. The second model seeks to identify “emergent properties” by identifying 3-metal oxide absorption spectra that can not be explained by a linear combination of 1-metal or 2-metal oxide signals.

Phase analysis of compounds with different relative fractions of the metals iron (Fe), tin (Sn) and yttrium (Y). Left: Panels showing the absorption coefficient at different wavelengths: a) 375 nm; b) 530 nm; c) 660 nm, d) 850 nm. Right: Based on the absorption, the phase diagram model identifies the boundaries at which changes in the relative composition in the compound lead to different optical properties and hence suggest compositions with potentially interesting behavior. In panels e), f) and g), red points are candidate phases, and vertices where blue lines meet indicate interesting phase behavior. Panel h) shows the emergent property model, where compositions are colored by the log-likelihood of their properties being explainable by lower-order compositions (darker colors are more likely to represent more interesting compounds).

Experimental Verification
In the end our systematic, combinatorial sweep of 108 3-metal oxide systems found 51 of these systems exhibited interesting behavior. Of these 108 systems, only 1 of them has an experimentally reported entry in the ICSD. We performed an in-depth experimental study of one unexplored system, the Co-Ta-Sn oxides. With guidance from the high throughput workflow, we validated the discovery of a new family of solid solutions by x-ray diffraction, successfully resynthesized the new materials using a common technique (physical vapor deposition), validated the surprisingly high transparency in compositions with up to 30% Co, and performed follow-up electrochemical testing that demonstrated electrocatalytic activity for water oxidation (a critical step in hydrogen fuel synthesis from water). Catalyst testing for water oxidation is far more expensive than the optical screening from our high throughput workflow, and even though there is no known connection between the optical properties and the catalytic properties, we use the analysis of optical properties to select a small number of compositions for catalyst testing, demonstrating our high level concept of using one high throughput workflow to down-select materials for practically any target technology.

Conclusions
The Co-Ta-Sn oxide example illustrates how finding new materials quickly is an important step in developing improved technologies, such as those critical for hydrogen production. We hope this work inspires the materials community — for the experimentalists, we hope to inspire creativity in aggressively scaling high-throughput techniques, and for computationalists, we hope to provide a rich dataset with plenty of negative results to better inform ML and other data science models.

Acknowledgements
It was a pleasure and a privilege to work with John Gregoire and Joel Haber at Caltech for this complex, long-running project. Additionally, we would like to thank Zan Armstrong, Sam Yang, Kevin Kan, Lan Zhou, Matthias Richter, Chris Roat, Nick Wagner, Marc Coram, Marc Berndl, Pat Riley, and Ted Baltz for their contributions.

Source: Google AI Blog


The Technology Behind our Recent Improvements in Flood Forecasting

Flooding is the most common natural disaster on the planet, affecting the lives of hundreds of millions of people around the globe and causing around $10 billion in damages each year. Building on our work in previous years, earlier this week we announced some of our recent efforts to improve flood forecasting in India and Bangladesh, expanding coverage to more than 250 million people, and providing unprecedented lead time, accuracy and clarity.

To enable these breakthroughs, we have devised a new approach for inundation modeling, called a morphological inundation model, which combines physics-based modeling with machine learning (ML) to create more accurate and scalable inundation models in real-world settings. Additionally, our new alert-targeting model allows identifying areas at risk of flooding at unprecedented scale using end-to-end machine learning models and data that is publicly available globally. In this post, we also describe developments for the next generation of flood forecasting systems, called HydroNets (presented at ICLR AI for Earth Sciences and EGU this year), which is a new architecture specially built for hydrologic modeling across multiple basins, while still optimizing for accuracy at each location.

Forecasting Water Levels
The first step in a flood forecasting system is to identify whether a river is expected to flood. Hydrologic models (or gauge-to-gauge models) have long been used by governments and disaster management agencies to improve the accuracy and extend the lead time of their forecasts. These models receive inputs like precipitation or upstream gauge measurements of water level (i.e., the absolute elevation of the water above sea level) and output a forecast for the water level (or discharge) in the river at some time in the future.

The hydrologic model component of the flood forecasting system described in this week’s Keyword post doubled the lead time of flood alerts for areas covering more than 75 million people. These models not only increase lead time, but also provide unprecedented accuracy, achieving an R2 score of more than 99% across all basins we cover, and predicting the water level within a 15 cm error bound more than 90% of the time. Once a river is predicted to reach flood level, the next step in generating actionable warnings is to convert the river level forecast into a prediction for how the floodplain will be affected.

Morphological Inundation Modeling
In prior work, we developed high quality elevation maps based on satellite imagery, and ran physics-based models to simulate water flow across these digital terrains, which allowed warnings with unprecedented resolution and accuracy in data-scarce regions. In collaboration with our satellite partners, Airbus, Maxar and Planet, we have now expanded the elevation maps to cover hundreds of millions of square kilometers. However, in order to scale up the coverage to such a large area while still retaining high accuracy, we had to re-invent how we develop inundation models.

Inundation modeling estimates what areas will be flooded and how deep the water will be. This visualization conceptually shows how inundation could be simulated, how risk levels could be defined (represented by red and white colors), and how the model could be used to identify areas that should be warned (green dots).

Inundation modeling at scale suffers from three significant challenges. Due to the large areas involved and the resolution required for such models, they necessarily have high computational complexity. In addition, most global elevation maps don’t include riverbed bathymetry, which is important for accurate modeling. Finally, the errors in existing data, which may include gauge measurement errors, missing features in the elevation maps, and the like, need to be understood and corrected. Correcting such problems may require collecting additional high-quality data or fixing erroneous data manually, neither of which scale well.

Our new approach to inundation modeling, which we call a morphological model, addresses these issues by using several innovative tricks. Instead of modeling the complex behaviors of water flow in real time, we compute modifications to the morphology of the elevation map that allow one to simulate the inundation using simple physical principles, such as those describing hydrostatic systems.

First, we train a pure-ML model (devoid of physics-based information) to estimate the one-dimensional river profile from gauge measurements. The model takes as input the water level at a specific point on the river (the stream gauge) and outputs the river profile, which is the water level at all points in the river. We assume that if the gauge increases, the water level increases monotonically, i.e., the water level at other points in the river increases as well. We also assume that the absolute elevation of the river profile decreases downstream (i.e., the river flows downhill).

We then use this learned model and some heuristics to edit the elevation map to approximately “cancel out” the pressure gradient that would exist if that region were flooded. This new synthetic elevation map provides the foundation on which we model the flood behavior using a simple flood-fill algorithm. Finally, we match the resulting flooded map to the satellite-based flood extent with the original stream gauge measurement.

This approach abandons some of the realistic constraints of classical physics-based models, but in data scarce regions where existing methods currently struggle, its flexibility allows the model to automatically learn the correct bathymetry and fix various errors to which physics-based models are sensitive. This morphological model improves accuracy by 3%, which can significantly improve forecasts for large areas, while also allowing for much more rapid model development by reducing the need for manual modeling and correction.

Alert targeting
Many people reside in areas that are not covered by the morphological inundation models, yet access to accurate predictions are still urgently needed. To reach this population and to increase the impact of our flood forecasting models, we designed an end-to-end ML-based approach, using almost exclusively data that is globally publicly available, such as stream gauge measurements, public satellite imagery, and low resolution elevation maps. We train the model to use the data it is receiving to directly infer the inundation map in real time.

A direct ML approach from real-time measurements to inundation.

This approach works well “out of the box” when the model only needs to forecast an event that is within the range of events previously observed. Extrapolating to more extreme conditions is much more challenging. Nevertheless, proper use of existing elevation maps and real-time measurements can enable alerts that are more accurate than presently available for those in areas not covered by the more detailed morphological inundation models. Because this model is highly scalable, we were able to launch it across India after only a few months of work, and we hope to roll it out to many more countries soon.

Improving Water Levels Forecasting
In an effort to continue improving flood forecasting, we have developed HydroNets — a specialized deep neural network architecture built specifically for water levels forecasting — which allows us utilize some exciting recent advances in ML-based hydrology in a real-world operational setting. Two prominent features distinguish it from standard hydrologic models. First, it is able to differentiate between model components that generalize well between sites, such as the modeling of rainfall-runoff processes, and those that are specific to a given site, like the rating curve, which converts a predicted discharge volume into an expected water level. This enables the model to generalize well to different sites, while still fine-tuning its performance to each location. Second, HydroNets takes into account the structure of the river network being modeled, by training a large architecture that is actually a web of smaller neural networks, each representing a different location along the river. This allows neural networks that are modeling upstream sites to pass information encoded in embeddings to models of downstream sites, so that every model can know everything it needs without a drastic increase in parameters.

The animation below illustrates the structure and flow of information in HydroNets. The output from the modeling of upstream sub-basins is combined into a single representation of a given basin state. It is then processed by the shared model component, which is informed by all basins in the network, and passed on to the label prediction model, which calculates the water level (and the loss function). The output from this iteration of the network is then passed on to inform downstream models, and so on.

An illustration of the HydroNets architecture.

We’re incredibly excited about this progress, and are working hard on improving our systems further.

Acknowledgements
This work is a collaboration between many research teams at Google, and is part of our AI for Social Good efforts. We'd also like to thank our Geo and Policy teams, as well as Google.org.

Source: Google AI Blog


New Solutions for Quantum Gravity with TensorFlow


Recent strides in machine learning (ML) research have led to the development of tools useful for research problems well beyond the realm for which they were designed. The value of these tools when applied to topics ranging from teaching robots how to throw to predicting the olfactory properties of molecules is now beginning to be realized. Inspired by advances such as these, we undertook the challenge of applying TensorFlow, a computing platform normally used for ML, to advance the understanding of fundamental physics.

Perhaps the biggest open problem in fundamental theoretical physics may be that our current understanding of quantum mechanics only includes three of the four fundamental forces — the electromagnetic, strong, and weak forces. There is currently no complete quantum theory that also includes the force of gravitation, while still matching experimental observations, i.e., an accurate model of quantum gravity.

One promising approach to a unified model that includes quantum gravity, which has survived many mathematical consistency checks, is called M-Theory, or "The Theory formerly known as Strings,” introduced in 1995 by Edward Witten. In the everyday world, we all experience four dimensions—three spatial dimensions (x, y, and z), plus time (t). M-Theory predicts that, at very short lengths, the Universe is described, instead, by eleven dimensions. But, as one can imagine, establishing the connection between the four-dimensional world that we observe and the 11-dimensional world predicted by M-theory is exceedingly difficult to solve analytically. In fact, it might require analytic manipulation of equations having more terms than there are electrons in the Universe.

This summer, we published an article in the Journal of High Energy Physics where we introduced novel ways to address such problems through creative use of ML technology. Using simplifications enabled by TensorFlow, we managed to bring the total number of known (stable or unstable) equilibrium solutions for one particular type of M-Theory spacetime geometries to 194, including a new and tachyon-free four-dimensional model universe. The geometries that we studied are special in that they are still (barely) accessible with exact calculations that do not require neglecting potentially important terms. We have also released a short instructive Google colab as well as a more powerful Python library for use in related research.

Applying TensorFlow to M-Theory
This work is predicated on a key observation that a mixed numerical and analytic approach can be more powerful than a purely analytical method. Instead of attempting to find analytic solutions with brute force, we use a numerical approach that leverages TensorFlow for the initial search for solutions to the model. This then yields hypotheses on which specific combinations can be tested and analyzed with stringent mathematical methods, ultimately proving the actual existence of a conjectured solution. This represents a novel methodology for making further progress in theoretical physics.

Conclusion
We hope that these results will be an important step in interpreting M-theory, and demonstrate how the research community can use new ML tools, such as TensorFlow, to approach other similarly complex problems. We are already applying the newly discovered methods in further theoretical physics research.

Acknowledgements
This research was conducted by Iulia M. Comşa, Moritz Firsching, and Thomas Fischbacher. Additional thanks go to Jyrki Alakuijala, Rahul Sukthankar, and Jay Yagnik for encouragement and support.

Source: Google AI Blog


An Inside Look at Flood Forecasting


Several years ago, we identified flood forecasts as a unique opportunity to improve people’s lives, and began looking into how Google’s infrastructure and machine learning expertise can help in this field. Last year, we started our flood forecasting pilot in the Patna region, and since then we have expanded our flood forecasting coverage, as part of our larger AI for Social Good efforts. In this post, we discuss some of the technology and methodology behind this effort.

The Inundation Model
A critical step in developing an accurate flood forecasting system is to develop inundation models, which use either a measurement or a forecast of the water level in a river as an input, and simulate the water behavior across the floodplain.
A 3D visualization of a hydraulic model simulating various river conditions.
This allows us to translate current or future river conditions, to highly spatially accurate risk maps - which tell us what areas will be flooded and what areas will be safe. Inundation models depend on four major components, each with its own challenges and innovations:

Real-time Water Level Measurements
To run these models operationally, we need to know what is happening on the ground in real-time, and thus we rely on partnerships with the relevant government agencies to receive timely and accurate information. Our first governmental partner is the Indian Central Water Commission (CWC), which measures water levels hourly in over a thousand stream gauges across all of India, aggregates this data, and produces forecasts based on upstream measurements. The CWC provides these real-time river measurements and forecasts, which are then used as inputs for our models.
CWC employees measuring water level and discharge near Lucknow, India.
Elevation Map Creation
Once we know how much water is in a river, it is critical that the models have a good map of the terrain. High-resolution digital elevation models (DEMs) are incredibly useful for a wide range of applications in the earth sciences, but are still difficult to acquire in most of the world, especially for flood forecasting. This is because meter-wide features of the ground conditions can create a critical difference in the resulting flooding (embankments are one exceptionally important example), but publicly accessible global DEMs have resolutions of tens of meters. To help address this challenge, we’ve developed a novel methodology to produce high resolution DEMs based on completely standard optical imagery.

We start with the large and varied collection of satellite images used in Google Maps. Correlating and aligning the images in large batches, we simultaneously optimize for satellite camera model corrections (for orientation errors, etc.) and for coarse terrain elevation. We then use the corrected camera models to create a depth map for each image. To make the elevation map, we optimally fuse the depth maps together at each location. Finally, we remove objects such as trees and bridges so that they don’t block water flow in our simulations. This can be done manually or by training convolutional neural networks that can identify where the terrain elevations need to be interpolated. The result is a roughly 1 meter DEM, which can be used to run hydraulic models.

Hydraulic Modeling
Once we have both these inputs - the riverine measurements and forecasts, and the elevation map - we can begin the modeling itself, which can be divided into two main components. The first and most substantial component is the physics-based hydraulic model, which updates the location and velocity of the water through time based on (an approximated) computation of the laws of physics. Specifically, we’ve implemented a solver for the 2D form of the shallow-water Saint-Venant equations. These models are suitably accurate when given accurate inputs and run at high resolutions, but their computational complexity creates challenges - it is proportional to the cube of the resolution desired. That is, if you double the resolution, you’ll need roughly 8 times as much processing time. Since we’re committed to the high-resolution required for highly accurate forecasts, this can lead to unscalable computational costs, even for Google!

To help address this problem, we’ve created a unique implementation of our hydraulic model, optimized for Tensor Processing Units (TPUs). While TPUs were optimized for neural networks (rather than differential equation solvers like our hydraulic model), their highly parallelized nature leads to the performance per TPU core being 85x times faster than the performance per CPU core. For additional efficiency improvements, we’re also looking at using machine learning to replace some of the physics-based algorithmics, extending data-driven discretization to two-dimensional hydraulic models, so we can support even larger grids and cover even more people.
A snapshot of a TPU-based simulation of flooding in Goalpara, mid-event.
As mentioned earlier, the hydraulic model is only one component of our inundation forecasts. We’ve repeatedly found locations where our hydraulic models are not sufficiently accurate - whether that’s due to inaccuracies in the DEM, breaches in embankments, or unexpected water sources. Our goal is to find effective ways to reduce these errors. For this purpose, we added a predictive inundation model, based on historical measurements. Since 2014, the European Space Agency has been operating a satellite constellation named Sentinel-1 with C-band Synthetic-Aperture Radar (SAR) instruments. SAR imagery is great at identifying inundation, and can do so regardless of weather conditions and clouds. Based on this valuable data set, we correlate historical water level measurements with historical inundations, allowing us to identify consistent corrections to our hydraulic model. Based on the outputs of both components, we can estimate which disagreements are due to genuine ground condition changes, and which are due to modeling inaccuracies.
Flood warnings across Google’s interfaces.
Looking Forward
We still have a lot to do to fully realize the benefits of our inundation models. First and foremost, we’re working hard to expand the coverage of our operational systems, both within India and to new countries. There’s also a lot more information we want to be able to provide in real time, including forecasted flood depth, temporal information and more. Additionally, we’re researching how to best convey this information to individuals to maximize clarity and encourage them to take the necessary protective actions.

Computationally, while the inundation model is a good tool for improving the spatial resolution (and therefore the accuracy and reliability) of existing flood forecasts, multiple governmental agencies and international organizations we’ve spoken to are concerned about areas that do not have access to effective flood forecasts at all, or whose forecasts don’t provide enough lead time for effective response. In parallel to our work on the inundation model, we’re working on some basic research into improved hydrologic models, which we hope will allow governments not only to produce more spatially accurate forecasts, but also achieve longer preparation time.

Hydrologic models accept as inputs things like precipitation, solar radiation, soil moisture and the like, and produce a forecast for the river discharge (among other things), days into the future. These models are traditionally implemented using a combination of conceptual models approximating different core processes such as snowmelt, surface runoff, evapotranspiration and more.
The core processes of a hydrologic model. Designed by Daniel Klotz, JKU Institute for Machine Learning.
These models also traditionally require a large amount of manual calibration, and tend to underperform in data scarce regions. We are exploring how multi-task learning can be used to address both of these problems — making hydrologic models both more scalable, and more accurate. In research collaboration with JKU Institute For Machine Learning group under Sepp Hochreiter on developing ML-based hydrologic models, Kratzert et al. show how LSTMs perform better than all benchmarked classic hydrologic models.
The distribution of NSE scores on basins across the United States for various models, showing the proposed EA-LSTM consistently outperforming a wide range of commonly used models.
Though this work is still in the basic research stage and not yet operational, we think it is an important first step, and hope it can already be useful for other researchers and hydrologists. It’s an incredible privilege to take part in the large eco-system of researchers, governments, and NGOs working to reduce the harms of flooding. We’re excited about the potential impact this type of research can provide, and look forward to where research in this field will go.

Acknowledgements
There are many people who contributed to this large effort, and we’d like to highlight some of the key contributors: Aaron Yonas, Adi Mano, Ajai Tirumali, Avinatan Hassidim, Carla Bromberg, Damien Pierce, Gal Elidan, Guy Shalev, John Anderson, Karan Agarwal, Kartik Murthy, Manan Singhi, Mor Schlesinger, Ofir Reich, Oleg Zlydenko, Pete Giencke, Piyush Poddar, Ruha Devanesan, Slava Salasin, Varun Gulshan, Vova Anisimov, Yossi Matias, Yi-fan Chen, Yotam Gigi, Yusef Shafi, Zach Moshe and Zvika Ben-Haim.


Source: Google AI Blog


Learning Better Simulation Methods for Partial Differential Equations


The world’s fastest supercomputers were designed for modeling physical phenomena, yet they still are not fast enough to robustly predict the impacts of climate change, to design controls for airplanes based on airflow or to accurately simulate a fusion reactor. All of these phenomena are modeled by partial differential equations (PDEs), the class of equations that describe everything smooth and continuous in the physical world, and the most common class of simulation problems in science and engineering. To solve these equations, we need faster simulations, but in recent years, Moore’s law has been slowing. At the same time, we’ve seen huge breakthroughs in machine learning (ML) along with faster hardware optimized for it. What does this new paradigm offer for scientific computing?

In “Learning Data Driven Discretizations for Partial Differential Equations”, published in Proceedings of the National Academy of Sciences, we explore a potential path for how ML can offer continued improvements in high-performance computing, both for solving PDEs and, more broadly, for solving hard computational problems in every area of science.

For most real-world problems, closed-form solutions to PDEs don’t exist. Instead, one must find discrete equations (“discretizations”) that a computer can solve to approximate the continuous PDE. Typical approaches to solve PDEs represent equations on a grid, e.g., using finite differences. To achieve convergence, the mesh spacing of the grid needs to be smaller than the smallest feature size of the solutions. This often isn’t feasible because of an unfortunate scaling law: achieving 10x higher resolution requires 10,000x more compute, because the grid must be scaled in four dimensions—three spatial dimensions and time. Instead, in our paper we show that ML can be used to learn better representations for PDEs on coarser grids.
Satellite photo of a hurricane, at both full resolution and simulated resolution in a state of the art weather model. Cumulus clouds (e.g., in the red circle) are responsible for heavy rainfall, but in the weather model the details are entirely blurred out. Instead, models rely on crude approximations for sub-grid physics, a key source of uncertainty in climate models. Image credit: NOAA
The challenge is to retain the accuracy of high-resolution simulations while still using the coarsest grid possible. In our work we’re able to improve upon existing schemes by replacing heuristics based on deep human insight (e.g., “solutions to a PDE should always be smooth away from discontinuities”) with optimized rules based on machine learning. The rules our ML models recover are complex, and we don’t entirely understand them, but they incorporate sophisticated physical principles like the idea of “upwinding”—to accurately model what’s coming towards you in a fluid flow, you should look upstream in the direction the wind is coming from. An example of our results on a simple model of fluid dynamics are shown below:
Simulations of Burgers’ equation, a model for shock waves in fluids, solved with either a standard finite volume method (left) or our neural network based method (right). The orange squares represent simulations with each method on low resolution grids. These points are fed back into the model at each time step, which then predicts how they should change. Blue lines show the exact simulations used for training. The neural network solution is much better, even on a 4x coarser grid, as indicated by the orange squares smoothly tracing the blue line.
Our research also illustrates a broader lesson about how to effectively combine machine learning and physics. Rather than attempting to learn physics from scratch, we combined neural networks with components from traditional simulation methods, including the known form of the equations we’re solving and finite volume methods. This means that laws such as conservation of momentum are exactly satisfied, by construction, and allows our machine learning models to focus on what they do best, learning optimal rules for interpolation in complex, high-dimensional spaces.

Next Steps
We are focused on scaling up the techniques outlined in our paper to solve larger scale simulation problems with real-world impacts, such as weather and climate prediction. We’re excited about the broad potential of blending machine learning into the complex algorithms of scientific computing.

Acknowledgments
Thanks to co-authors Yohai Bar-Sinari, Jason Hickey and Michael Brenner; and Google collaborators Peyman Milanfar, Pascal Getreur, Ignacio Garcia Dorado, Dmitrii Kochkov, Jiawei Zhuang and Anton Geraschenko.

Source: Google AI Blog


Introducing TensorNetwork, an Open Source Library for Efficient Tensor Calculations

Originally posted on the Google AI Blog.

Many of the world's toughest scientific challenges, like developing high-temperature superconductors and understanding the true nature of space and time, involve dealing with the complexity of quantum systems. What makes these challenges difficult is that the number of quantum states in these systems is exponentially large, making brute-force computation infeasible. To deal with this, data structures called tensor networks are used. Tensor networks let one focus on the quantum states that are most relevant for real-world problems—the states of low energy, say—while ignoring other states that aren't relevant. Tensor networks are also increasingly finding applications in machine learning (ML). However, there remain difficulties that prohibit them from widespread use in the ML community: 1) a production-level tensor network library for accelerated hardware has not been available to run tensor network algorithms at scale, and 2) most of the tensor network literature is geared toward physics applications and creates the false impression that expertise in quantum mechanics is required to understand the algorithms.

In order to address these issues, we are releasing TensorNetwork, a brand new open source library to improve the efficiency of tensor calculations, developed in collaboration with the Perimeter Institute for Theoretical Physics and X. TensorNetwork uses TensorFlow as a backend and is optimized for GPU processing, which can enable speedups of up to 100x when compared to work on a CPU. We introduce TensorNetwork in a series of papers, the first of which presents the new library and its API, and provides an overview of tensor networks for a non-physics audience. In our second paper we focus on a particular use case in physics, demonstrating the speedup that one gets using GPUs.

How are Tensor Networks Useful?

Tensors are multidimensional arrays, categorized in a hierarchy according to their order: e.g., an ordinary number is a tensor of order zero (also known as a scalar), a vector is an order-one tensor, a matrix is an order-two tensorDiagrammatic notation for tensors. and so on. While low-order tensors can easily be represented by an explicit array of numbers or with a mathematical symbol such as Tijnklm (where the number of indices represents the order of the tensor), that notation becomes very cumbersome once we start talking about high-order tensors. At that point it's useful to start using diagrammatic notation, where one simply draws a circle (or some other shape) with a number of lines, or legs, coming out of it—the number of legs being the same as the order of the tensor. In this notation, a scalar is just a circle, a vector has a single leg, a matrix has two legs, etc. Each leg of the tensor also has a dimension, which is the size of that leg. For example, a vector representing an object's velocity through space would be a three-dimensional, order-one tensor.
Diagrammatic notation for tensors.
The benefit of representing tensors in this way is to succinctly encode mathematical operations, e.g., multiplying a matrix by a vector to produce another vector, or multiplying two vectors to make a scalar. These are all examples of a more general concept called tensor contraction.
Diagrammatic notation for tensor contraction. Vector and matrix multiplication, as well as the matrix trace (i.e., the sum of the diagonal elements of a matrix), are all examples.
These are also simple examples of tensor networks, which are graphical ways of encoding the pattern of tensor contractions of several constituent tensors to form a new one. Each constituent tensor has an order determined by its own number of legs. Legs that are connected, forming an edge in the diagram, represent contraction, while the number of remaining dangling legs determines the order of the resultant tensor.
Left: The trace of the product of four matrices, tr(ABCD), which is a scalar. You can see that it has no dangling legs. Right: Three order-three tensors being contracted with three legs dangling, resulting in a new order-three tensor.
While these examples are very simple, the tensor networks of interest often represent hundreds of tensors contracted in a variety of ways. Describing such a thing would be very obscure using traditional notation, which is why the diagrammatic notation was invented by Roger Penrose in 1971.

Tensor Networks in Practice

Consider a collection of black-and-white images, each of which can be thought of as a list of N pixel values. A single pixel of a single image can be one-hot-encoded into a two-dimensional vector, and by combining these pixel encodings together we can make a 2N-dimensional one-hot encoding of the entire image. We can reshape that high-dimensional vector into an order-N tensor, and then add up all of the tensors in our collection of images to get a total tensor Ti1,i2,...,iN encapsulating the collection.
This sounds like a very wasteful thing to do: encoding images with about 50 pixels in this way would already take petabytes of memory. That's where tensor networks come in. Rather than storing or manipulating the tensor T directly, we instead represent T as the contraction of many smaller constituent tensors in the shape of a tensor network. That turns out to be much more efficient. For instance, the popular matrix product state (MPS) network would write T in terms of N much smaller tensors, so that the total number of parameters is only linear in N, rather than exponential.
The high-order tensor T is represented in terms of many low-order tensors in a matrix product state tensor network.
It's not obvious that large tensor networks can be efficiently created or manipulated while consistently avoiding the need for a huge amount of memory. But it turns out that this is possible in many cases, which is why tensor networks have been used extensively in quantum physics and, now, in machine learning. Stoudenmire and Schwab used the encoding just described to make an image classification model, demonstrating a new use for tensor networks. The TensorNetwork library is designed to facilitate exactly that kind of work, and our first paper describes how the library functions for general tensor network manipulations.

Performance in Physics Use-Cases

TensorNetwork is a general-purpose library for tensor network algorithms, and so it should prove useful for physicists as well. Approximating quantum states is a typical use-case for tensor networks in physics, and is well-suited to illustrate the capabilities of the TensorNetwork library. In our second paper, we describe a tree tensor network (TTN) algorithm for approximating the ground state of either a periodic quantum spin chain (1D) or a lattice model on a thin torus (2D), and implement the algorithm using TensorNetwork. We compare the use of CPUs with GPUs and observe significant computational speed-ups, up to a factor of 100, when using a GPU and the TensorNetwork library.
Computational time as a function of the bond dimension, χ. The bond dimension determines the size of the constituent tensors of the tensor network. A larger bond dimension means the tensor network is more powerful, but requires more computational resources to manipulate.

Conclusion and Future Work

These are the first in a series of planned papers to illustrate the power of TensorNetwork in real-world applications. In our next paper we will use TensorNetwork to classify images in the MNIST and Fashion-MNIST datasets. Future plans include time series analysis on the ML side, and quantum circuit simulation on the physics side. With the open source community, we are also always adding new features to TensorNetwork itself. We hope that TensorNetwork will become a valuable tool for physicists and machine learning practitioners.

Acknowledgements

The TensorNetwork library was developed by Chase Roberts, Adam Zalcman, and Bruce Fontaine of Google AI; Ashley Milsted, Martin Ganahl, and Guifre Vidal of the Perimeter Institute; and Jack Hidary and Stefan Leichenauer of X. We'd also like to thank Stavros Efthymiou at X for valuable contributions.

by Chase Roberts, Research Engineer, Google AI and Stefan Leichenauer, Research Scientist, X 

Introducing TensorNetwork, an Open Source Library for Efficient Tensor Calculations


Many of the world's toughest scientific challenges, like developing high-temperature superconductors and understanding the true nature of space and time, involve dealing with the complexity of quantum systems. What makes these challenges difficult is that the number of quantum states in these systems is exponentially large, making brute-force computation infeasible. To deal with this, data structures called tensor networks are used. Tensor networks let one focus on the quantum states that are most relevant for real-world problems—the states of low energy, say—while ignoring other states that aren't relevant. Tensor networks are also increasingly finding applications in machine learning (ML). However, there remain difficulties that prohibit them from widespread use in the ML community: 1) a production-level tensor network library for accelerated hardware has not been available to run tensor network algorithms at scale, and 2) most of the tensor network literature is geared toward physics applications and creates the false impression that expertise in quantum mechanics is required to understand the algorithms.

In order to address these issues, we are releasing TensorNetwork, a brand new open source library to improve the efficiency of tensor calculations, developed in collaboration with the Perimeter Institute for Theoretical Physics and X. TensorNetwork uses TensorFlow as a backend and is optimized for GPU processing, which can enable speedups of up to 100x when compared to work on a CPU. We introduce TensorNetwork in a series of papers, the first of which presents the new library and its API, and provides an overview of tensor networks for a non-physics audience. In our second paper we focus on a particular use case in physics, demonstrating the speedup that one gets using GPUs.

How are Tensor Networks Useful?
Tensors are multidimensional arrays, categorized in a hierarchy according to their order: e.g., an ordinary number is a tensor of order zero (also known as a scalar), a vector is an order-one tensor, a matrix is an order-two tensor, and so on. While low-order tensors can easily be represented by an explicit array of numbers or with a mathematical symbol such as Tijnklm (where the number of indices represents the order of the tensor), that notation becomes very cumbersome once we start talking about high-order tensors. At that point it’s useful to start using diagrammatic notation, where one simply draws a circle (or some other shape) with a number of lines, or legs, coming out of it—the number of legs being the same as the order of the tensor. In this notation, a scalar is just a circle, a vector has a single leg, a matrix has two legs, etc. Each leg of the tensor also has a dimension, which is the size of that leg. For example, a vector representing an object’s velocity through space would be a three-dimensional, order-one tensor.


Diagrammatic notation for tensors.
The benefit of representing tensors in this way is to succinctly encode mathematical operations, e.g., multiplying a matrix by a vector to produce another vector, or multiplying two vectors to make a scalar. These are all examples of a more general concept called tensor contraction.

Diagrammatic notation for tensor contraction. Vector and matrix multiplication, as well as the matrix trace (i.e., the sum of the diagonal elements of a matrix), are all examples.
These are also simple examples of tensor networks, which are graphical ways of encoding the pattern of tensor contractions of several constituent tensors to form a new one. Each constituent tensor has an order determined by its own number of legs. Legs that are connected, forming an edge in the diagram, represent contraction, while the number of remaining dangling legs determines the order of the resultant tensor.
Left: The trace of the product of four matrices, tr(ABCD), which is a scalar. You can see that it has no dangling legs. Right: Three order-three tensors being contracted with three legs dangling, resulting in a new order-three tensor.
While these examples are very simple, the tensor networks of interest often represent hundreds of tensors contracted in a variety of ways. Describing such a thing would be very obscure using traditional notation, which is why the diagrammatic notation was invented by Roger Penrose in 1971.

Tensor Networks in Practice
Consider a collection of black-and-white images, each of which can be thought of as a list of N pixel values. A single pixel of a single image can be one-hot-encoded into a two-dimensional vector, and by combining these pixel encodings together we can make a 2N-dimensional one-hot encoding of the entire image. We can reshape that high-dimensional vector into an order-N tensor, and then add up all of the tensors in our collection of images to get a total tensor Ti1,i2,...,iN encapsulating the collection.

This sounds like a very wasteful thing to do: encoding images with about 50 pixels in this way would already take petabytes of memory. That’s where tensor networks come in. Rather than storing or manipulating the tensor T directly, we instead represent T as the contraction of many smaller constituent tensors in the shape of a tensor network. That turns out to be much more efficient. For instance, the popular matrix product state (MPS) network would write T in terms of N much smaller tensors, so that the total number of parameters is only linear in N, rather than exponential.
The high-order tensor T is represented in terms of many low-order tensors in a matrix product state tensor network.
It’s not obvious that large tensor networks can be efficiently created or manipulated while consistently avoiding the need for a huge amount of memory. But it turns out that this is possible in many cases, which is why tensor networks have been used extensively in quantum physics and, now, in machine learning. Stoudenmire and Schwab used the encoding just described to make an image classification model, demonstrating a new use for tensor networks. The TensorNetwork library is designed to facilitate exactly that kind of work, and our first paper describes how the library functions for general tensor network manipulations.

Performance in Physics Use-Cases
TensorNetwork is a general-purpose library for tensor network algorithms, and so it should prove useful for physicists as well. Approximating quantum states is a typical use-case for tensor networks in physics, and is well-suited to illustrate the capabilities of the TensorNetwork library. In our second paper, we describe a tree tensor network (TTN) algorithm for approximating the ground state of either a periodic quantum spin chain (1D) or a lattice model on a thin torus (2D), and implement the algorithm using TensorNetwork. We compare the use of CPUs with GPUs and observe significant computational speed-ups, up to a factor of 100, when using a GPU and the TensorNetwork library.
Computational time as a function of the bond dimension, χ. The bond dimension determines the size of the constituent tensors of the tensor network. A larger bond dimension means the tensor network is more powerful, but requires more computational resources to manipulate.
Conclusion and Future Work
These are the first in a series of planned papers to illustrate the power of TensorNetwork in real-world applications. In our next paper we will use TensorNetwork to classify images in the MNIST and Fashion-MNIST datasets. Future plans include time series analysis on the ML side, and quantum circuit simulation on the physics side. With the open source community, we are also always adding new features to TensorNetwork itself. We hope that TensorNetwork will become a valuable tool for physicists and machine learning practitioners.

Acknowledgements
The TensorNetwork library was developed by Chase Roberts, Adam Zalcman, and Bruce Fontaine of Google AI; Ashley Milsted, Martin Ganahl, and Guifre Vidal of the Perimeter Institute; and Jack Hidary and Stefan Leichenauer of X. We’d also like to thank Stavros Efthymiou at X for valuable contributions.

Source: Google AI Blog


Unifying Physics and Deep Learning with TossingBot


Though considerable progress has been made in enabling robots to grasp objects efficiently, visually self adapt or even learn from real-world experiences, robotic operations still require careful consideration in how they pick up, handle, and place various objects -- especially in unstructured settings. Consider for example, this picking robot which took 1st place in the stowing task of the Amazon Robotics Challenge:
It's an impressive system, built with many design features that kinematically prevent it from dropping objects due to unforeseen dynamics: from its steady and deliberate movements, to its gripper fingers that mechanically constrain the momentum of the object so that it doesn't slip.

This robot, like many others, is designed to tolerate the dynamics of the unstructured world. But instead of just tolerating dynamics, can robots learn to use them advantageously, developing an "intuition" of physics that would allow them to complete tasks more efficiently? Perhaps in doing so, robots can improve their capabilities and acquire complex athletic skills like tossing, sliding, spinning, swinging, or catching, potentially leading to many useful applications, such as more efficient debris clearing robots in disaster response scenarios -- where time is of the essence.

To explore this concept, we worked with researchers at Princeton, Columbia, and MIT to develop TossingBot: a picking robot for our real, random world that learns to grasp and throw objects into selected boxes outside its natural range. We find that by learning to throw, TossingBot is capable of achieving picking speeds that are twice as fast as previous systems, with twice the effective placing range. TossingBot jointly learns grasping and throwing policies using an end-to-end neural network that maps from visual observations (RGB-D images) to control parameters for motion primitives. Using overhead cameras to track where objects land, TossingBot improves itself over time through self-supervision. More technical details are available in an early preprint on arXiv.
The Challenges
Throwing is a particularly difficult task as it depends on many factors: from how the object is picked up (i.e., "pre-throw conditions"), to the object's physical properties like mass, friction, aerodynamics, etc. For example, if you grasp a screwdriver by the handle near the center of mass and throw it, it would land much closer than if you had grasped it from the metal tip, which would swing forward and land much farther away. Regardless of how you grasped it though, tossing a screwdriver is incredibly different from tossing a ping pong ball, which would land closer due to air resistance. Manually designing a solution that explicitly handles these factors for every random object is nearly impossible.
Throwing depends on many factors: from how you picked it up, to object properties and dynamics.
Through deep learning, however, our robots can learn from experience rather than rely on manual case-by-case engineering. Previously we've shown that our robots can learn to push and grasp a large variety of objects, but accurately throwing objects requires a larger understanding of projectile physics. Acquiring this knowledge from scratch with only trial-and-error is not only time consuming and expensive, but also generally doesn't work outside of very specific, and carefully set up training scenarios.

Unifying Physics and Deep Learning
A fundamental component of TossingBot is that it learns to throw by integrating simple physics and deep learning, which enables it to train quickly and generalize to new scenarios. Physics provides prior models of how the world works, and we can leverage these models to develop initial controllers for our robots. In the case of throwing, for example, we can use projectile ballistics to provide an estimate for the throwing velocity that is needed to get an object to land at a target location. We can then use neural networks to predict adjustments on top of that estimate from physics, in order to compensate for unknown dynamics as well as the noise and variability of the real world. We call this hybrid formulation Residual Physics, and it enables TossingBot to achieve throwing accuracies of 85%.
At the start of training with randomly initialized weights, TossingBot repeatedly attempts bad grasps. Over time, however, TossingBot learns better ways to grasp objects and simultaneously improves its ability to throw. Occasionally the robot randomly explores what happens if it throws an object at a velocity that it hasn't tried before. When the bin is emptied, TossingBot lifts the boxes to allow objects to slide back into the bin. This way, human intervention is kept at a minimum during training. By 10,000 grasp and throw attempts (or 14 hours of training time), it is capable of achieving throwing accuracies of 85%, with a grasping reliability of 87% in clutter.
TossingBot starts out performing poorly (left), but progressively learns to grasp and toss overnight (right).
Generalizing to New Scenarios
By integrating physics and deep learning, TossingBot is capable of rapidly adapting to never-before-seen throwing locations and objects. For example, after training on objects with simple shapes like wooden blocks, balls, and markers, it can perform reasonably well on new objects such as fake fruit, decorative items, and office objects. On new objects, TossingBot starts out with lower performance, but quickly adapts within a few hundred training steps (i.e., an hour or two) to achieve similar performance as with training objects. We've found that combining physics and deep learning with Residual Physics yields better performance than baseline alternatives (e.g. deep learning without physics). We even tried this task ourselves, and we were pleasantly surprised to learn that TossingBot is more accurate than any of us engineers! Though take that with a grain of salt, as we've yet to test TossingBot against anyone with any actual athletic talent.
TossingBot can generalize to new objects, and is more accurate at throwing than the average Googler.
We also test our policies on their ability to generalize to new target locations previously unseen in training. To this end, we train on a set of boxes, then later test on a different set of boxes with entirely different landing areas. In this setting, we find that Residual Physics for throwing helps significantly, since the initial estimates of throwing velocities from projectile ballistics easily generalize to new target locations, while the residuals help make adjustments on top of those estimates to compensate for varying object properties in the real world. This is in contrast to the baseline alternative of using deep learning without physics, which can only handle target locations seen during training.
TossingBot uses Residual Physics to throw objects to unforeseen locations.
Emerging Semantics from Interaction
To explore what TossingBot learns, we place several objects in the bin, capture images, and feed them into TossingBot's trained neural network to extract intermediate pixel-wise deep features. By clustering these features based on similarity and visualizing nearest neighbors as a heatmap (hotter regions indicate more similarity in feature space), we can localize all ping pong balls in the scene. Even though the orange block shares a similar color with the ping pong balls, its features are different enough for TossingBot to make a distinction. Likewise, we can also use the extracted features to localize all marker pens, which share similar shape and mass, but do not share color. These observations suggest that TossingBot likely learns to rely more on geometric cues (e.g. shape) to learn grasping and throwing. It is also possible that the learned features reflect second-order attributes such as physical properties, which can influence how the objects should be thrown.
TossingBot learns deep features that distinguish object categories without explicit supervision.
These emerging features were learned implicitly from scratch without any explicit supervision beyond task-level grasping and throwing. Yet, they seem to be sufficient for enabling the system to distinguish between object categories (i.e., ping pong balls and marker pens). As such, this experiment speaks out to a broader concept related to machine vision: how should robots learn the semantics of the visual world? From the perspective of classic computer vision, semantics are often pre-defined using human-fabricated image datasets and manually constructed class categories. However, our experiment suggests that it is possible to implicitly learn such object-level semantics from physical interactions alone, as long as they matter for the task at hand. The more complex these interactions, the higher the resolution of the semantics. Towards more generally intelligent robots -- perhaps it is sufficient for them to develop their own notion of semantics through interaction, without requiring any human intervention.

Limitations and Future Work
Although TossingBot's results are promising, it does have its limitations. For example, it assumes that objects are robust enough to withstand landing collisions after being thrown -- further work is required to learn throws that account for fragile objects, or possibly train other robots to catch objects in ways that cushion the landing. Furthermore, TossingBot infers control parameters only from visual data -- exploring additional senses (e.g. force-torque or tactile) may enable the system to better react to new objects.

The combination of physics and deep learning that made TossingBot possible naturally leads to an interesting question: what else could benefit from Residual Physics? Investigating how the idea generalizes to other types of tasks and interactions is a promising direction for future research.

You can learn more about this work in the summary video below.
Acknowledgements
This research was done by Andy Zeng, Shuran Song (faculty at Columbia University), Johnny Lee, Alberto Rodriguez (faculty at MIT), and Thomas Funkhouser (faculty at Princeton University), with special thanks to Ryan Hickman for valuable managerial support, Ivan Krasin and Stefan Welker for fruitful technical discussions, Brandon Hurd and Julian Salazar and Sean Snyder for hardware support, Chad Richards and Jason Freidenfelds for helpful feedback on writing, Erwin Coumans for advice on PyBullet, Laura Graesser for video narration, and Regina Hickman for photography. An early preprint is available on arXiv.

Source: Google AI Blog


The Question of Quantum Supremacy


Quantum computing integrates the two largest technological revolutions of the last half century, information technology and quantum mechanics. If we compute using the rules of quantum mechanics, instead of binary logic, some intractable computational tasks become feasible. An important goal in the pursuit of a universal quantum computer is the determination of the smallest computational task that is prohibitively hard for today’s classical computers. This crossover point is known as the “quantum supremacy” frontier, and is a critical step on the path to more powerful and useful computations.

In “Characterizing quantum supremacy in near-term devices” published in Nature Physics (arXiv here), we present the theoretical foundation for a practical demonstration of quantum supremacy in near-term devices. It proposes the task of sampling bit-strings from the output of random quantum circuits, which can be thought of as the “hello world” program for quantum computers. The upshot of the argument is that the output of random chaotic systems (think butterfly effect) become very quickly harder to predict the longer they run. If one makes a random, chaotic qubit system and examines how long a classical system would take to emulate it, one gets a good measure of when a quantum computer could outperform a classical one. Arguably, this is the strongest theoretical proposal to prove an exponential separation between the computational power of classical and quantum computers.

Determining where exactly the quantum supremacy frontier lies for sampling random quantum circuits has rapidly become an exciting area of research. On one hand, improvements in classical algorithms to simulate quantum circuits aim to increase the size of the quantum circuits required to establish quantum supremacy. This forces an experimental quantum device with a sufficiently large number of qubits and low enough error rates to implement circuits of sufficient depth (i.e the number of layers of gates in the circuit) to achieve supremacy. On the other hand, we now understand better how the particular choice of the quantum gates used to build random quantum circuits affects the simulation cost, leading to improved benchmarks for near-term quantum supremacy (available for download here), which are in some cases quadratically more expensive to simulate classically than the original proposal.

Sampling from random quantum circuits is an excellent calibration benchmark for quantum computers, which we call cross-entropy benchmarking. A successful quantum supremacy experiment with random circuits would demonstrate the basic building blocks for a large-scale fault-tolerant quantum computer. Furthermore, quantum physics has not yet been tested for highly complex quantum states such as this.
Space-time volume of a quantum circuit computation. The computational cost for quantum simulation increases with the volume of the quantum circuit, and in general grows exponentially with the number of qubits and the circuit depth. For asymmetric grids of qubits, the computational space-time volume grows slower with depth than for symmetric grids, and can result in circuits exponentially easier to simulate.
In “A blueprint for demonstrating quantum supremacy with superconducting qubits” (arXiv here), we illustrate a blueprint towards quantum supremacy and experimentally demonstrate a proof-of-principle version for the first time. In the paper, we discuss two key ingredients for quantum supremacy: exponential complexity and accurate computations. We start by running algorithms on subsections of the device ranging from 5 to 9 qubits. We find that the classical simulation cost grows exponentially with the number of qubits. These results are intended to provide a clear example of the exponential power of these devices. Next, we use cross-entropy benchmarking to compare our results against that of an ordinary computer and show that our computations are highly accurate. In fact, the error rate is low enough to achieve quantum supremacy with a larger quantum processor.

Beyond achieving quantum supremacy, a quantum platform should offer clear applications. In our paper, we apply our algorithms towards computational problems in quantum statistical-mechanics using complex multi-qubit gates (as opposed to the two-qubit gates designed for a digital quantum processor with surface code error correction). We show that our devices can be used to study fundamental properties of materials, e.g. microscopic differences between metals and insulators. By extending these results to next-generation devices with ~50 qubits, we hope to answer scientific questions that are beyond the capabilities of any other computing platform.
Photograph of two gmon superconducting qubits and their tunable coupler developed by Charles Neill and Pedram Roushan.
These two publications introduce a realistic proposal for near-term quantum supremacy, and demonstrate a proof-of-principle version for the first time. We will continue to decrease the error rates and increase the number of qubits in quantum processors to reach the quantum supremacy frontier, and to develop quantum algorithms for useful near-term applications.

Source: Google AI Blog