Tag Archives: Google Cloud Platform

Drilling down into Stackdriver Service Monitoring


If you’re responsible for application performance and availability, you know how hard it can be to see it through the eyes of your customers and end users. We think that’s really going to change with last week’s introduction of Stackdriver Service Monitoring, a new tool for monitoring how your customers perceive your applications, and that then lets you drill down to the underlying infrastructure when there’s a problem.

Most IT operations tools take a bottoms-up understanding of IT systems: they look at compute, storage, and networking metrics to infer the customer experience. Application performance management (APM) tools like tracing systems, debuggers, and profilers consider the application from the code level—but lose sight of the underlying infrastructure. Sometimes, a logs analytics solution can provide the glue between those two layers, but often with great effort and expense.

IT operators have been missing a cost-effective, easy-to-use, general-purpose tool to monitor the customer-facing behavior of their applications. It’s hard to know how end users experience your software and it’s difficult to measure services and applications in a standardized way. Ops staff risk burning out from all the spurious alerts. The result of all this is that mean-time-to-resolution (MTTR) is longer than necessary, and customer satisfaction is lower than desired. The situation is exacerbated with microservice architectures where the app itself is broken into many small pieces, which makes it hard to understand how all the pieces fit together and where to start investigating when there is a problem.

That all changes with the release of Stackdriver Service Monitoring. Service Monitoring takes advantage of service-aware, “opinionated” infrastructure so you can monitor how end users perceive your systems, letting you drill down to the infrastructure level when necessary. Initially, we are supporting this functionality for Google App Engine and for Istio service meshes running on Google Kubernetes Engine. We will expand to more platforms over time.

With Stackdriver Service Monitoring, you get the answers to the following questions:
  • What are your services? What functionality do those services expose to internal and external customers?
  • What are your promises and commitments regarding the availability and performance of those services, and are your services meeting them?
  • For microservices-based apps, what are the inter-service dependencies? How can you use that knowledge to double check new code rollouts and triage problems in the event of service degradation?
  • Can you look at all the monitoring signals for a service holistically to reduce MTTR?

Anatomy of Stackdriver Service Monitoring

Service Monitoring has three pieces: the service graph, Service Level Objectives (SLOs), and multi-signal service dashboards. Together, these give you an inventory of your services, visually display the dependencies between them, let you set and measure availability and performance promises, help you triage application problems to quickly find the root cause, and finally, help you debug broken services more quickly than ever before. Let’s look at each piece in turn.

The service graph: This is a service-specific view of your infrastructure. It starts out with a real-time top level display of all services in the Istio service mesh and the communication links between them. Selecting one service displays charts with error rates and latency metrics. Double-clicking on a service allows you to drill down into its underlying Kubernetes infrastructure, providing the long elusive connection between app behavior and infrastructure. There is also a time slider which allows you to see the graph at previous points in time. Using the service graph you can see your application architecture for reference purposes or to triage problems. You can explore metrics about service behavior, and determine whether an upstream service is causing problems to a downstream service. Finally, you can compare the service graph at different points in time to determine whether there was a significant architectural change right before a problem was reported. There is no quicker way to get started exploring and understanding complex multi-service applications.

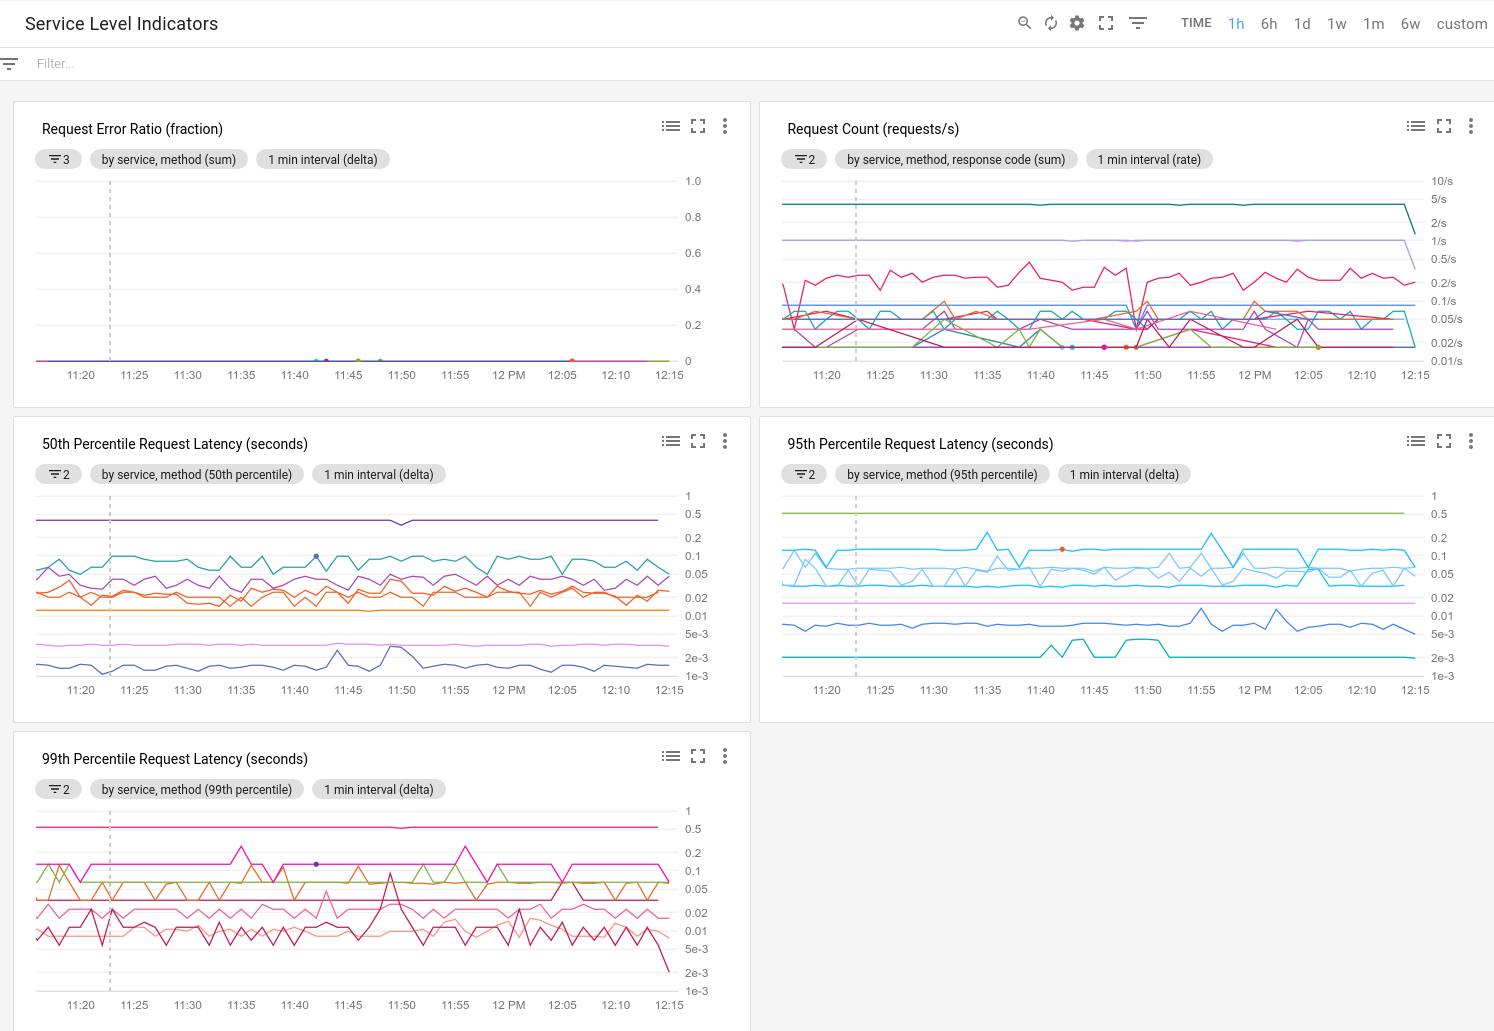
SLOs: Internally at Google, our Site Reliability Engineering team (SRE) only alert themselves on customer-facing symptoms of problems, and not all potential causes. This better aligns them to customer interests, lowers their toil, frees them to do value-added reliability engineering, and increases job satisfaction. Stackdriver Service Monitoring lets you to set, monitor, and alert on SLOs. Because Istio and App Engine are instrumented in an opinionated way, we know exactly what the transaction counts, error counts, and latency distributions are between services. All you need to do is set your targets for availability and performance and we automatically generate the graphs for service level indicators (SLIs), compliance to your targets over time, and your remaining error budget. You can configure the maximum allowed drop rate for your error budget; if that rate is exceeded, we notify you and create an incident so that you can take action. To learn more about SLO concepts including error budget, we encourage you to read the SLO chapter of the SRE book.

Service Dashboard: At some point, you will need to dig deeper into a service’s signals. Maybe you received an SLO alert and there’s no obvious upstream cause. Maybe the service is implicated by the service graph as a possible cause for another service’s SLO alert. Maybe you have a customer complaint outside of an SLO alert that you need to investigate. Or, maybe you want to see how the rollout of a new version of code is going.

The service dashboard provides a single coherent display of all signals for a specific service, all of them scoped to the same timeframe with a single control, providing you the fastest possible way to get to the bottom of a problem with your service. Service monitoring lets you dig deep into the service’s behavior across all signals without having to bounce between different products, tools, or web pages for metrics, logs, and traces. The dashboard gives you a view of the SLOs in one tab, the service metrics (transaction rates, error rates, and latencies) in a second tab, and diagnostics (traces, error reports, and logs) in the third tab.

Once you’ve validated an error budget drop in the first tab and isolated anomalous traffic in the second tab, you can drill down further in the diagnostics tab. For performance issues, you can drill down into long tail traces, and from there easily get into Stackdriver Profiler if your app is instrumented for it. For availability issues you can drill down into logs and error reports, examine stack traces, and open the Stackdriver Debugger, if the app is instrumented for it.

Stackdriver Service Monitoring gives you a whole new way to view your application architecture, reason about its customer-facing behaviors, and get to the root of any problems that arise. It takes advantage of infrastructure software enhancements that Google has championed in the open source-world, and leverages the hard-won knowledge of our SRE teams. We think this will fundamentally transform the ops experience of cloud native and microservice development and operations teams. To learn more see the presentation and demo with Descartes Labs at GCP Next last week. We hope you will sign up to try it out and share your feedback.

Transparent SLIs: See Google Cloud the way your application experiences it


Like all good IT organizations, you religiously measure the performance and availability of your services and applications. But if those apps run in the cloud, critical components are often delivered by a third party or the cloud provider. In the case of a service disruption or degraded performance, how do you know what the problem is—your code, the network, or the provider? And, if the problem is with the service provider, how do you convince them to take action as quickly as possible?

Here at Google Cloud, we are the first cloud provider to report detailed standardized metrics on the behavior of our more than 130 Google Cloud service APIs, and how they are experienced by your applications. Today, we are happy to announce Transparent SLIs (service level indicators) - fine-grained detail about the behavior of Google Cloud Platform (GCP) services as related to your workloads. We display this data in Stackdriver Monitoring dashboards, and it's the same kind of data that Google SREs use to keep our services up and running. (Visit this post to learn more about SLIs.)

Transparent SLI metrics go far beyond simple up/down monitoring of our services. Now, you can debug subtle interactions between your application and our service from Stackdriver metrics such as how many transactions you sent, the rates of their various response codes, and their latency distribution. Then, for each service, you can slice and dice the metrics according to:
  • Service name
  • Method
  • API version
  • Credential ID
  • Location
  • Protocol (HTTP / gRPC)
  • HTTP Response Code (e.g. 402)
  • HTTP Response Code class (e.g. 4xx)
  • gRPC Status Code
Using Stackdriver’s Metrics Explorer, you can browse Transparent SLI metrics and group and filter them by any of the above-mentioned attributes, presenting their mean, min, max, sum, standard deviation, count, and 5th, 50th, 95th, & 99th percentiles. With this, you can easily perform the analysis to determine which subsets of your app’s traffic to GCP services are seeing issues. When you find a view that’s particularly useful, you can save that chart on a Stackdriver custom dashboard that you can view again and again like the following:
An example dashboard for GCP services that groups metrics by service, method and response code. You can also view latency charts on a log scale to quickly find outliers.

Data is power

Transparent SLIs give you the ability to transform your cloud operations for the better. By helping you drill down into interactions between your software and our services, GCP service metrics can tell you whether our services are behaving abnormally for your app’s traffic to speed the problem triage process. Furthermore, when you’re communicating with Google tech support, you can direct them to these charts so that everyone is working from the same data and can agree as to what’s being experienced. By shortening triage time and back and forth with tech support, we can dramatically reduce resolution times.

Here are some examples of how using GCP service metrics can improve the support experience:
  • If all of your calls to a service are failing for a single credential ID, but not any other, chances are there’s something wrong with that account that you can fix yourself without opening a ticket.
  • You’re troubleshooting a problem with your app, and notice a correlation between your application’s degraded performance and a sustained increase in the 50th percentile latency of a critical GCP service. Definitely call us and point us to this data so we can start working on the problem as quickly as possible.
  • The latencies for a GCP service report look good and unchanged from before, but your in-app client-side metrics report that the latency on calls to the service is abnormally high. That suggests that there might be some trouble in the network. Call your network provider (in some cases, Google) to get the debugging process started.
Over time, we think Transparent SLIs’ fine-grained visibility and transparency may change how you think about your services. For every super-demanding latency-sensitive cloud service (e.g., memcache), there are lots of others for which scale and reliability matter much more. Some APIs, Google Cloud Storage or BigQuery for example, can take a of couple seconds at the high end without customers noticing. With data from GCP service metrics, the more you know about the range of typical performance, the easier it is to recognize the outliers.

Transparent SLIs may also help you understand that latency results for most services fall within a normal distribution: a big hump in the middle, and outliers on either side. The metrics will help you understand the normal distribution so that you can engineer your app to work well within the distribution curve. For example, the metrics can help you correlate distribution changes with times when your app is not working as intended, helping you find the root cause of an issue. We expect the 99th percentile to look very different than the median—what we don’t expect are dramatic changes in those percentiles over time. Thus, when investigating whether a GCP service is at fault for an application problem, you should examine the return codes and latency rates over time and look for sustained changes from the norm that are correlated with observed issues in your application(We suggest that you consider the last week to be the norm.)


Setting up dashboards for Transparent SLIs

To get started collecting and exploring Transparent SLIs, go to Stackdriver Metrics Explorer and select "Consumed API" as the resource type. Stackdriver then introspects your project and creates a list of metrics that you can chart based on the products and services you are using. You can then pick the metrics that make the most sense for your environment. You can narrow down the data you display by specifying which project or service you want to monitor. It may also be helpful to specify which credentials’ traffic to view so that you only monitor traffic from production applications and not from other sources.

Stackdriver Metrics Explorer supports availability and latency metrics, which you can combine with filters and aggregations for new and insightful views into your application performance. For example, you can combine a request count metric with a filter on the HTTP Response Code class to build a dashboard that shows error rates over time. Or you can look at the 95th percentile latency of requests to the Cloud Pub/Sub API.

Since the main use case for Transparent SLIs is to help you triage issues with your application and see if GCP services may be the cause, the ideal way to use this data is to mix our metrics with yours. If you have an app that is highly dependent on Cloud SQL, for example, don’t graph the SLIs for Cloud SQL on their own—create a chart with your app’s error rate as one line and the Cloud SQL error rate as another line on the same chart. Doing this allows you to see at a glance whether Cloud SQL errors are a likely cause of unavailability in your app.

Keep us honest

We here at Google Cloud are committed to transparency, and sharing metrics about our services is an important part of that ethic. By sharing them with you, you can easily check up on how we are doing, so that when we work together on a service ticket, everyone is on the same page. We think Transparent SLIs will radically improve your tech support experience and increase your confidence in Google Cloud. Try it out and let us know what you think!

Google Cloud and GitHub collaborate to make CI fast and easy


Today, Google Cloud and GitHub are delivering a new integrated experience that connects GitHub with Google’s Cloud Build, our new CI/CD platform. Together, we will provide fast, frictionless, and convenient Continuous Integration (CI) for any repository on GitHub, integrated directly into the GitHub developer workflow.

Millions of developers trust GitHub today to store and collaborate around source code. Working with GitHub, we realized we had an opportunity to help make it significantly easier for any repository to add CI, integrate DevOps practices, and improve velocity and productivity. We set out to build that together, and today’s release is the first step in that collaboration.

Continuous Integration drives developer productivity

“Continuous integration is a crucial element of modern software development, but historically one that has required development teams to invest significant effort in patching together disparate software products and services to build a working, streamlined pipeline. This is an area where partners with adjacent offerings can add real value by pre-integrating the necessary pieces to deliver a seamless experience. This is what GitHub and Google have set out to do.”
- Rachel Stephens, Analyst, RedMonk
Software development is built on trust. We work in teams and trust our fellow developers to write the right code together. We use open-source operating systems, tools, and libraries so we can focus on the code that we need to write. We trust cloud platforms so we can develop, test, run, and manage our applications securely, at scale. Google Cloud builds on that trust by developing and using open technologies such as Kubernetes, TensorFlow, and Go.

DevOps is also built on trust. Trust is what lets us go faster. We know that mistakes and errors happen and that we will learn from them. We create a culture of trust through transparency and data-driven decisions, through a spirit of shared-fate and blameless post-mortems for continuous improvement. We use automation everywhere, especially CI, to create a safety net. Trust in our tests and our tools lets us go faster. Cloud Build provides the DevOps tools to unleash developer productivity, and help teams go faster.

Collaborations are built on trust too. Google and GitHub have a long history of working together to make software development better for all developers. We have a shared belief in the principles and practices of open source, and a shared vision of productive developers and software teams. We have worked together on improvements to the Git client and protocol, as well as other projects. And Google uses GitHub too: Googlers contributed to nearly 30,000 repos on GitHub last year, some of which are among the most popular projects on GitHub.

Cloud Build and GitHub, better together

“GitHub is excited to partner with Google to make CI for cloud-native application development painless. The ability to use Cloud Build for CI as a part of the GitHub workflow is just the start of this partnership and we look forward to building more in the future with Google.”
- Jason Warner, SVP of Technology at GitHub (read more in GitHub’s blog post)
The integration of Cloud Build with GitHub makes it quick to adopt CI and validate changes by integrating code early and often, bringing a host of benefits to developers, directly from their GitHub workflow.

Zero-config Docker builds: In one step, you can run automated container builds and tests on changes pushed to a GitHub repository as a part of every pull request. GitHub will automatically detect and recommend CI for repositories that contain a Dockerfile.

Scalability: Cloud Build meets the growing needs of your organization. You can go from a single build on your local machine to multiple builds in parallel in the cloud across numerous projects, all in a matter of minutes.

Security: The builds run on infrastructure protected by Google’s security. You get full control over who can create and view your builds, what source code can be used, and where your build artifacts are stored.

Flexibility: For advanced use cases, you can include a cloudbuild.yaml file when setting up CI using Cloud Build. This lets you define custom build steps, speed up builds by caching a Docker image, build leaner containers, and deploy directly to Google Kubernetes Engine, Google App Engine, on-prem clusters (in alpha soon), or another cloud provider.

Insights: Once the build is complete, details about build times, failures and artifacts are available within GitHub through the Checks API, so you can understand and diagnose build results from within the familiar GitHub environment. Full logs and history are available in Cloud Build’s UI in the Google Cloud Console.

Join us

Today’s integration is already available in the GitHub Marketplace. Smart CI recommendations will be rolled out to all GitHub users on a phased basis. Please try it out, and share your feedback with us.

Google and GitHub have had a long relationship serving developers, and this is just the next step. We know there are many other ways we can make software development better for developers. We trust you’ll join us on this journey.

Accelerating software teams with Cloud Build


Software development has come a long way from the days of “it compiles, ship it!” Today’s software teams need to deliver more business value faster than ever—in an environment where the pace of change is accelerating. And while change can mean faster hardware, better security, and more features, it can also come at a cost: new vulnerabilities are discovered every day and seemingly innocuous updates can cause applications to break.

DevOps has learned a lot from manufacturing. The best time to catch and fix a problem is as early and automatically as possible. In software, a similar culture of continuous improvement is essential, along with new tools to automate best practices, like continuous integration and continuous delivery (CI/CD).

Many organizations have embraced CI/CD, but the engineering cost and complexity of operating and maintaining secure and reliable CI/CD infrastructure is high. Incorporating best practices takes time. These are resources better spent writing software. That’s why we introduced Cloud Build, a fully-managed CI/CD platform that lets you build and test applications in the cloud–at scale.
"We found Cloud Build to be feature rich yet also easy to learn and use. We use its parallelization and caching capabilities to speed up our container builds, and leverage its container analysis API to bless our images. Its reliability has allowed us to focus our attention on other areas."
- Riley Shott, Production Engineer at Shopify
In creating Cloud Build we worked with and listened to you, software developers from every walk of life, on teams of every size. We also spent time understanding what helped our own internal engineering teams be productive. Three things consistently stood out.

Scalability: No build is ever too quick. No test suite runs too fast. As a project grows over time and new developers join the team, your CI/CD system must keep up. Built on top of Google's cloud infrastructure, with a range of CPU sizes available and pay-for-what-you-use pricing, Cloud Build can grow with your organization.

Flexibility: Software development is an increasingly complex web of ever-changing frameworks, dependencies, services, languages, and tools. Your applications are deployed across multiple clouds, on-premise resources and mobile app stores. To support your development needs, Cloud Build works with major source repositories like GitHub, GitLab, Cloud Source Repositories, and BitBucket. It also features built-in support for Docker, Maven, Gradle, Bazel, Go, and npm. An ecosystem of add-ons and the ability to bring your own tasks and toolchains as containers makes integrating into your existing developer workflow easy. You can use Cloud Build for hybrid scenarios with VPC networking and custom workers (in alpha).

Security: Security isn’t just for runtimes, it’s a full lifecycle problem that extends into every tool and pipeline you use. Cloud Build uses GCP’s world-class security and policy controls so you have control and visibility of your source and build. Cloud Build runs every build on its own VM, which reduces the risk of information leaking between builds or build errors caused by inconsistent build environments. Vulnerability scanning automatically finds known vulnerabilities in your container images (in alpha for Ubuntu, Debian, and Alpine).

As Rob Pike describes it, “Software engineering is what happens to programming when you add time and other programmers.” Striking a balance between time, quality, velocity and security is hard—but not insurmountable. The key to this balance is trust. When you can trust your tools as a safety net and your culture as a compass it’s much easier to take risks and move fast. Cloud Build makes high velocity software development safer and easier, and unleashes your team’s productivity -- try it out today!

On GCP, your database your way


When choosing a cloud to host your applications, you want a portfolio of database options—SQL, NoSQL, relational, non-relational, scale up/down, scale in/out, you name it—so you can use the right tool for the job. Google Cloud Platform (GCP) offers a full complement of managed database services to address a variety of workload needs, and of course, you can run your own database in Google Compute Engine or Kubernetes Engine if you prefer.

Today, we’re introducing some new database features along with partnerships, beta news and other improvements that can help you get the most out of your databases for your business.

Here’s what we’re announcing today:
  • Oracle workloads can now be brought to GCP
  • SAP HANA workloads can run on GCP persistent-memory VMs
  • Cloud Firestore launching for all users developing cloud-native apps
  • Regional replication, visualization tool available for Cloud Bigtable
  • Cloud Spanner updates, by popular demand

Managing Oracle workloads with Google partners

Until now, it's been a challenge for customers to bring some of the most common workloads to GCP. Today, we’re excited to announce that we are partnering with managed service providers (MSPs) to provide a fully managed service for Oracle workloads for GCP customers. Partner-managed services like this unlock the ability to run Oracle workloads and take advantage of the rest of the GCP platform. You can run your Oracle workloads on dedicated hardware and you can connect the applications you’re running on GCP.

By partnering with a trusted managed service provider, we can offer fully managed services for Oracle workloads with the same advantages as GCP services. You can select the offering that meets your requirements, as well as use your existing investment in Oracle software licenses.

We are excited to open the doors to customers and partners whose technical requirements do not fit neatly into the public cloud. By working with partners, you’ll have the option to move these workloads to GCP and take advantage of the benefits of not having to manage hardware and software. Learn more about managing your Oracle workloads with Google partners, available this fall.

Partnering with Intel and SAP

This week we announced our collaboration with Intel and SAP to offer Compute Engine virtual machines backed by the upcoming Intel Optane DC Persistent Memory for SAP HANA workloads. Google Compute Engine VMs with this Intel Optane DC persistent memory will offer higher overall memory capacity and lower cost compared to instances with only dynamic random-access memory (DRAM). Google Cloud instances on Intel Optane DC Persistent Memory for SAP HANA and other in-memory database workloads will soon be available through an early access program. To learn more, sign up here.

We’re also continuing to scale our instance size roadmap for SAP HANA production workloads. With 4TB machine types now in general availability, we’re working on new virtual machines that support 12TB of memory by next summer, and 18TB of memory by the end of 2019.

Accelerate app development with Cloud Firestore

For app developers, Cloud Firestore brings the ability to easily store and sync app data at global scale. Today, we're announcing that we’ll soon expand the availability of the Cloud Firestore beta to more users by bringing the UI to the GCP console. Cloud Firestore is a serverless, NoSQL document database that simplifies storing, syncing and querying data for your cloud-native apps at global scale. Its client libraries provide live synchronization and offline support, while its security features and integrations with Firebase and GCP accelerate building truly serverless apps.

We're also announcing that Cloud Firestore will support Datastore Mode in the coming weeks. Cloud Firestore, currently available in beta, is the next generation of Cloud Datastore, and offers compatibility with the Datastore API and existing client libraries. With the newly introduced Datastore mode on Cloud Firestore, you don’t need to make any changes to your existing Datastore apps to take advantage of the added benefits of Cloud Firestore. After general availability of Cloud Firestore, we will transparently live-migrate your apps to the Cloud Firestore backend, and you’ll see better performance right away, for the same pricing you have now, with the added benefit of always being strongly consistent. It’ll be a simple, no-downtime upgrade. Read more here about Cloud Firestore.

Simplicity, speed and replication with Cloud Bigtable

For your analytical and operational workloads, an excellent option is Google Cloud Bigtable, a high-throughput, low-latency, and massively scalable NoSQL database. Today, we are announcing that regional replication is generally available. You can easily replicate your Cloud Bigtable data set asynchronously across zones within a GCP region, for additional read throughput, higher durability and resilience in the face of zonal failures. Get more information about regional replication for Cloud Bigtable.

Additionally, we are announcing the beta version of Key Visualizer, a visualization tool for Cloud Bigtable key access patterns. Key Visualizer helps debug performance issues due to unbalanced access patterns across the key space, or single rows that are too large or receiving too much read or write activity. With Key Visualizer, you get a heat map visualization of access patterns over time, along with the ability to zoom into specific key or time ranges, or select a specific row to find the full row key ID that's responsible for a hotspot. Key Visualizer is automatically enabled for Cloud Bigtable clusters with sufficient data or activity, and does not affect Cloud Bigtable cluster performance. Learn more about using Key Visualizer on our website.
Key Visualizer, now in beta, shows an access pattern heat map so you can debug performance issues in Cloud Bigtable.

Finally, we launched client libraries for Node.js (beta) and C# (beta) this month. We will continue working to provide stronger language support for Cloud Bigtable, and look forward to launching Python (beta), C++ (beta), native Java (beta), Ruby (alpha) and PHP (alpha) client libraries in the coming months. Learn more about Cloud Bigtable client libraries.

Cloud Spanner updates, by popular request

Last year, we launched our Cloud Spanner database, and we’ve already seen customers do proof-of-concept trials and deploy business-critical apps to take advantage of Cloud Spanner’s benefits, which include simplified database administration and management, strong global consistency, and industry-leading SLAs.

Today we’re announcing a number of new updates to Cloud Spanner that our customers have requested. First, we recently announced the general availability of import/export functionality. With this new feature, you can move your data using Apache Avro files, which are transferred with our recently released Apache Beam-based Cloud Dataflow connector. This feature makes Cloud Spanner easier to use for a number of important use cases such as disaster recovery, analytics ingestion, testing and more.

We are also previewing data manipulation language (DML) for Cloud Spanner to make it easier to reuse existing code and tool chains. In addition, you’ll see introspection improvements with Top-N Query Statistics support to help database admins tune performance. DML (in the API as well as in the JDBC driver), and Top-N Query Stats will be released for Cloud Spanner later this year.

Your cloud data is essential to whatever type of app you’re building with GCP. You’ve now got more options than ever when picking the database to power your business.

Announcing resource-based pricing for Google Compute Engine


The promise and benefit of the cloud has always been flexibility, low cost, and pay-per-use. With Google Compute Engine, custom machine types let you create VM instances of any size and shape, and we automatically apply committed use and sustained use discounts to reduce your costs. Today, we are taking the concept of pay-for-use in Compute Engine even further with resource-based pricing.

With resource-based pricing we are making a number of changes behind the scenes that align how we treat metering of custom and predefined machine types, as well as how we apply discounts for sustained use discounts. Simply put, we’ve made changes to automatically provide you with more savings and an easy-to-understand monthly bill. Who doesn’t love that?

Resource-based pricing considers usage at a granular level. Instead of evaluating your usage based on which machine types you use, it evaluates how many resources you consume over a given time period. What does that mean? It means that a core is a core, and a GB of RAM is a GB of RAM. It doesn’t matter what combination of pre-defined machine types you are running. Now we look at them at the resource level—in the aggregate. It gets better, too, because sustained use discounts are now calculated regionally, instead of just within zones. That means you can accrue sustained use discounts even faster, so you can save even more automatically.

To better understand these changes, and to get an idea of how you can save, let’s take a look at how sustained use discounts worked previously, and how they’ll work moving forward.
  • Previously, if you used a specific machine type (e.g. n1-standard-4) with four vCPUs for 50% of the month, you got an effective discount of 10%. If you used it for 75% of the month, you got an effective discount of 20%. If you use it for 100% of the month, you got an effective discount of 30%.
Okay. Now, what if you used different machine types?
  • Let’s say you were running a web-based service. You started the month running an n1-standard-4 with four vCPUs. In the second week user demand for your service increased and you scaled capacity. You started running an n1-standard-8 with eight vCPU. Ever increasing demand caused you to scale up again. In week three you began running an n1-standard-16 with sixteen vCPU. Due to your success you wound up scaling again—ending the month running an n1-standard-32 with thirty-two vCPU. In this scenario you wouldn’t receive any discount, because you didn’t run any of the machine types for up to 50% of the month.

With resource-based pricing, we no longer consider your machine type and instead, we add up all the resources you use across all your machines into a single total and then apply the discount. You do not need to take any action. You save automatically. Let’s look at the scaling example again, but this time with resource-based pricing.
  • You began the month running four vCPU, and subsequently scaled to eight vCPU, sixteen vCPU and finally thirty-two vCPU. You ran four vCPU all month, or 100% of the time, so you receive a 30% discount on those vCPU. You ran another four vCPU for 75% of the month, so you receive a 20% discount on those vCPU. And finally, you ran another eight vCPU for half the month, so you receive a 10% discount on those vCPU. Sixteen vCPU were run for one week, so they did not qualify for a discount. Let’s visualize how this works, to reinforce what we’ve learned.

And because resource-based pricing applies at a regional level, it’s now even easier for you to benefit from sustained use discounts, no matter which machine types you use, or the number of zones in a region in which you operate. Resource-based pricing will take effect in the coming months. Visit the Resource-based pricing page to learn more.

Cloud Services Platform: bringing the best of the cloud to you


In the decade since cloud computing became mainstream, it’s captured the hearts and minds of developers and enterprises everywhere. But for most IT organizations, cloud is still but a glimmer of what it could be—or what it should be. Today, we’re excited to share our vision for Cloud Services Platform, an integrated family of cloud services that lets you increase speed and reliability, improve security and governance and build once to run anywhere, across GCP and on-premise environments. With Cloud Services Platform, we bring the benefits of the cloud to you, no matter where you deploy your IT infrastructure today—or tomorrow.

Cloud Services Platform puts all your IT resources into a consistent development, management and control framework, automating away low-value and insecure tasks across your on-premise and Google Cloud infrastructure. Specifically, we’re announcing:
  • Service mesh: Availability of Istio 1.0 in open source, Managed Istio, and Apigee API Management for Istio
  • Hybrid computing: GKE On-Prem with multi-cluster management
  • Policy enforcement: GKE Policy Management, to take control of Kubernetes workloads
  • Ops tooling: Stackdriver Service Monitoring
  • Serverless computing: GKE Serverless add-on and Knative, an open source serverless framework
  • Developer tools: Cloud Build, a fully managed CI/CD platform
The Cloud Services Platform family

“We needed a consistent platform to deploy and manage containers on-premise and in the cloud. As Kubernetes has become the industry standard, it was natural for us to adopt Kubernetes Engine on GCP to reduce the risk and cost of our deployments.”
- Dinesh KESWANI, Global Chief Technology Officer at HSBC
Cloud Services Platform is technologically and architecturally aligned with the joint hybrid cloud products we've been developing and bringing to market with our partner, Cisco, with whom we have been collaborating closely. Our joint solution, Cisco Hybrid Cloud Platform for Google Cloud, will be generally available next month and is now certified to be consistent with Kubernetes Engine, enabling GCP out of the box.

Today, let’s take a look at aspects of the Cloud Services Platform, and how it lays a foundation for a fully realized cloud infrastructure.

Modernizing application architecture with Istio

Last year, we took a step toward helping organizations move from reactive IT management to proactive service operations—the idea of managing at a higher layer of the stack, enabling greater application awareness and control. In collaboration with several industry partners, we announced Istio, an open-source service mesh that gives operators the controls they need to manage microservices at scale. We are excited to say that open-source Istio will move to version 1.0 shortly, making it ready for production deployments.

Building on that open-source foundation, we are announcing a managed Istio service that you can use to manage services within a Kubernetes Engine cluster. Managed Istio, in alpha, is an Istio-powered service mesh available in Kubernetes Engine, complete with enterprise support. Managed Istio accelerates your journey to service operations with three high-level capabilities:
  • Service discovery and intelligent traffic management—Managed Istio surfaces all the services running in your cluster and manages network traffic between them. Using application-level load balancing and sophisticated traffic routing for container and VM workloads, it also provides health checks, plus canary and blue/green deployments, enabling fault tolerant applications with circuit breaking and timeouts.
  • Secure, authenticated communications—Managed Istio offers segmentation and granular policy for endpoints, compliance and detecting anomalous behavior, and traffic encryption by default using mTLS.
  • Monitoring and management—Understand and troubleshoot the system of services running across Managed Istio, including integration with Stackdriver, our suite of monitoring and management tools.
It's still early days, but we are very excited about Istio and Managed Istio, foundational technologies that will drive the use of containers and microservices, while helping to make your environment much more manageable, scalable and available.

Enterprise-grade Kubernetes, wherever you go

A great path to well-managed applications is undoubtedly containers and microservices, and having a common Kubernetes management layer can help get you there that much faster. Four years ago, we released Kubernetes, and the resulting Kubernetes Engine managed service is battle-tested and growing by leaps and bounds: In 2017 Kubernetes Engine core-hours grew 9X year over year.

Today, we are excited to bring that same managed Kubernetes Engine experience to your on-premise infrastructure. GKE On-Prem, soon to be in alpha, is Google-configured Kubernetes that you can deploy in the environment of your choice. GKE On-Prem makes it easy to install and upgrade Kubernetes and provides access to the following capabilities across GCP and on-premise:
  • Unified multi-cluster registration and upgrade management
  • Centralized monitoring and logging with Stackdriver integration
  • Hybrid Identity and Access Management
  • GCP Marketplace for Kubernetes applications
  • Unified cluster management for GCP and on-premise
  • Professional services and enterprise-grade support
Now, with GKE On-Prem, you can begin to modernize existing applications on-premise, without necessarily moving to the cloud. You gain control of your journey to the cloud at your own pace.

Automatically take control of your Kubernetes workloads

When it comes to managing clusters at scale, it’s imperative to have the right security controls in place and ensure your policies can be easily managed and enforced. Today, we’re pleased to announce GKE Policy Management which delivers centralized capabilities that make it far easier for administrators to configure Kubernetes (wherever it may be running).

With GKE Policy Management, Kubernetes administrators create a single source of truth for their policies that automatically syncs with any enrolled cluster. GKE Policy Management supports policies stored as definitions in a repository, and can also use your existing Google Cloud IAM policies to make it simple to secure your clusters. GKE Policy Management is coming soon to alpha; sign up here to express interest.

A service-centric view of your environment

More than simply making it easier to migrate workloads to the cloud, the technologies found in Cloud Services Platform lay the groundwork for improving service operations, by providing administrators with a service-centric view of their infrastructure, rather than infrastructure views of services. Today, we are announcing Stackdriver Service Monitoring, which provides the following new views:
  • Service graph: A real-time bird’s-eye visualization of the entire environment—see all your microservices, how they communicate, and their dependencies.
  • Service level objective (SLO) monitoring: Monitor and alert in the same customer-centric, low-toil manner as Google Site Reliability Engineers (SRE) do for our own services.
  • Service dashboard: All your signals for a given service are in a single place so that you can debug faster and easier than ever before and lower your mean-time-to-resolution (MTTR).
Stackdriver Service Monitoring is designed for workloads running on opinionated Istio infrastructure, as well as App Engine.

When microservices become APIs

Microservices provide a simple, compelling way for organizations to accelerate moving workloads to the cloud, serving as a path towards a larger cloud strategy. Istio enables service discovery, connection and management for microservices. But as soon as those services are needed for internal groups, partners or developers outside of the enterprise, they quickly cross the line and become APIs.

Just as organizations need services management for microservices, they need API management for their APIs. Apigee API Management complements Istio with the robust features of Google Cloud's Apigee API management platform, Apigee Edge, by extending API management natively into the microservices stack. Apigee Edge features include API usage, access, productization, catalog and discovery, plus a developer portal to create a smooth experience for developers and increase API consumption.

Making cloud all it could be

Here at Google, we could never have done what we do today without containers and Kubernetes, but taking a service-oriented view of our operations has been equally critical. In addition to the core capabilities mentioned above, Cloud Services Platform provides access to other new areas of functionality:
  • GKE serverless add-on lets you run serverless workloads on Kubernetes Engine with a one-step deploy. You can go from source to containers amazingly fast, auto-scale your stateless container-based workloads, and even scale down to zero. Sign up for an early preview for the GKE serverless add-on here.
  • Knative (pronounced kay-nay-tiv), open-source serverless components from the same technology that enables the GKE serverless add-on. Knative lets you create modern, container-based and cloud-native applications by providing building blocks you need to build and deploy container-based serverless applications anywhere on Kubernetes.
  • Cloud Build is a fully-managed Continuous Integration/Continuous Delivery (CI/CD) platform that lets you build, test, and deploy software quickly, at scale.
Now, with Cloud Services Platform, we’re excited to bring the full potential of the cloud to you, wherever your workloads may be. For more on Cloud Services Platform, you can read about how it relates to serverless computing.

Bringing the best of serverless to you


Every business wants to innovate—and deliver—great software, faster. In recent years, serverless computing has changed application development, bringing the focus on the application logic instead of infrastructure. With zero server management, auto-scaling to meet any traffic demands, and managed integrated security, developers can move faster, stay agile and focus on what matters most—building great applications.

Google helped pioneer the notion of serverless more than 10 years ago with the introduction of App Engine. Making developers more productive is just as important today as it was then. Over the past few years, we have been working hard to bring the benefits of serverless that we learned from App Engine to our compute, storage, database, messaging services, data analytics, and machine learning offerings.

Today, in tandem with the launch of our Cloud Services Platform, we are sharing several important developments to our serverless compute stack:
  • New App Engine runtimes
  • Cloud Functions general availability, support for additional languages, plus performance, networking and security features
  • Serverless containers on Cloud Functions
  • GKE serverless add-on
  • Knative, Kubernetes-based building blocks for serverless workloads
  • Integration of Cloud Firestore with GCP services

Expanding serverless compute

Today we are announcing support for new second-generation App Engine standard runtimes such as Python 3.7 and PHP 7.2 in addition to recent support for Node.js 8. Second generation runtimes provide developers idiomatic, open-source language runtimes capable of running any framework, library, or binary. Based on gVisor technology, these new runtimes enable faster deployments and increased application performance.

Also, Cloud Functions, our event-driven compute service, is generally available starting today, complete with predictable service guaranteed by an SLA, and a global footprint with new regions in Europe and Asia. In addition, we are bolstering Cloud Functions with a range of new and heavily requested features including support for Python 3.7 and Node.js 8, networking and security controls, and performance improvements across the board. Cloud Functions also lets you seamlessly connect and extend more than 20 GCP services such as BigQuery, Cloud Pub/Sub, machine learning APIs, G Suite, Google Assistant and many more.

Serverless and containers: the best of both worlds

Whether you’re using App Engine or Cloud Functions, Google’s serverless platform offers a complete mix of tools and services. However, many customers tell us they have custom requirements like specific runtimes, custom binaries, or workload portability. More often than not, they turn to containers for an answer. At Google Cloud, we want to bring the best of both serverless and containers together.

Today, we’re also introducing serverless containers, which allow you to run container-based workloads in a fully managed environment and still only pay for what you use. Sign up for an early preview of serverless containers on Cloud Functions to run your own containerized functions on GCP with all the benefits of serverless.

And what if you are already using Kubernetes Engine? A new GKE serverless add-on lets you run serverless workloads on Kubernetes Engine with a one-step deploy. You can go from source to containers instantaneously, auto-scale your stateless container-based workloads, and even scale down to zero. Here’s what T-mobile had to say about running their serverless workloads on Kubernetes Engine:
"The technology behind the GKE serverless add-on enabled us to focus on just the business logic, as opposed to worrying about overhead tasks such as build/deploy, autoscaling, monitoring and observability"
-Ram Gopinathan, Principal Technology Architect, T- Mobile

With Knative, run your serverless workloads anywhere

While we believe Google Cloud is a great place to run all types of workloads, some customers need to run on-premises or across multiple clouds. Based on this feedback, we’re excited to announce Knative (pronounced kay-nay-tiv), which is an open-source set of components from the same technology that enables the GKE serverless add-on.

Developed in close partnership with Pivotal, IBM, Red Hat, and SAP, Knative pushes Kubernetes-based computing forward by providing the building blocks you need to build and deploy modern, container-based serverless applications.

Knative focuses on the common but challenging parts of running apps, such as orchestrating source-to-container builds, routing and managing traffic during deployment, auto-scaling workloads, and binding services to event ecosystems. Knative provides you with familiar, idiomatic language support and standardized patterns you need to deploy any workload, whether it’s a traditional application, function, or container.

Knative provides reusable implementations of common patterns and codified best practices, shared by successful, real-world Kubernetes-based frameworks and applications. For instance, Knative comes with a build component that provides powerful abstraction and flexible workflow for building, testing, or deploying container images or non-container artifacts on a Kubernetes cluster. By integrating Knative into your own platform, you don’t have to choose between the portability and familiarity of containers and the automation and efficiency of serverless computing. And you can enjoy the benefits of Google Cloud’s extensive experience delivering serverless computing whether you run on GCP, on-premises or in any other cloud. Get started today with Knative or join the conversation.

A comprehensive serverless ecosystem

Of course, serverless computing is a non-starter if you can’t easily build and deploy the code, store your data, and manage your applications in production as part of your overall IT environment. At Google Cloud, we’re committed to enabling the comprehensive ecosystem of serverless offerings.

Cloud Build, for instance, lets you create a continuous integration and delivery (CI/CD) pipeline for your serverless applications. You can define custom workflows for building, testing, and deploying across multiple serverless environment such Cloud Functions, App Engine and even Knative.

Cloud Firestore, one of the most recent additions to our serverless stack, lets you store and sync your app data at global scale. Soon, app developers will be able to easily access Cloud Firestore within the GCP Console, and it will also be compatible with Cloud Datastore.

Finally, our Stackdriver suite has four core capabilities—monitoring, logging, application performance management (APM) and the newly released Service Monitoring—and lets you operate and rapidly diagnose your serverless applications in production.

Toward ubiquitous serverless computing

We’re firm believers in finding ways to simplify operations and bring solutions to market faster. Last week’s launch of commercial Kubernetes applications in GCP Marketplace demonstrates how third-party solutions providers are adopting new technologies rapidly to support enterprise demand for extensible solutions. Now, with these new offerings, we’ll help more developers adopt serverless computing in the languages and platforms of their choice.

Click here to learn about the full breadth of Google Cloud serverless technologies.

Partnering with Intel and SAP on Intel Optane DC Persistent Memory for SAP HANA


Our customers do extraordinary things with their data. But as their data grows, they face challenges like the cost of resources needed to handle and store it, and the general sizing limitations with low latency in-memory computing workloads.

Our customers' use of in-memory workloads with SAP HANA for innovative data management use cases is driving the demand for even larger memory capacity. We’re constantly pushing the boundaries on GCP’s instance sizes and exploring increasingly cost-effective ways to run SAP workloads on GCP.

Today, we’re announcing a partnership with Intel and SAP to offer GCP virtual machines supporting the upcoming Intel® Optane™ DC Persistent Memory for SAP HANA workloads. These GCP VMs will be powered by the future Intel® Xeon® Scalable processors (code-named Cascade Lake) thereby expanding VM resource sizing and providing cost benefits for customers.

Compute Engine VMs with Intel Optane DC persistent memory will offer higher overall memory capacity with lower cost compared to instances with only dynamic random-access memory (DRAM). This will help enable you to scale up your instances while keeping your costs under control. Compute Engine has consistently been focused on decreasing your operational overhead through capabilities such as Live Migration. And coupled with the native persistence benefits of Intel Optane DC Persistent Memory, you’ll get faster restart times for your most critical business applications.

Google Cloud instances on Intel Optane DC Persistent Memory for SAP HANA and other workloads will be available in alpha later this year for customer testing. To learn more, please fill out this form to register your interest.

To learn more about this partnership, visit our Intel and SAP partnership pages.

5 must-see network sessions at Google Cloud NEXT 2018


Whether you’re moving data to or from Google Cloud, or are knee-deep plumbing your cloud network architecture, there’s a lot to learn at Google Cloud Next 2018 next week in San Francisco). Here’s our shortlist of the five must-see networking breakout sessions at the show, in chronological order from Wednesday to Thursday.
Operations engineer, Rebekah Roediger, delivering cloud network capacity one link at a time, in our Netherlands cloud region (europe-west4).

GCP Network and Security Telemetry
Speakers: Ines Envid, Senior Product Manager, Yuri Solodkin, Staff Software Engineer and Vineet Bhan, Head of Security Partnerships
Network and security telemetry is fundamental to operate your deployments in public clouds with confidence, providing the required visibility on the behavior of your network and access control firewalls.
When: July 24th, 2018 12:35pm


A Year in GCP Networking
Speakers: Srinath Padmanabhan, Networking Product Marketing Manager, Google Cloud and Nick Jacques, Lead Cloud Engineer, Target
In this session, we will talk about the valuable advancements that have been made in GCP Networking over the last year. We will introduce you to the GCP Network team and will tell you about what you can do to extract the most value from your GCP Deployment.
When: July 24th, 2018 1:55pm


Cloud Load Balancing Deep Dive and Best Practices
Speakers: Prajakta Joshi, Sr. Product Manager and Mike Columbus, Networking Specialist Team Manager
Google Cloud Load Balancing lets enterprises and cloud-native companies deliver highly available, scalable, low-latency cloud services with a global footprint. You will see demos and learn how enterprise customers deploy Cloud Load Balancing and the best practices they use to deliver smart, secure, modern services across the globe.
When: July 25th, 2018 12:35pm


Hybrid Connectivity - Reliably Extending Your Enterprise Network to GCP
Speaker: John Veizades, Product Manager, Google Cloud
In this session, you will learn how to connect to GCP with highly reliable and secure networking to support extending your data center networks into the cloud. We will cover details of resilient routing techniques, access to Google API from on premise networks, connection locations, and partners that support connectivity to GCP -- all designed to support mission-critical network connectivity to GCP.
When: July 26th, 2018 11:40am


VPC Deep Dive and Best Practices
Speakers: Emanuele Mazza, Networking Product Specialist, Google, Neha Pattan, Software Engineer, Google and Kamal Congevaram Muralidharan, Senior Member Technical Staff, Paypal
This session will walk you through the unique operational advantages of GCP VPC for your enterprise cloud deployments. We’ll go through detailed use cases, how to seal and audit your VPC, how to extend your VPC to on-prem in hybrid scenarios, and how to deploy highly available services.
When: July 26th, 2018 9:00am


Be sure to reserve your spot in these sessions today—space is filling up!