Tag Archives: Management Tools

Repairing network hardware at scale with SRE principles


To support our Google Cloud Platform (GCP) customers, we run a complex global network that depends on multiple providers and a lot of hardware. Google network engineering uses a diverse set of vendor equipment to route user traffic from an internet service provider to one of our serving front ends inside a GCP data center. This equipment is proprietary and made by external networking vendors such as Arista, Cisco and Juniper. Each vendor has distinct operational methods, configurations and operational consoles.

With hundreds of distinct components utilized across our global network, we routinely deal with hardware failures—for example, a failed power supply, line card or control plane card. The complexity of today’s cloud networks means that there are a huge number of places where failure can occur. When we first began building and operating our own data centers, Google had a team of engineers, network engineers and site reliability engineers (SREs) who performed fault detection, mitigation and repair work on these devices, using manual processes guided by a ticket system. Google’s SRE principles are prescriptive, and aim to guide developers and operations teams toward better systems reliability. As with DevOps, avoiding toil—the manual tasks that can eat up too much time—is an essential goal.

We realized after becoming familiar with common hardware problems that any ticket type that we encountered repeatedly and that follows a predetermined sequence of steps can easily be automated. Our team created a list of playbooks over time that detailed steps of how to deal with each hardware failure scenario, taking into account relevant software and hardware bugs and typical steps to resolution. Each playbook is used when an alert is received. Given that we already knew in advance how to deal with each issue as it arose, it made sense to automate the work. Here’s how we did it.

Building the automation interface

“In the old way of doing things, we treat our servers like pets, for example, Bob the mail server. If Bob goes down, it’s all hands on deck. The CEO can’t get his email and it’s the end of the world. In the new way, servers are numbered, like cattle in a herd. For example, www001 to www100. When one server goes down, it’s taken out back, shot, and replaced on the line.”
- Randy Bias

The above quote describes a classic engineering scenario often applied within SRE: "Pets vs. cattle," which describes a way of looking at data center hardware as either individual components or a herd of them. The two categories of equipment can be described as follows:

Pet:
  • An individual device you work on. You're familiar with all of its particular failure modes. 
  • When it gets sick, you come to the rescue.

Cattle:
  • A fleet of devices with a common interface.
  • You manage the "herd" of devices as a group.
  • The common interface lets you perform the same basic operations on any device, regardless of its manufacturer.
Before we moved to automating network hardware failure resolution, we were stuck handling our networking equipment like pets, with an eye toward what made it unique, rather than as cattle, with an eye toward what made it a commodity. We needed to make it easier not to custom-manage all these networking devices. Our initial automation design aimed to turn our fleet into cattle by providing a common interface for interacting with networking equipment. Specifically, we used the underlying primitives to implement a higher-level interface for performing common operations—in this case, the basic operations of a line card in a network device, regardless of vendor: "Bring it online," "Take it offline" and "Check the status." We defined the following interface for a line card, using the Go programming language.


type Linecard interface {
  Online() error
  Offline() error 
  Status() error
}
The error qualifier in Go simply means that the function returns an error object if it fails. The underlying code implementing this interface for a Juniper line card varies significantly from implementation on the Cisco line card, but the caller of the function is insulated from the implementation. The upper level code imports the library, and when it operates on a line card, it can only perform one of those three actions we specified above.

We then realized that we could apply the same interface to many hardware components—for example, a fan. For certain vendors, the Online() and Offline() functions did nothing, because those vendors didn't support turning a fan off, so we just used the interface to check the status.
type Fan interface {
  Online() error
  Offline() error 
  Status() error
}
Building upon this line of thought, we realized that we could generalize this interface to define a common interface for all hardware components within a device.
type Component interface {
  Online() error
  Offline() error 
  Status() error
}
By structuring the code this way, anyone can add a device from a new vendor. Moreover, anyone can add any type of new component as a library. Once the library implements this common interface, it can be registered as a handler for that specific vendor and component.

Deciding what to automate

The system needed to interact with humans at various stages of the automation. To decide what to automate, we drew a flow chart of the normal human-based repair sequence and drew boxes around stages we believed we could replace with automation. We used the task of replacing a vendor control plane board as an example. Many of the steps have self-explanatory names, but these are definitions of some of the more complex ones:
  • Determine control plane: Find faulty control plane unit.
  • Determine state: Is it the master or the backup? 
  • Copy image to control plane: Copy the appropriate software image to the master control plane.
  • Offline control plane: Send the backup control plane offline.
  • Toggle mastership: Make the replaced control plane the new master.
Figure 1: Manual workflow for replacing a vendor control plane board
When we needed to carry out this workflow, a Google network engineer performed each step in Figure 1, with the exception of pulling out and replacing the failed control plane, which was performed by someone on-site at a data center location.

Once we had defined this task, we created an automated workflow. The goal of the new system was to provide a UI for our hardware engineers in a data center that allowed them to perform one of those operations at a specific time under specific conditions and with various automated safety checks, followed by an entire device audit at the end of the operation. Previously, a human had performed all of these steps, but now a human only needed to perform the step “hardware gets replaced” in Figure 2—the hardware replacement.
Figure 2: Automated workflow for replacing a vendor control plane board
Automation, before and after
Figure 3: High-level system view.
You can see in Figure 3 what the system looked like after automation. Before automating this workflow, there would have been a lot of manual work. When an alert initially came in, an engineer would have stopped traffic to the device, and offlined by hand the bad component. Our network operations center (NOC) team would then work with the vendor—for example, Juniper or Cisco— to get a replacement part on-site. Next, we would file a change request in our change management system, noting the date of the operation.

On the day of the operation:
  • The data center technician would click “start” on the change management system to begin the repair.
  • Our system picks up this change and is ready to begin the repair.
  • The technician clicks “start” on our UI.
  • An “offline” state machine starts proceeding through the various steps to take the component offline safely.
  • The UI notifies the user each step of the way.
  • Once the state machine has completed, it notifies the technician, who can safely replace the component.
  • Once the component is replaced and re-cabled, the technician returns to the UI and begins the “online” state machine, which safely returns the component into production.
When we reviewed our original automation design, we noticed there would be a lot of work involved in building the various systems needed to implement the automated workflow. To facilitate collaboration, we created ticket items for each component of the system, so multiple engineers could work on the project in parallel.

Automation lessons learned

We used an iterative approach in our planning and execution. We first focused on replacing the line card for one vendor, then moved on to multiple vendors and multiple components. Due to the modular design of the code base and the interacting systems, adding more modules and scaling the code horizontally was easy. 

For example, adding a new library that handled fan replacements meant simply creating the code to handle this and ensuring it implemented the above interface. Then it registered itself in the main function.

We had the option to extend or repurpose existing automation systems owned by our software management teams to meet our needs. We had to carefully consider whether to use those systems or build our own, potentially duplicating work if we chose the latter. Ultimately, we built our own automation because the other systems were understaffed. Trying to extend their tools would have disrupted other teams' project work and delayed our own project.

What worked well
Leveraging multiple engineers to automate our internal part of the workflow allowed us to take the project from design to implementation within a short period—about one year.

What didn’t
We haven't yet fully automated our hardware replacement workflow. Doing so involves troubleshooting hardware issues with vendors and persuading them that each individual failure merits a device or component replacement. We work around this gap in our automation by keeping spares on site for use with our repair automation, and handling the vendor workflow portion of the process separately and mostly manually through our NOC. We are currently working toward a fully automated vendor interaction with our vendor partners.

Measuring automation success
We can measure the hours our automation saves engineers using Google's production change logging service, which all internal tools use to record changes made to the production environment. The service logs changes made by tools manually invoked by engineers as well as tools that provide end-to-end automation without manual input. Thus we can compare how long each network repair action used to take when performed manually vs. the number of repair actions that are undertaken by today's fully automated system. These two data sets allow us to calculate the total time savings from automation. As shown in Figure 4, network hardware repair automation saves us hundreds of hours every month.

Tips for reducing toil through automation

While strategies for eliminating toil must be tailored to your individual environment and use cases, some approaches are universal. Based upon our own experience eliminating toil by automating network repair tasks, we recommend the following: 
  • Measure your toil.  
  • Tackle the biggest sources of toil first, and don't try to solve all problems at once.  
  • Carefully consider whether to enhance existing tools or build new ones. Even if you can partially repurpose another team's work, would creating a tool from scratch actually make more sense cost- or resource-wise? 
  • Take a design-driven approach. Iterate on the design, starting small and iterating quickly. Don't try to design the perfect approach from the start.  
  • Measure your time savings to determine your return on investment.
Automation has proved useful for our team of network site reliability engineers at GCP. Learn more about the practice of SRE and how you might apply its principles to your own network projects.

Istio reaches 1.0: ready for prod


Today, Google Cloud is proud to announce, together with our collaborators, that the Istio open-source project has reached the 1.0 milestone. This is a key step toward delivering the Cloud Services Platform that we discussed last week, helping you manage your services in a hybrid world where some of your infrastructure runs on VMs and some in Kubernetes, some services run in the cloud and some on-premises.

Istio: a service mesh

Istio is at its heart a service mesh—software that layers transparently onto an existing distributed application. It collects logs, traces and telemetry, and adds security and policy without embedding client libraries. Moreover, Istio is also a platform, complete with APIs that let you integrate with systems for logging, telemetry and policy.

Istio delivers a service-based view of the service interactions across the mesh. Whereas traditional monitoring gives you low-level metrics such as nodes’ CPU consumption, Istio measures the actual traffic between services: requests per second, error rates and latency. It also generates a dependency graph so you can see how services affect one another.

With Istio, your DevOps team gets the tools it needs to run distributed apps smoothly. Istio does canary rollouts, letting you smoke-test a new build to make sure it’s performing well before ramping up. It also offers fault-injection, retry logic and circuit breaking so DevOps teams can do more testing and change network behavior at runtime to keep applications up and running.

And finally, Istio adds security. It can be used to layer mTLS on every call, adding encryption-in-flight and giving you the ability to authorize every single call on your cluster and in your mesh.

Istio in action

Istio provides foundational capabilities for your infrastructure, freeing developers to work on code that is critical to your business. But there’s only one way to prove that Istio is ready for the enterprise: by running real workloads on it in production. Already, there are at least a dozen companies running Istio in production, including several on GCP. We worked with them through early hurdles, incorporated their feedback, and they’re reaping the benefits of Istio already. A great example is Auto Trader UK, which used Istio to help accelerate their move to containers and the public cloud.

Auto Trader UK is not only migrating from private cloud to public cloud, but also moving from virtual machines to Kubernetes. The level of control and visibility that Istio provides has enabled us to significantly de-risk this ambitious work, and in several cases has actually helped surface issues we were previously unaware of. We've been able to accelerate the delivery of capabilities such as mutual TLS, that previously would have taken significant engineering effort, allowing us to focus on our market differentiators.
- Karl Stoney, Delivery Infrastructure Lead, Auto Trader UK

A true joint effort

We first released Istio as open source last year, and what a year it’s been. Since that first 0.1 release, Istio has improved and matured significantly, with eight versions, 200+ contributors, and 4,000+ check-ins adding an ever growing set of functionality.

Getting to version 1.0 was truly a community-driven effort. IBM was a key collaborator and co-founder, and Lyft’s Envoy proxy is a key component of the project. Since then, the number of companies involved in Istio has skyrocketed, including Cisco, Red Hat, and VMware consolidating industry support with the goal of accelerating adoption and meeting the service mesh needs of their customers.

“The growth of Istio since its launch last year has been tremendous, and it’s quickly taking its place as the standard way to manage microservices in the cloud,” said Jason McGee, IBM Fellow and VP, IBM Cloud. “Our mission since Istio’s launch has been to enable everyone to succeed with microservices, especially in the enterprise. This is why we’ve focused the community around improving security and scale, and heavily leaned our contributions on what we’ve learned from building agile cloud architectures for companies of all sizes.”
- Jason McGee, IBM Fellow and VP, IBM Cloud 
"We see Istio's potential to be able to solve some of the most complex aspects of application development and deployment. It brings a control plane for service mesh, cluster orchestration, and network control that will support and enable developers to focus on the more important aspects of their application development. We are looking forward to leveraging Istio in Red Hat OpenShift to enable developers to deploy their applications in a more secure and efficient manner." 
- Brian 'Redbeard' Harrington, product manager, Istio, Red Hat
“VMware has been an integral part of the community developing Istio service mesh. We see great potential in Istio’s service-based approach to connectivity, security, and observability. We believe it will become an infrastructure cornerstone, spanning across vSphere and Kubernetes platforms and multiple private and public clouds, and helping our enterprise customers improve development efficiencies and deliver on their SLAs / SLOs in a secure manner. Istio’s application layer complements the network virtualization layer, and together allow enterprises to achieve defense in depth, improve performance and scalability, and speed time to application value.” 
- Pere Monclus, CTO Network and Security, VMware

We’re also thrilled with the number of companies writing adapters for Istio—from observability software from SolarWinds and Datadog, to deployment tools from Weaveworks and CodeFresh, to policy and security offerings from Aspenmesh and Octarine. While Istio is transparent to application developers, it provides a standard integration interface for anyone writing observability tools or policy engines.

Working and integrating with other open source projects in the community drives our success, as well. Integrations with SPIFFE, the Open Policy Agent and OpenTracing all improve the state of open source and the lives of developers.

Istio on GCP

While the open-source Istio project is a major undertaking, we’re also intent on making it especially easy to use on Google Cloud Platform. Last week at Google Cloud Next we announced the alpha release of Managed Istio: open-source Istio that’s automatically installed and upgraded on your Kubernetes Engine clusters as a part of the Cloud Services Platform. Managed Istio will help provide the visibility, security and control you need over services running in hybrid environments, and it integrates with other Google products like Stackdriver and Apigee.

Achieving 1.0 is just a first step, both for the project and for us at Google Cloud. We have ambitious plans for adding features and improving Istio’s usability with  the ultimate goal of delivering a complete set of tools to manage all of your services, so that you can focus on writing software and running a business.

To find out more about Istio and how to get started using it on GCP, please visit cloud.google.com/istio.

Access Google Cloud services, right from IntelliJ IDEA


Great news for IntelliJ users: You can now use Google Cloud services and APIs right from JetBrains’ integrated development environment (IDE). With the Cloud Tools for IntelliJ plugin, you can now discover APIs, consume them, and test against them locally, all without leaving your IDE.

The Cloud Tools plugin for IntelliJ streamlines the development process by integrating tasks into the IDE, such as enabling Google Cloud APIs, creating service accounts for local development, and adding the corresponding Java client libraries to your build.
Example: Using the Cloud Translation API with the Cloud Tools for IntelliJ plugin

Say you are interested in using the Cloud Translation API in our Java Maven-based project. If the Cloud Tools for IntelliJ plugin isn’t already configured, then first install it as described in this quickstart.

Clone the example Cloud Translation project, which allows you to translate some input text from English to French.

git clone https://github.com/GoogleCloudPlatform/java-docs-samples.git
Open the project, located under “java-docs-samples/translate”:

At this point, you might simply try to run the application by navigating to the main method and clicking the play button:

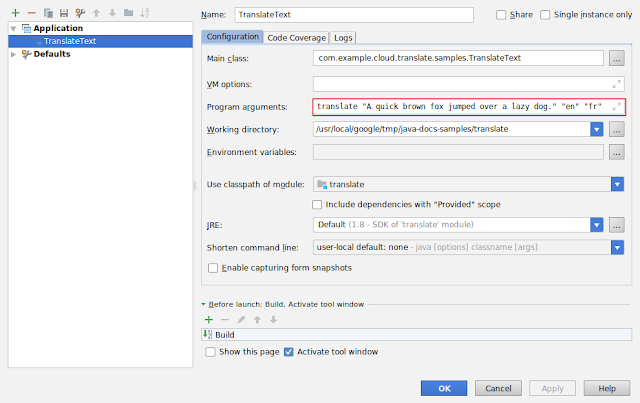
… and configuring the input arguments to translate some text from English to French by editing the newly created run configuration:

Run the program again, and this time you get the following error:

As you may have already guessed, you’re missing authentication rights to access the Cloud Translation API from your local machine. To overcome this, you’d normally have to go through the following steps:
  1. Enable the service on your Google Cloud Platform (GCP) project
  2. Create a new service account with the appropriate roles for accessing the service
  3. Update your local run configuration with the necessary environment variables to access the service
Thankfully, the Cloud Tools for IntelliJ plugin can help. In IntelliJ, navigate to the Cloud Tools menu item under “Tools > Google Cloud Tools > Add Cloud libraries …”:

Select the Cloud Translation API and your GCP project, and click “Add Cloud Libraries”:

In the confirmation window that appears, you can see that Cloud Tools for IntelliJ takes care of enabling the API and creating the service account for you:

Lastly, select the run configuration that you created earlier so that the plugin can inject the necessary environment variables for accessing the Cloud Translation service from your local machine:

Run the program again and your input text is successfully translated from English to French using the Cloud Translation service:

The Cloud Tools for IntelliJ plugin also assists with the following:
  • Adding Java client libraries to your Maven pom.xml if they are not already present
  • Writing a Bill of Materials (BOM) to your pom.xml to help avoid dependency version conflicts
  • Detecting and acting on potential misconfigurations, including a missing BOM, through pom.xml file inspections with quick-fixes
The Cloud Tools for IntelliJ plugin provides many more features to help optimize your development workflow including support for Google App Engine, Stackdriver Debugger, Cloud Repositories, and Cloud Storage. For more information and to leave feedback please visit the official documentation and GitHub pages:

Cloud Tools for IntelliJ:

Drilling down into Stackdriver Service Monitoring


If you’re responsible for application performance and availability, you know how hard it can be to see it through the eyes of your customers and end users. We think that’s really going to change with last week’s introduction of Stackdriver Service Monitoring, a new tool for monitoring how your customers perceive your applications, and that then lets you drill down to the underlying infrastructure when there’s a problem.

Most IT operations tools take a bottoms-up understanding of IT systems: they look at compute, storage, and networking metrics to infer the customer experience. Application performance management (APM) tools like tracing systems, debuggers, and profilers consider the application from the code level—but lose sight of the underlying infrastructure. Sometimes, a logs analytics solution can provide the glue between those two layers, but often with great effort and expense.

IT operators have been missing a cost-effective, easy-to-use, general-purpose tool to monitor the customer-facing behavior of their applications. It’s hard to know how end users experience your software and it’s difficult to measure services and applications in a standardized way. Ops staff risk burning out from all the spurious alerts. The result of all this is that mean-time-to-resolution (MTTR) is longer than necessary, and customer satisfaction is lower than desired. The situation is exacerbated with microservice architectures where the app itself is broken into many small pieces, which makes it hard to understand how all the pieces fit together and where to start investigating when there is a problem.

That all changes with the release of Stackdriver Service Monitoring. Service Monitoring takes advantage of service-aware, “opinionated” infrastructure so you can monitor how end users perceive your systems, letting you drill down to the infrastructure level when necessary. Initially, we are supporting this functionality for Google App Engine and for Istio service meshes running on Google Kubernetes Engine. We will expand to more platforms over time.

With Stackdriver Service Monitoring, you get the answers to the following questions:
  • What are your services? What functionality do those services expose to internal and external customers?
  • What are your promises and commitments regarding the availability and performance of those services, and are your services meeting them?
  • For microservices-based apps, what are the inter-service dependencies? How can you use that knowledge to double check new code rollouts and triage problems in the event of service degradation?
  • Can you look at all the monitoring signals for a service holistically to reduce MTTR?

Anatomy of Stackdriver Service Monitoring

Service Monitoring has three pieces: the service graph, Service Level Objectives (SLOs), and multi-signal service dashboards. Together, these give you an inventory of your services, visually display the dependencies between them, let you set and measure availability and performance promises, help you triage application problems to quickly find the root cause, and finally, help you debug broken services more quickly than ever before. Let’s look at each piece in turn.

The service graph: This is a service-specific view of your infrastructure. It starts out with a real-time top level display of all services in the Istio service mesh and the communication links between them. Selecting one service displays charts with error rates and latency metrics. Double-clicking on a service allows you to drill down into its underlying Kubernetes infrastructure, providing the long elusive connection between app behavior and infrastructure. There is also a time slider which allows you to see the graph at previous points in time. Using the service graph you can see your application architecture for reference purposes or to triage problems. You can explore metrics about service behavior, and determine whether an upstream service is causing problems to a downstream service. Finally, you can compare the service graph at different points in time to determine whether there was a significant architectural change right before a problem was reported. There is no quicker way to get started exploring and understanding complex multi-service applications.

SLOs: Internally at Google, our Site Reliability Engineering team (SRE) only alert themselves on customer-facing symptoms of problems, and not all potential causes. This better aligns them to customer interests, lowers their toil, frees them to do value-added reliability engineering, and increases job satisfaction. Stackdriver Service Monitoring lets you to set, monitor, and alert on SLOs. Because Istio and App Engine are instrumented in an opinionated way, we know exactly what the transaction counts, error counts, and latency distributions are between services. All you need to do is set your targets for availability and performance and we automatically generate the graphs for service level indicators (SLIs), compliance to your targets over time, and your remaining error budget. You can configure the maximum allowed drop rate for your error budget; if that rate is exceeded, we notify you and create an incident so that you can take action. To learn more about SLO concepts including error budget, we encourage you to read the SLO chapter of the SRE book.

Service Dashboard: At some point, you will need to dig deeper into a service’s signals. Maybe you received an SLO alert and there’s no obvious upstream cause. Maybe the service is implicated by the service graph as a possible cause for another service’s SLO alert. Maybe you have a customer complaint outside of an SLO alert that you need to investigate. Or, maybe you want to see how the rollout of a new version of code is going.

The service dashboard provides a single coherent display of all signals for a specific service, all of them scoped to the same timeframe with a single control, providing you the fastest possible way to get to the bottom of a problem with your service. Service monitoring lets you dig deep into the service’s behavior across all signals without having to bounce between different products, tools, or web pages for metrics, logs, and traces. The dashboard gives you a view of the SLOs in one tab, the service metrics (transaction rates, error rates, and latencies) in a second tab, and diagnostics (traces, error reports, and logs) in the third tab.

Once you’ve validated an error budget drop in the first tab and isolated anomalous traffic in the second tab, you can drill down further in the diagnostics tab. For performance issues, you can drill down into long tail traces, and from there easily get into Stackdriver Profiler if your app is instrumented for it. For availability issues you can drill down into logs and error reports, examine stack traces, and open the Stackdriver Debugger, if the app is instrumented for it.

Stackdriver Service Monitoring gives you a whole new way to view your application architecture, reason about its customer-facing behaviors, and get to the root of any problems that arise. It takes advantage of infrastructure software enhancements that Google has championed in the open source-world, and leverages the hard-won knowledge of our SRE teams. We think this will fundamentally transform the ops experience of cloud native and microservice development and operations teams. To learn more see the presentation and demo with Descartes Labs at GCP Next last week. We hope you will sign up to try it out and share your feedback.

Transparent SLIs: See Google Cloud the way your application experiences it


Like all good IT organizations, you religiously measure the performance and availability of your services and applications. But if those apps run in the cloud, critical components are often delivered by a third party or the cloud provider. In the case of a service disruption or degraded performance, how do you know what the problem is—your code, the network, or the provider? And, if the problem is with the service provider, how do you convince them to take action as quickly as possible?

Here at Google Cloud, we are the first cloud provider to report detailed standardized metrics on the behavior of our more than 130 Google Cloud service APIs, and how they are experienced by your applications. Today, we are happy to announce Transparent SLIs (service level indicators) - fine-grained detail about the behavior of Google Cloud Platform (GCP) services as related to your workloads. We display this data in Stackdriver Monitoring dashboards, and it's the same kind of data that Google SREs use to keep our services up and running. (Visit this post to learn more about SLIs.)

Transparent SLI metrics go far beyond simple up/down monitoring of our services. Now, you can debug subtle interactions between your application and our service from Stackdriver metrics such as how many transactions you sent, the rates of their various response codes, and their latency distribution. Then, for each service, you can slice and dice the metrics according to:
  • Service name
  • Method
  • API version
  • Credential ID
  • Location
  • Protocol (HTTP / gRPC)
  • HTTP Response Code (e.g. 402)
  • HTTP Response Code class (e.g. 4xx)
  • gRPC Status Code
Using Stackdriver’s Metrics Explorer, you can browse Transparent SLI metrics and group and filter them by any of the above-mentioned attributes, presenting their mean, min, max, sum, standard deviation, count, and 5th, 50th, 95th, & 99th percentiles. With this, you can easily perform the analysis to determine which subsets of your app’s traffic to GCP services are seeing issues. When you find a view that’s particularly useful, you can save that chart on a Stackdriver custom dashboard that you can view again and again like the following:
An example dashboard for GCP services that groups metrics by service, method and response code. You can also view latency charts on a log scale to quickly find outliers.

Data is power

Transparent SLIs give you the ability to transform your cloud operations for the better. By helping you drill down into interactions between your software and our services, GCP service metrics can tell you whether our services are behaving abnormally for your app’s traffic to speed the problem triage process. Furthermore, when you’re communicating with Google tech support, you can direct them to these charts so that everyone is working from the same data and can agree as to what’s being experienced. By shortening triage time and back and forth with tech support, we can dramatically reduce resolution times.

Here are some examples of how using GCP service metrics can improve the support experience:
  • If all of your calls to a service are failing for a single credential ID, but not any other, chances are there’s something wrong with that account that you can fix yourself without opening a ticket.
  • You’re troubleshooting a problem with your app, and notice a correlation between your application’s degraded performance and a sustained increase in the 50th percentile latency of a critical GCP service. Definitely call us and point us to this data so we can start working on the problem as quickly as possible.
  • The latencies for a GCP service report look good and unchanged from before, but your in-app client-side metrics report that the latency on calls to the service is abnormally high. That suggests that there might be some trouble in the network. Call your network provider (in some cases, Google) to get the debugging process started.
Over time, we think Transparent SLIs’ fine-grained visibility and transparency may change how you think about your services. For every super-demanding latency-sensitive cloud service (e.g., memcache), there are lots of others for which scale and reliability matter much more. Some APIs, Google Cloud Storage or BigQuery for example, can take a of couple seconds at the high end without customers noticing. With data from GCP service metrics, the more you know about the range of typical performance, the easier it is to recognize the outliers.

Transparent SLIs may also help you understand that latency results for most services fall within a normal distribution: a big hump in the middle, and outliers on either side. The metrics will help you understand the normal distribution so that you can engineer your app to work well within the distribution curve. For example, the metrics can help you correlate distribution changes with times when your app is not working as intended, helping you find the root cause of an issue. We expect the 99th percentile to look very different than the median—what we don’t expect are dramatic changes in those percentiles over time. Thus, when investigating whether a GCP service is at fault for an application problem, you should examine the return codes and latency rates over time and look for sustained changes from the norm that are correlated with observed issues in your application(We suggest that you consider the last week to be the norm.)


Setting up dashboards for Transparent SLIs

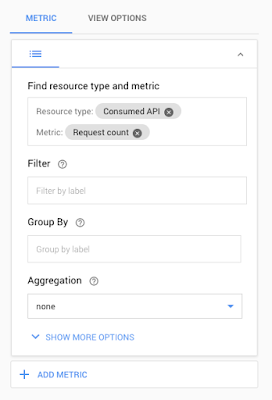
To get started collecting and exploring Transparent SLIs, go to Stackdriver Metrics Explorer and select "Consumed API" as the resource type. Stackdriver then introspects your project and creates a list of metrics that you can chart based on the products and services you are using. You can then pick the metrics that make the most sense for your environment. You can narrow down the data you display by specifying which project or service you want to monitor. It may also be helpful to specify which credentials’ traffic to view so that you only monitor traffic from production applications and not from other sources.

Stackdriver Metrics Explorer supports availability and latency metrics, which you can combine with filters and aggregations for new and insightful views into your application performance. For example, you can combine a request count metric with a filter on the HTTP Response Code class to build a dashboard that shows error rates over time. Or you can look at the 95th percentile latency of requests to the Cloud Pub/Sub API.

Since the main use case for Transparent SLIs is to help you triage issues with your application and see if GCP services may be the cause, the ideal way to use this data is to mix our metrics with yours. If you have an app that is highly dependent on Cloud SQL, for example, don’t graph the SLIs for Cloud SQL on their own—create a chart with your app’s error rate as one line and the Cloud SQL error rate as another line on the same chart. Doing this allows you to see at a glance whether Cloud SQL errors are a likely cause of unavailability in your app.

Keep us honest

We here at Google Cloud are committed to transparency, and sharing metrics about our services is an important part of that ethic. By sharing them with you, you can easily check up on how we are doing, so that when we work together on a service ticket, everyone is on the same page. We think Transparent SLIs will radically improve your tech support experience and increase your confidence in Google Cloud. Try it out and let us know what you think!

Accelerating software teams with Cloud Build


Software development has come a long way from the days of “it compiles, ship it!” Today’s software teams need to deliver more business value faster than ever—in an environment where the pace of change is accelerating. And while change can mean faster hardware, better security, and more features, it can also come at a cost: new vulnerabilities are discovered every day and seemingly innocuous updates can cause applications to break.

DevOps has learned a lot from manufacturing. The best time to catch and fix a problem is as early and automatically as possible. In software, a similar culture of continuous improvement is essential, along with new tools to automate best practices, like continuous integration and continuous delivery (CI/CD).

Many organizations have embraced CI/CD, but the engineering cost and complexity of operating and maintaining secure and reliable CI/CD infrastructure is high. Incorporating best practices takes time. These are resources better spent writing software. That’s why we introduced Cloud Build, a fully-managed CI/CD platform that lets you build and test applications in the cloud–at scale.
"We found Cloud Build to be feature rich yet also easy to learn and use. We use its parallelization and caching capabilities to speed up our container builds, and leverage its container analysis API to bless our images. Its reliability has allowed us to focus our attention on other areas."
- Riley Shott, Production Engineer at Shopify
In creating Cloud Build we worked with and listened to you, software developers from every walk of life, on teams of every size. We also spent time understanding what helped our own internal engineering teams be productive. Three things consistently stood out.

Scalability: No build is ever too quick. No test suite runs too fast. As a project grows over time and new developers join the team, your CI/CD system must keep up. Built on top of Google's cloud infrastructure, with a range of CPU sizes available and pay-for-what-you-use pricing, Cloud Build can grow with your organization.

Flexibility: Software development is an increasingly complex web of ever-changing frameworks, dependencies, services, languages, and tools. Your applications are deployed across multiple clouds, on-premise resources and mobile app stores. To support your development needs, Cloud Build works with major source repositories like GitHub, GitLab, Cloud Source Repositories, and BitBucket. It also features built-in support for Docker, Maven, Gradle, Bazel, Go, and npm. An ecosystem of add-ons and the ability to bring your own tasks and toolchains as containers makes integrating into your existing developer workflow easy. You can use Cloud Build for hybrid scenarios with VPC networking and custom workers (in alpha).

Security: Security isn’t just for runtimes, it’s a full lifecycle problem that extends into every tool and pipeline you use. Cloud Build uses GCP’s world-class security and policy controls so you have control and visibility of your source and build. Cloud Build runs every build on its own VM, which reduces the risk of information leaking between builds or build errors caused by inconsistent build environments. Vulnerability scanning automatically finds known vulnerabilities in your container images (in alpha for Ubuntu, Debian, and Alpine).

As Rob Pike describes it, “Software engineering is what happens to programming when you add time and other programmers.” Striking a balance between time, quality, velocity and security is hard—but not insurmountable. The key to this balance is trust. When you can trust your tools as a safety net and your culture as a compass it’s much easier to take risks and move fast. Cloud Build makes high velocity software development safer and easier, and unleashes your team’s productivity -- try it out today!

Cloud Services Platform: bringing the best of the cloud to you


In the decade since cloud computing became mainstream, it’s captured the hearts and minds of developers and enterprises everywhere. But for most IT organizations, cloud is still but a glimmer of what it could be—or what it should be. Today, we’re excited to share our vision for Cloud Services Platform, an integrated family of cloud services that lets you increase speed and reliability, improve security and governance and build once to run anywhere, across GCP and on-premise environments. With Cloud Services Platform, we bring the benefits of the cloud to you, no matter where you deploy your IT infrastructure today—or tomorrow.

Cloud Services Platform puts all your IT resources into a consistent development, management and control framework, automating away low-value and insecure tasks across your on-premise and Google Cloud infrastructure. Specifically, we’re announcing:
  • Service mesh: Availability of Istio 1.0 in open source, Managed Istio, and Apigee API Management for Istio
  • Hybrid computing: GKE On-Prem with multi-cluster management
  • Policy enforcement: GKE Policy Management, to take control of Kubernetes workloads
  • Ops tooling: Stackdriver Service Monitoring
  • Serverless computing: GKE Serverless add-on and Knative, an open source serverless framework
  • Developer tools: Cloud Build, a fully managed CI/CD platform
The Cloud Services Platform family

“We needed a consistent platform to deploy and manage containers on-premise and in the cloud. As Kubernetes has become the industry standard, it was natural for us to adopt Kubernetes Engine on GCP to reduce the risk and cost of our deployments.”
- Dinesh KESWANI, Global Chief Technology Officer at HSBC
Cloud Services Platform is technologically and architecturally aligned with the joint hybrid cloud products we've been developing and bringing to market with our partner, Cisco, with whom we have been collaborating closely. Our joint solution, Cisco Hybrid Cloud Platform for Google Cloud, will be generally available next month and is now certified to be consistent with Kubernetes Engine, enabling GCP out of the box.

Today, let’s take a look at aspects of the Cloud Services Platform, and how it lays a foundation for a fully realized cloud infrastructure.

Modernizing application architecture with Istio

Last year, we took a step toward helping organizations move from reactive IT management to proactive service operations—the idea of managing at a higher layer of the stack, enabling greater application awareness and control. In collaboration with several industry partners, we announced Istio, an open-source service mesh that gives operators the controls they need to manage microservices at scale. We are excited to say that open-source Istio will move to version 1.0 shortly, making it ready for production deployments.

Building on that open-source foundation, we are announcing a managed Istio service that you can use to manage services within a Kubernetes Engine cluster. Managed Istio, in alpha, is an Istio-powered service mesh available in Kubernetes Engine, complete with enterprise support. Managed Istio accelerates your journey to service operations with three high-level capabilities:
  • Service discovery and intelligent traffic management—Managed Istio surfaces all the services running in your cluster and manages network traffic between them. Using application-level load balancing and sophisticated traffic routing for container and VM workloads, it also provides health checks, plus canary and blue/green deployments, enabling fault tolerant applications with circuit breaking and timeouts.
  • Secure, authenticated communications—Managed Istio offers segmentation and granular policy for endpoints, compliance and detecting anomalous behavior, and traffic encryption by default using mTLS.
  • Monitoring and management—Understand and troubleshoot the system of services running across Managed Istio, including integration with Stackdriver, our suite of monitoring and management tools.
It's still early days, but we are very excited about Istio and Managed Istio, foundational technologies that will drive the use of containers and microservices, while helping to make your environment much more manageable, scalable and available.

Enterprise-grade Kubernetes, wherever you go

A great path to well-managed applications is undoubtedly containers and microservices, and having a common Kubernetes management layer can help get you there that much faster. Four years ago, we released Kubernetes, and the resulting Kubernetes Engine managed service is battle-tested and growing by leaps and bounds: In 2017 Kubernetes Engine core-hours grew 9X year over year.

Today, we are excited to bring that same managed Kubernetes Engine experience to your on-premise infrastructure. GKE On-Prem, soon to be in alpha, is Google-configured Kubernetes that you can deploy in the environment of your choice. GKE On-Prem makes it easy to install and upgrade Kubernetes and provides access to the following capabilities across GCP and on-premise:
  • Unified multi-cluster registration and upgrade management
  • Centralized monitoring and logging with Stackdriver integration
  • Hybrid Identity and Access Management
  • GCP Marketplace for Kubernetes applications
  • Unified cluster management for GCP and on-premise
  • Professional services and enterprise-grade support
Now, with GKE On-Prem, you can begin to modernize existing applications on-premise, without necessarily moving to the cloud. You gain control of your journey to the cloud at your own pace.

Automatically take control of your Kubernetes workloads

When it comes to managing clusters at scale, it’s imperative to have the right security controls in place and ensure your policies can be easily managed and enforced. Today, we’re pleased to announce GKE Policy Management which delivers centralized capabilities that make it far easier for administrators to configure Kubernetes (wherever it may be running).

With GKE Policy Management, Kubernetes administrators create a single source of truth for their policies that automatically syncs with any enrolled cluster. GKE Policy Management supports policies stored as definitions in a repository, and can also use your existing Google Cloud IAM policies to make it simple to secure your clusters. GKE Policy Management is coming soon to alpha; sign up here to express interest.

A service-centric view of your environment

More than simply making it easier to migrate workloads to the cloud, the technologies found in Cloud Services Platform lay the groundwork for improving service operations, by providing administrators with a service-centric view of their infrastructure, rather than infrastructure views of services. Today, we are announcing Stackdriver Service Monitoring, which provides the following new views:
  • Service graph: A real-time bird’s-eye visualization of the entire environment—see all your microservices, how they communicate, and their dependencies.
  • Service level objective (SLO) monitoring: Monitor and alert in the same customer-centric, low-toil manner as Google Site Reliability Engineers (SRE) do for our own services.
  • Service dashboard: All your signals for a given service are in a single place so that you can debug faster and easier than ever before and lower your mean-time-to-resolution (MTTR).
Stackdriver Service Monitoring is designed for workloads running on opinionated Istio infrastructure, as well as App Engine.

When microservices become APIs

Microservices provide a simple, compelling way for organizations to accelerate moving workloads to the cloud, serving as a path towards a larger cloud strategy. Istio enables service discovery, connection and management for microservices. But as soon as those services are needed for internal groups, partners or developers outside of the enterprise, they quickly cross the line and become APIs.

Just as organizations need services management for microservices, they need API management for their APIs. Apigee API Management complements Istio with the robust features of Google Cloud's Apigee API management platform, Apigee Edge, by extending API management natively into the microservices stack. Apigee Edge features include API usage, access, productization, catalog and discovery, plus a developer portal to create a smooth experience for developers and increase API consumption.

Making cloud all it could be

Here at Google, we could never have done what we do today without containers and Kubernetes, but taking a service-oriented view of our operations has been equally critical. In addition to the core capabilities mentioned above, Cloud Services Platform provides access to other new areas of functionality:
  • GKE serverless add-on lets you run serverless workloads on Kubernetes Engine with a one-step deploy. You can go from source to containers amazingly fast, auto-scale your stateless container-based workloads, and even scale down to zero. Sign up for an early preview for the GKE serverless add-on here.
  • Knative (pronounced kay-nay-tiv), open-source serverless components from the same technology that enables the GKE serverless add-on. Knative lets you create modern, container-based and cloud-native applications by providing building blocks you need to build and deploy container-based serverless applications anywhere on Kubernetes.
  • Cloud Build is a fully-managed Continuous Integration/Continuous Delivery (CI/CD) platform that lets you build, test, and deploy software quickly, at scale.
Now, with Cloud Services Platform, we’re excited to bring the full potential of the cloud to you, wherever your workloads may be. For more on Cloud Services Platform, you can read about how it relates to serverless computing.

VMware and Google Cloud: building the hybrid cloud together with vRealize Orchestrator


Many of our customers with hybrid cloud environments rely on VMware software on-premises. They want to simplify provisioning and enable end-user self service. At the same time, they also want to make sure they’re complying with IT policies and following IT best practices. As a result, many use VMware vRealize Automation, a platform for automated self-service provisioning and lifecycle management of IT infrastructure, and are looking for ways to leverage it in the cloud.

Today, we’re announcing the preview of our plug-in for VMware vRealize Orchestrator and support for Google Cloud Platform (GCP) resources in vRealize Automation. With these resources, you can now deploy and manage GCPresources from within your vRealize Automation environment.

The GCP plug-in for VMware vRealize Orchestrator provides a consistent management and governance experience across on-premises and GCP-based IT environments. For example, you can use Google-provided blueprints or build your own blueprints for Google Compute Engine resources and publish to the vRealize service catalog. This means you can select and launch resources in a predictable manner that is similar to how you launch VMs in your on-premises VMware environment, using a tool you’re already familiar with.

This preview release allows you to:
  • Create vRealize Automation “blueprints” for Compute Engine VM Instances
  • Request and self-provision resources in GCP using vRA’s catalog feature
  • Gain visibility and reclaim resources in GCP to reduce operational costs
  • Enforce access and resource quota policies for resources in GCP
  • Initiate Day 2 operations (start, stop, delete, etc.) on Compute Engine VM Instances, Instance Groups and Disks
The GCP plug-in for vRealize makes it easy for you to unlock new hybrid scenarios. For example:

  1. Reach new regions to address global business needs. (Hello Finland, Mumbai and Singapore.)
  2. Define large-scale applications using vRA and deploy to Compute Engine to leverage GCP’s worldwide load balancing and automatic scaling.
  3. Save money by deploying VMs as Compute Engine Preemptible VM Instances and using Custom Machine Types to tailor the VM configuration to application needs.
  4. Accelerate the time it takes to train a machine learning model by using Compute Engine with NVIDIA® Tesla® P100 GPUs.
  5. Replicate your on premises-based applications to the cloud and scale up or down as your business dictates.
While this preview offers support for Compute Engine Virtual Machines in vRealize Automation, we’re working together with VMware to add support for additional GCP products such as Cloud TPUs—we’ll share more on that in the coming months. You can also find more information about this announcement by reading VMware’s blog.

In the meantime, to join the preview program, please submit a request using the preview intake form.

SRE fundamentals: SLIs, SLAs and SLOs


Next week at Google Cloud Next ‘18, you’ll be hearing about new ways to think about and ensure the availability of your applications. A big part of that is establishing and monitoring service-level metrics—something that our Site Reliability Engineering (SRE) team does day in and day out here at Google. Our SRE principles have as their end goal to improve services and in turn the user experience, and next week we’ll be discussing some new ways you can incorporate SRE principles into your operations.

In fact, a recent Forrester report on infrastructure transformation offers details on how you can apply these SRE principles at your company—more easily than you might think. They found that enterprises can apply most SRE principles either directly or with minor modification.

To learn more about applying SRE in your business, we invite you to join Ben Treynor, head of Google SRE, who will be sharing some exciting announcements and walking through real-life SRE scenarios at his Next ‘18 Spotlight session. Register now as seats are limited.

The concept of SRE starts with the idea that metrics should be closely tied to business objectives. We use several essential measurements—SLO, SLA and SLI—in SRE planning and practice.

Defining the terms of site reliability engineering

These measurements aren’t just useful abstractions. Without them, you cannot know if your system is reliable, available or even useful. If they don’t tie explicitly back to your business objectives, then you don’t have data on whether the choices you make are helping or hurting your business.

As a refresher, here’s a look at the key measurements of SRE, as discussed by AJ Ross, Adrian Hilton and Dave Rensin of our Customer Reliability Engineering team, in the January 2017 blog post, SLOs, SLIs, SLAs, oh my - CRE life lessons.


1. Service-Level Objective (SLO)

SRE begins with the idea that a prerequisite to success is availability. A system that is unavailable cannot perform its function and will fail by default. Availability, in SRE terms, defines whether a system is able to fulfill its intended function at a point in time. In addition to being used as a reporting tool, the historical availability measurement can also describe the probability that your system will perform as expected in the future.

When we set out to define the terms of SRE, we wanted to set a precise numerical target for system availability. We term this target the Service-Level Objective (SLO) of our system. Any discussion we have in the future about whether the system is running sufficiently reliably and what design or architectural changes we should make to it must be framed in terms of our system continuing to meet this SLO.

Keep in mind that the more reliable the service, the more it costs to operate. Define the lowest level of reliability that you can get away with for each service, and state that as your SLO. Every service should have an SLO—without it, your team and your stakeholders cannot make principled judgments about whether your service needs to be made more reliable (increasing cost and slowing development) or less reliable (allowing greater velocity of development). Excessive availability can become a problem because now it’s the expectation. Don’t make your system overly reliable if you don’t intend to commit to it to being that reliable.

Within Google, we implement periodic downtime in some services to prevent a service from being overly available. You might also try experimenting with planned-downtime exercises with front-end servers occasionally, as we did with one of our internal systems. We found that these exercises can uncover services that are using those servers inappropriately. With that information, you can then move workloads to somewhere more suitable and keep servers at the right availability level.

2. Service-Level Agreement (SLA)

At Google, we distinguish between an SLO and a Service-Level Agreement (SLA). An SLA normally involves a promise to someone using your service that its availability should meet a certain level over a certain period, and if it fails to do so then some kind of penalty will be paid. This might be a partial refund of the service subscription fee paid by customers for that period, or additional subscription time added for free. The concept is that going out of SLA is going to hurt the service team, so they will push hard to stay within SLA. If you’re charging your customers money, you will probably need an SLA.

Because of this, and because of the principle that availability shouldn’t be much better than the SLO, the SLA is normally a looser objective than the SLO. This might be expressed in availability numbers: for instance, an availability SLA of 99.9% over one month, with an internal availability SLO of 99.95%. Alternatively, the SLA might only specify a subset of the metrics that make up the SLO.

If you have an SLA that is different from your SLO, as it almost always is, it’s important for your monitoring to measure SLA compliance explicitly. You want to be able to view your system’s availability over the SLA calendar period, and easily see if it appears to be in danger of going out of SLA. You will also need a precise measurement of compliance, usually from logs analysis. Since we have an extra set of obligations (in the form of our SLA) to paying customers, we need to measure queries received from them separately from other queries. That’s another benefit of establishing an SLA—it’s an unambiguous way to prioritize traffic.

When you define your SLA, you need to be extra-careful about which queries you count as legitimate. For example, if a customer goes over quota because they released a buggy version of their mobile client, you may consider excluding all “out of quota” response codes from your SLA accounting.

3. Service-Level Indicator (SLI)

We also have a direct measurement of SLO conformance: the frequency of successful probes of our system. This is a Service-Level Indicator (SLI). When we evaluate whether our system has been running within SLO for the past week, we look at the SLI to get the service availability percentage. If it goes below the specified SLO, we have a problem and may need to make the system more available in some way, such as running a second instance of the service in a different city and load-balancing between the two. If you want to know how reliable your service is, you must be able to measure the rates of successful and unsuccessful queries; these will form the basis of your SLIs.

Since the original post was published, we’ve made some updates to Stackdriver that let you incorporate SLIs even more easily into your Google Cloud Platform (GCP) workflows. You can now combine your in-house SLIs with the SLIs of the GCP services that you use, all in the same Stackdriver monitoring dashboard. At Next ‘18, the Spotlight session with Ben Treynor and Snapchat will illustrate how Snap uses its dashboard to get insight into what matters to its customers and map it directly to what information it gets from GCP, for an in-depth view of customer experience.
Automatic dashboards in Stackdriver for GCP services enable you to group several ways: per service, per method and per response code any of the 50th, 95th and 99th percentile charts. You can also see latency charts on log scale to quickly find outliers.  

If you’re building a system from scratch, make sure that SLIs and SLOs are part of your system requirements. If you already have a production system but don’t have them clearly defined, then that’s your highest priority work. If you’re coming to Next ‘18, we look forward to seeing you there.

See related content:


Bringing GPU-accelerated analytics to GCP Marketplace with MapD


Editor’s note: Today, we hear from our partner MapD, whose data analytics platform uses GPUs to accelerate queries and visualizations. Read on to learn how MapD and Google Cloud are working together.

MapD and public cloud are a great fit. Combining cloud-based GPU infrastructure with MapD’s performance, interactivity and operational ease of use is a big win for our customers, allowing data scientists and analysts to visually explore billion-row datasets with fluidity and minimal hassle.

Our Community and Enterprise Edition images are available on AWS, MapD docker containers are available on NVIDIA GPU Cloud (NGC), as well as our own MapD Cloud. Today, we’re thrilled to announce the availability of MapD on Google Cloud Platform (GCP) Marketplace, helping us bring interactivity at scale to the widest possible audience. With services like Cloud DataFlow, Cloud BigTable and Cloud AI, GCP has emerged as a great platform for data-intensive workloads. Combining MapD and these services let us define scalable, high-performance visual analytics workflows for a variety of use cases.

On GCP, you’ll find both our Community and Enterprise editions for K80, Pascal and Volta GPU instances in the GCP Marketplace. Google’s flexible approach to attaching GPU dies to standard CPU-based instance types means you can dial up or down the necessary GPU capacity for your instances depending on the size of your datasets and your compute needs.

We’re confident that MapD’s availability on GCP marketplace will further accelerate the adoption of GPUs as a key part of enterprise analytics workloads, in addition to their obvious applicability to AI, graphics and general purpose computing. Click here to try out MapD on GCP.