Tag Archives: Biology

Building better pangenomes to improve the equity of genomics

For decades, researchers worked together to assemble a complete copy of the molecular instructions for a human — a map of the human genome. The first draft was finished in 2000, but with several missing pieces. Even when a complete reference genome was achieved in 2022, their work was not finished. A single reference genome can’t incorporate known genetic variations, such as the variants for the gene determining whether a person has a blood type A, B, AB or O. Furthermore, the reference genome didn’t represent the vast diversity of human ancestries, making it less useful for detecting disease or finding cures for people from some backgrounds than others. For the past three years, we have been part of an international collaboration with 119 scientists across 60 institutions, called the Human Pangenome Research Consortium, to address these challenges by creating a new and more representative map of the human genome, a pangenome.

We are excited to share that today, in “A draft human pangenome reference”, published in Nature, this group is announcing the completion of the first human pangenome reference. The pangenome combines 47 individual genome reference sequences and better represents the genomic diversity of global populations. Building on Google’s deep learning technologies and past advances in genomics, we used tools based on convolutional neural networks (CNNs) and transformers to tackle the challenges of building accurate pangenome sequences and using them for genome analysis. These contributions helped the consortium build an information-rich resource for geneticists, researchers and clinicians around the world.


Using graphs to build pangenomes

In the typical analysis workflow for high-throughput DNA sequencing, a sequencing instrument reads millions of short pieces of an individual’s genome, and a program called a mapper or aligner then estimates where those pieces best fit relative to the single, linear human reference sequence. Next, variant caller software identifies the unique parts of the individual’s sequence relative to the reference.

But because humans carry a diverse set of sequences, sections that are present in an individual’s DNA but are not in the reference genome can’t be analyzed. One study of 910 African individuals found that a total of 300 million DNA base pairs — 10% of the roughly three billion base pair reference genome — are not present in the previous linear reference but occur in at least one of the 910 individuals.

To address this issue, the consortium used graph data structures, which are powerful for genomics because they can represent the sequences of many people simultaneously, which is needed to create a pangenome. Nodes in a graph genome contain the known set of sequences in a population, and paths through those nodes compactly describe the unique sequences of an individual’s DNA.

Schematic of a graph genome. Each color represents the sequence path of a different individual. Multiple paths passing through the same node indicate multiple individuals share that sequence, but some paths also show a single nucleotide variant (SNV), insertions, or deletions. Illustration credit Darryl Leja, National Human Genome Research Institute (NHGRI).

Actual graph genome for the major histocompatibility complex (MHC) region of the genome. Genes in MHC regions are essential to immune function and are associated with a person’s resistance and susceptibility to infectious disease and autoimmune disorders (e.g., ankylosing spondylitis and lupus). The graph shows the linear human genome reference (green) and different individual person’s sequence (gray).

Using graphs creates numerous challenges. They require reference sequences to be highly accurate and the development of new methods that can use their data structure as an input. However, new sequencing technologies (such as consensus sequencing and phased assembly methods) have driven exciting progress towards solving these problems.

Long-read sequencing technology, which reads larger pieces of the genome (10,000 to millions of DNA characters long) at a time, are essential to the creation of high quality reference sequences because larger pieces can be stitched together into assembled genomes more easily than the short pieces read out by earlier technologies. Short read sequencing reads pieces of the genome that are only 100 to 300 DNA characters long, but has been the highly scalable basis for high-throughput sequencing methods developed in the 2000s. Though long-read sequencing is newer and has advantages for reference genome creation, many informatics methods for short reads hadn’t been developed for long read technologies.


Evolving DeepVariant for error correction

Google initially developed DeepVariant, an open-source CNN variant caller framework that analyzes the short-read sequencing evidence of local regions of the genome. However, we were able to re-train DeepVariant to yield accurate analysis of Pacific Bioscience’s long-read data.

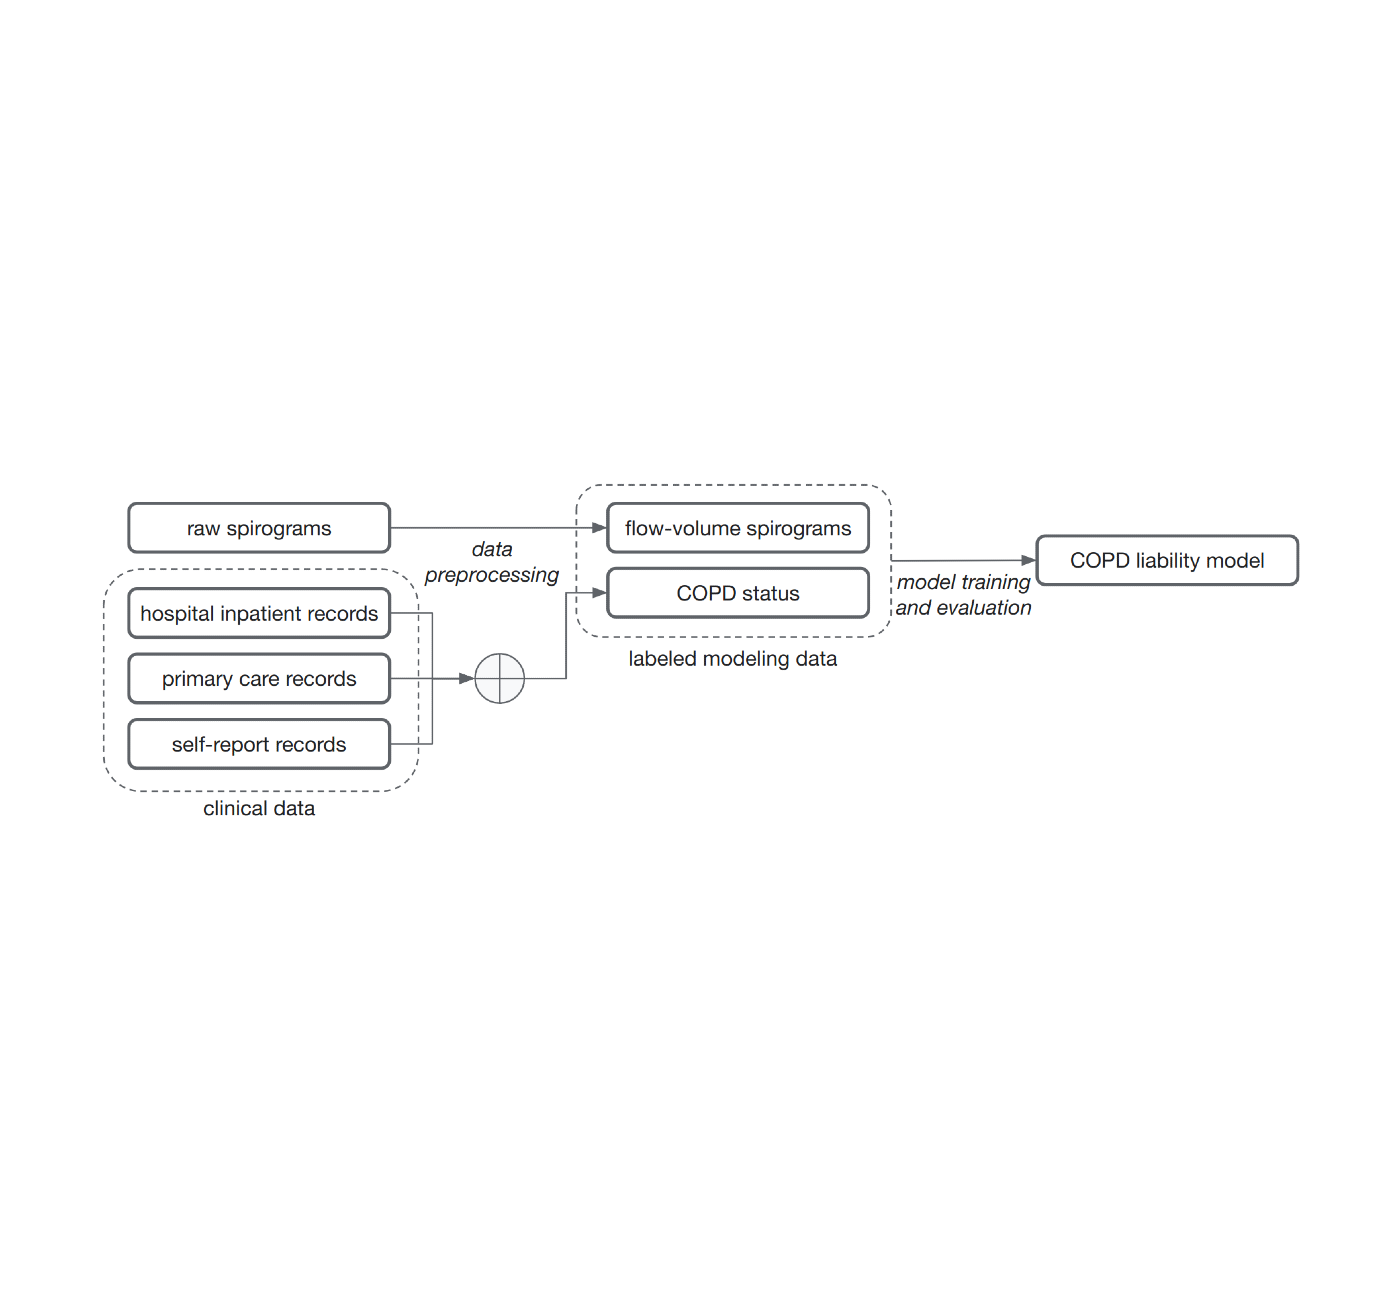
Training and evaluation schematic for DeepVariant.

We next teamed up with researchers at the University of California, Santa Cruz (UCSC) Genomics Institute to participate in a United States Food and Drug Administration competition for another long-read sequencing technology from Oxford Nanopore. Together, we won the award for highest accuracy in the nanopore category, with a single nucleotide variants (SNVs) accuracy that matched short-read sequencing. This work has been used to detect and treat genetic diseases in critically ill newborns. The use of DeepVariant on long-read technologies provided the foundation for the consortium’s use of DeepVariant for error correction of pangenomes.

DeepVariant’s ability to use multiple long-read sequencing modalities proved useful for error correction in the Telomere-to-Telomere (T2T) Consortium’s effort that generated the first complete assembly of a human genome. Completing this first genome set the stage to build the multiple reference genomes required for pangenomes, and T2T was already working closely with the Human Pangenome Project (with many shared members) to scale those practices.

With a set of high-quality human reference genomes on the horizon, developing methods that could use those assemblies grew in importance. We worked to adapt DeepVariant to use the pangenome developed by the consortium. In partnership with UCSC, we built an end-to-end analysis workflow for graph-based variant detection, and demonstrated improved accuracy across several thousand samples. The use of the pangenome allows many previously missed variants to be correctly identified.

Visualization of variant calls in the KCNE1 gene (a gene with variants associated with cardiac arrhythmias and sudden death) using a pangenome reference versus the prior linear reference. Each dot represents a variant call that is either correct (blue dot), incorrect (green dot) — when a variant is identified but is not really there —or a missed variant call (red dot). The top box shows variant calls made by DeepVariant using the pangenome reference while the bottom shows variant calls made by using the linear reference. Figure adapted from A Draft Human Pangenome Reference.


Improving pangenome sequences using transformers

Just as new sequencing technologies enabled new pangenome approaches, new informatics technologies enabled improvements for sequencing methods. Google adapted transformer architectures from analysis of human language to genome sequences to develop DeepConsensus. A key enabler for this was the development of a differentiable loss function that could handle the insertions and deletions common in sequencing data. This enabled us to have high accuracy without needing a decoder, allowing the speed required to keep up with terabytes of sequencer output.

Transformer architecture for DeepConsensus. DeepConsensus takes as input the repeated sequence of the DNA molecule, measured from fluorescent light detected by the addition of each base. DeepConsensus also uses as input the more detailed information about the sequencing process, including the duration of the light pulse (referred to here as pulse width or PW), the time between pulses (IP) the signal-to-noise ratio (SN) and which side of the double helix is being measured (strand).
Effect of alignment loss function in training evaluation of model output. Better accounting of insertions and deletions by a differentiable alignment function enables the model training process to better estimate errors.

DeepConsensus improves the yield and accuracy of instrument data. Because PacBio sequencing provides the primary sequence information for the 47 genome assemblies, we could apply DeepConsensus to improve those assemblies. With application of DeepConsensus, consortium members built a genome assembler that was able to reach 99.9997% assembly base-level accuracies.


Conclusion

We developed multiple new approaches to improve genetic sequencing methods, which we then used to construct pangenome references that enable more robust genome analysis.

But this is just the beginning of the story. In the next stage, a larger, worldwide group of scientists and clinicians will use this pangenome reference to study genetic diseases and make new drugs. And future pangenomes will represent even more individuals, realizing a vision summarized this way in a recent Nature story: “Every base, everywhere, all at once.” Read our post on the Keyword Blog to learn more about the human pangenome reference announcement.


Acknowledgements

Many people were involved in creating the pangenome reference, including 119 authors across 60 organizations, with the Human Pangenome Reference Consortium. This blog post highlights Google’s contributions to the broader work. We thank the research groups at UCSC Genomics Institute (GI) under Professors Benedict Paten and Karen Miga, genome polishing efforts of Arang Rhie at National Institute of Health (NIH), Genome Assembly and Polishing of Adam Phillipy’s group, and the standards group at National Institute of Standards and Technology (NIST) of Justin Zook. We thank Google contributors: Pi-Chuan Chang, Maria Nattestad, Daniel Cook, Alexey Kolesnikov, Anastaysia Belyaeva, and Gunjan Baid. We thank Lizzie Dorfman, Elise Kleeman, Erika Hayden, Cory McLean, Shravya Shetty, Greg Corrado, Katherine Chou, and Yossi Matias for their support, coordination, and leadership. Last but not least, thanks to the research participants that provided their DNA to help build the pangenome resource.

Source: Google AI Blog


An ML-based approach to better characterize lung diseases

The combination of the environment an individual experiences and their genetic predispositions determines the majority of their risk for various diseases. Large national efforts, such as the UK Biobank, have created large, public resources to better understand the links between environment, genetics, and disease. This has the potential to help individuals better understand how to stay healthy, clinicians to treat illnesses, and scientists to develop new medicines.

One challenge in this process is how we make sense of the vast amount of clinical measurements — the UK Biobank has many petabytes of imaging, metabolic tests, and medical records spanning 500,000 individuals. To best use this data, we need to be able to represent the information present as succinct, informative labels about meaningful diseases and traits, a process called phenotyping. That is where we can use the ability of ML models to pick up on subtle intricate patterns in large amounts of data.

We’ve previously demonstrated the ability to use ML models to quickly phenotype at scale for retinal diseases. Nonetheless, these models were trained using labels from clinician judgment, and access to clinical-grade labels is a limiting factor due to the time and expense needed to create them.

In “Inference of chronic obstructive pulmonary disease with deep learning on raw spirograms identifies new genetic loci and improves risk models”, published in Nature Genetics, we’re excited to highlight a method for training accurate ML models for genetic discovery of diseases, even when using noisy and unreliable labels. We demonstrate the ability to train ML models that can phenotype directly from raw clinical measurement and unreliable medical record information. This reduced reliance on medical domain experts for labeling greatly expands the range of applications for our technique to a panoply of diseases and has the potential to improve their prevention, diagnosis, and treatment. We showcase this method with ML models that can better characterize lung function and chronic obstructive pulmonary disease (COPD). Additionally, we show the usefulness of these models by demonstrating a better ability to identify genetic variants associated with COPD, improved understanding of the biology behind the disease, and successful prediction of outcomes associated with COPD.


ML for deeper understanding of exhalation

For this demonstration, we focused on COPD, the third leading cause of worldwide death in 2019, in which airway inflammation and impeded airflow can progressively reduce lung function. Lung function for COPD and other diseases is measured by recording an individual’s exhalation volume over time (the record is called a spirogram; see an example below). Although there are guidelines (called GOLD) for determining COPD status from exhalation, these use only a few, specific data points in the curve and apply fixed thresholds to those values. Much of the rich data from these spirograms is discarded in this analysis of lung function.

We reasoned that ML models trained to classify spirograms would be able to use the rich data present more completely and result in more accurate and comprehensive measures of lung function and disease, similar to what we have seen in other classification tasks like mammography or histology. We trained ML models to predict whether an individual has COPD using the full spirograms as inputs.

Spirometry and COPD status overview. Spirograms from lung function test showing a forced expiratory volume-time spirogram (left), a forced expiratory flow-time spirogram (middle), and an interpolated forced expiratory flow-volume spirogram (right). The profile of individuals w/o COPD is different.

The common method of training models for this problem, supervised learning, requires samples to be associated with labels. Determining those labels can require the effort of very time-constrained experts. For this work, to show that we do not necessarily need medically graded labels, we decided to use a variety of widely available sources of medical record information to create those labels without medical expert review. These labels are less reliable and noisy for two reasons. First, there are gaps in the medical records of individuals because they use multiple health services. Second, COPD is often undiagnosed, meaning many with the disease will not be labeled as having it even if we compile the complete medical records. Nonetheless, we trained a model to predict these noisy labels from the spirogram curves and treat the model predictions as a quantitative COPD liability or risk score.

Noisy COPD status labels were derived using various medical record sources (clinical data). A COPD liability model is then trained to predict COPD status from raw flow-volume spirograms.

Predicting COPD outcomes

We then investigated whether the risk scores produced by our model could better predict a variety of binary COPD outcomes (for example, an individual’s COPD status, whether they were hospitalized for COPD or died from it). For comparison, we benchmarked the model relative to expert-defined measurements required to diagnose COPD, specifically FEV1/FVC, which compares specific points on the spirogram curve with a simple mathematical ratio. We observed an improvement in the ability to predict these outcomes as seen in the precision-recall curves below.

Precision-recall curves for COPD status and outcomes for our ML model (green) compared to traditional measures. Confidence intervals are shown by lighter shading.

We also observed that separating populations by their COPD model score was predictive of all-cause mortality. This plot suggests that individuals with higher COPD risk are more likely to die earlier from any causes and the risk probably has implications beyond just COPD.

Survival analysis of a cohort of UK Biobank individuals stratified by their COPD model’s predicted risk quartile. The decrease of the curve indicates individuals in the cohort dying over time. For example, p100 represents the 25% of the cohort with greatest predicted risk, while p50 represents the 2nd quartile.

Identifying the genetic links with COPD

Since the goal of large scale biobanks is to bring together large amounts of both phenotype and genetic data, we also performed a test called a genome-wide association study (GWAS) to identify the genetic links with COPD and genetic predisposition. A GWAS measures the strength of the statistical association between a given genetic variant — a change in a specific position of DNA — and the observations (e.g., COPD) across a cohort of cases and controls. Genetic associations discovered in this manner can inform drug development that modifies the activity or products of a gene, as well as expand our understanding of the biology for a disease.

We showed with our ML-phenotyping method that not only do we rediscover almost all known COPD variants found by manual phenotyping, but we also find many novel genetic variants significantly associated with COPD. In addition, we see good agreement on the effect sizes for the variants discovered by both our ML approach and the manual one (R2=0.93), which provides strong evidence for validity of the newly found variants.

Left: A plot comparing the statistical power of genetic discovery using the labels for our ML model (y-axis) with the statistical power of the manual labels from a traditional study (x-axis). A value above the y = x line indicates greater statistical power in our method. Green points indicate significant findings in our method that are not found using the traditional approach. Orange points are significant in the traditional approach but not ours. Blue points are significant in both. Right: Estimates of the association effect between our method (y-axis) and traditional method (x-axis). Note that the relative values between studies are comparable but the absolute numbers are not.

Finally, our collaborators at Harvard Medical School and Brigham and Women’s Hospital further examined the plausibility of these findings by providing insights into the possible biological role of the novel variants in development and progression of COPD (you can see more discussion on these insights in the paper).


Conclusion

We demonstrated that our earlier methods for phenotyping with ML can be expanded to a wide range of diseases and can provide novel and valuable insights. We made two key observations by using this to predict COPD from spirograms and discovering new genetic insights. First, domain knowledge was not necessary to make predictions from raw medical data. Interestingly, we showed the raw medical data is probably underutilized and the ML model can find patterns in it that are not captured by expert-defined measurements. Second, we do not need medically graded labels; instead, noisy labels defined from widely available medical records can be used to generate clinically predictive and genetically informative risk scores. We hope that this work will broadly expand the ability of the field to use noisy labels and will improve our collective understanding of lung function and disease.


Acknowledgments

This work is the combined output of multiple contributors and institutions. We thank all contributors: Justin Cosentino, Babak Alipanahi, Zachary R. McCaw, Cory Y. McLean, Farhad Hormozdiari (Google), Davin Hill (Northeastern University), Tae-Hwi Schwantes-An and Dongbing Lai (Indiana University), Brian D. Hobbs and Michael H. Cho (Brigham and Women’s Hospital, and Harvard Medical School). We also thank Ted Yun and Nick Furlotte for reviewing the manuscript, Greg Corrado and Shravya Shetty for support, and Howard Yang, Kavita Kulkarni, and Tammi Huynh for helping with publication logistics.

Source: Google AI Blog


Google Research, 2022 & beyond: Natural sciences


(This is Part 7 in our series of posts covering different topical areas of research at Google. You can find other posts in the series here.)

It's an incredibly exciting time to be a scientist. With the amazing advances in machine learning (ML) and quantum computing, we now have powerful new tools that enable us to act on our curiosity, collaborate in new ways, and radically accelerate progress toward breakthrough scientific discoveries.

Since joining Google Research eight years ago, I’ve had the privilege of being part of a community of talented researchers fascinated by applying cutting-edge computing to push the boundaries of what is possible in applied science. Our teams are exploring topics across the physical and natural sciences. So, for this year’s blog post I want to focus on high-impact advances we’ve made recently in the fields of biology and physics, from helping to organize the world’s protein and genomics information to benefit people's lives to improving our understanding of the nature of the universe with quantum computers. We are inspired by the great potential of this work.


Using machine learning to unlock mysteries in biology

Many of our researchers are fascinated by the extraordinary complexity of biology, from the mysteries of the brain, to the potential of proteins, and to the genome, which encodes the very language of life. We’ve been working alongside scientists from other leading organizations around the world to tackle important challenges in the fields of connectomics, protein function prediction, and genomics, and to make our innovations accessible and useful to the greater scientific community.


Neurobiology

One exciting application of our Google-developed ML methods was to explore how information travels through the neuronal pathways in the brains of zebrafish, which provides insight into how the fish engage in social behavior like swarming. In collaboration with researchers from the Max Planck Institute for Biological Intelligence, we were able to computationally reconstruct a portion of zebrafish brains imaged with 3D electron microscopy — an exciting advance in the use of imaging and computational pipelines to map out the neuronal circuitry in small brains, and another step forward in our long-standing contributions to the field of connectomics.

Reconstruction of the neural circuitry of a larval zebrafish brain, courtesy of the Max Planck Institute for Biological Intelligence.

The technical advances necessary for this work will have applications even beyond neuroscience. For example, to address the difficulty of working with such large connectomics datasets, we developed and released TensorStore, an open-source C++ and Python software library designed for storage and manipulation of n-dimensional data. We look forward to seeing the ways it is used in other fields for the storage of large datasets.

We're also using ML to shed light on how human brains perform remarkable feats like language by comparing human language processing and autoregressive deep language models (DLMs). For this study, a collaboration with colleagues at Princeton University and New York University Grossman School of Medicine, participants listened to a 30-minute podcast while their brain activity was recorded using electrocorticography. The recordings suggested that the human brain and DLMs share computational principles for processing language, including continuous next-word prediction, reliance on contextual embeddings, and calculation of post-onset surprise based on word match (we can measure how surprised the human brain is by the word, and correlate that surprise signal with how well the word is predicted by the DLM). These results provide new insights into language processing in the human brain, and suggest that DLMs can be used to reveal valuable insights about the neural basis of language.


Biochemistry

ML has also allowed us to make significant advances in understanding biological sequences. In 2022, we leveraged recent advances in deep learning to accurately predict protein function from raw amino acid sequences. We also worked in close collaboration with the European Molecular Biology Laboratory's European Bioinformatics Institute (EMBL-EBI) to carefully assess model performance and add hundreds of millions of functional annotations to the public protein databases UniProt, Pfam/InterPro, and MGnify. Human annotation of protein databases can be a laborious and slow process and our ML methods enabled a giant leap forward — for example, increasing the number of Pfam annotations by a larger number than all other efforts during the past decade combined. The millions of scientists worldwide who access these databases each year can now use our annotations for their research.

Google Research contributions to Pfam exceed in size all expansion efforts made to the database over the last decade.

Although the first draft of the human genome was released in 2003, it was incomplete and had many gaps due to technical limitations in the sequencing technologies. In 2022 we celebrated the remarkable achievements of the Telomere-2-Telomere (T2T) Consortium in resolving these previously unavailable regions — including five full chromosome arms and nearly 200 million base pairs of novel DNA sequences — which are interesting and important for questions of human biology, evolution, and disease. Our open source genomics variant caller, DeepVariant, was one of the tools used by the T2T Consortium to prepare their release of a complete 3.055 billion base pair sequence of a human genome. The T2T Consortium is also using our newer open source method DeepConsensus, which provides on-device error correction for Pacific Biosciences long-read sequencing instruments, in their latest research toward comprehensive pan-genome resources that can represent the breadth of human genetic diversity.


Using quantum computing for new physics discoveries

When it comes to making scientific discoveries, quantum computing is still in its infancy, but has a lot of potential. We’re exploring ways of advancing the capabilities of quantum computing so that it can become a tool for scientific discovery and breakthroughs. In collaboration with physicists from around the world, we are also starting to use our existing quantum computers to create interesting new experiments in physics.

As an example of such experiments, consider the problem where a sensor measures something, and a computer then processes the data from the sensor. Traditionally, this means the sensor’s data is processed as classical information on our computers. Instead, one idea in quantum computing is to directly process quantum data from sensors. Feeding data from quantum sensors directly to quantum algorithms without going through classical measurements may provide a large advantage. In a recent Science paper written in collaboration with researchers from multiple universities, we show that quantum computing can extract information from exponentially fewer experiments than classical computing, as long as the quantum computer is coupled directly to the quantum sensors and is running a learning algorithm. This “quantum machine learning” can yield an exponential advantage in dataset size, even with today’s noisy intermediate-scale quantum computers. Because experimental data is often the limiting factor in scientific discovery, quantum ML has the potential to unlock the vast power of quantum computers for scientists. Even better, the insights from this work are also applicable to learning on the output of quantum computations, such as the output of quantum simulations that may otherwise be difficult to extract.

Even without quantum ML, a powerful application of quantum computers is to experimentally explore quantum systems that would be otherwise impossible to observe or simulate. In 2022, the Quantum AI team used this approach to observe the first experimental evidence of multiple microwave photons in a bound state using superconducting qubits. Photons typically do not interact with one another, and require an additional element of non-linearity to cause them to interact. The results of our quantum computer simulations of these interactions surprised us — we thought the existence of these bound states relied on fragile conditions, but instead we found that they were robust even to relatively strong perturbations that we applied.

Occupation probability versus discrete time step for n-photon bound states. We observe that the majority of the photons (darker colors) remain bound together.

Given the initial successes we have had in applying quantum computing to make physics breakthroughs, we are hopeful about the possibility of this technology to enable future groundbreaking discoveries that could have as significant a societal impact as the creation of transistors or GPS. The future of quantum computing as a scientific tool is exciting!


Acknowledgements

I would like to thank everyone who worked hard on the advances described in this post, including the Google Applied Sciences, Quantum AI, Genomics and Brain teams and their collaborators across Google Research and externally. Finally, I would like to thank the many Googlers who provided feedback in the writing of this post, including Lizzie Dorfman, Erica Brand, Elise Kleeman, Abe Asfaw, Viren Jain, Lucy Colwell, Andrew Carroll, Ariel Goldstein and Charina Chou.

Top


Google Research, 2022 & beyond

This was the seventh blog post in the “Google Research, 2022 & Beyond” series. Other posts in this series are listed in the table below:


Source: Google AI Blog


Digitizing Smell: Using Molecular Maps to Understand Odor

Did you ever try to measure a smell? …Until you can measure their likenesses and differences you can have no science of odor. If you are ambitious to found a new science, measure a smell.
— Alexander Graham Bell, 1914.

How can we measure a smell? Smells are produced by molecules that waft through the air, enter our noses, and bind to sensory receptors. Potentially billions of molecules can produce a smell, so figuring out which ones produce which smells is difficult to catalog or predict. Sensory maps can help us solve this problem. Color vision has the most familiar examples of these maps, from the color wheel we each learn in primary school to more sophisticated variants used to perform color correction in video production. While these maps have existed for centuries, useful maps for smell have been missing, because smell is a harder problem to crack: molecules vary in many more ways than photons do; data collection requires physical proximity between the smeller and smell (we don’t have good smell “cameras” and smell “monitors”); and the human eye only has three sensory receptors for color while the human nose has > 300 for odor. As a result, previous efforts to produce odor maps have failed to gain traction.

In 2019, we developed a graph neural network (GNN) model that began to explore thousands of examples of distinct molecules paired with the smell labels that they evoke, e.g., “beefy”, “floral”, or “minty”, to learn the relationship between a molecule’s structure and the probability that such a molecule would have each smell label. The embedding space of this model contains a representation of each molecule as a fixed-length vector describing that molecule in terms of its odor, much as the RGB value of a visual stimulus describes its color.

Left: An example of a color map (CIE 1931) in which coordinates can be directly translated into values for hue and saturation. Similar colors lie near each other, and specific wavelengths of light (and combinations thereof) can be identified with positions on the map. Right: Odors in the Principal Odor Map operate similarly. Individual molecules correspond to points (grey), and the locations of these points reflect predictions of their odor character.

Today we introduce the “Principal Odor Map” (POM), which identifies the vector representation of each odorous molecule in the model’s embedding space as a single point in a high-dimensional space. The POM has the properties of a sensory map: first, pairs of perceptually similar odors correspond to two nearby points in the POM (by analogy, red is nearer to orange than to green on the color wheel). Second, the POM enables us to predict and discover new odors and the molecules that produce them. In a series of papers, we demonstrate that the map can be used to prospectively predict the odor properties of molecules, understand these properties in terms of fundamental biology, and tackle pressing global health problems. We discuss each of these promising applications of the POM and how we test them below.

Test 1: Challenging the Model with Molecules Never Smelled Before
First, we asked if the underlying model could correctly predict the odors of new molecules that no one had ever smelled before and that were very different from molecules used during model development. This is an important test — many models perform well on data that looks similar to what the model has seen before, but break down when tested on novel cases.

To test this, we collected the largest ever dataset of odor descriptions for novel molecules. Our partners at the Monell Center trained panelists to rate the smell of each of 400 molecules using 55 distinct labels (e.g., “minty”) that were selected to cover the space of possible smells while being neither redundant nor too sparse. Unsurprisingly, we found that different people had different characterizations of the same molecule. This is why sensory research typically uses panels of dozens or hundreds of people and highlights why smell is a hard problem to solve. Rather than see if the model could match any one person, we asked how close it was to the consensus: the average across all of the panelists. We found that the predictions of the model were closer to the consensus than the average panelist was. In other words, the model demonstrated an exceptional ability to predict odor from a molecule’s structure.

Predictions made by two models, our GNN model (orange) and a baseline chemoinformatic random forest (RF) model (blue), compared with the mean ratings given by trained panelists (green) for the molecule 2,3-dihydrobenzofuran-5-carboxaldehyde. Each bar corresponds to one odor character label (with only the top 17 of 55 shown for clarity). The top five are indicated in color; our model correctly identifies four of the top five, with high confidence, vs. only three of five, with low confidence, for the RF model. The correlation (R) to the full set of 55 labels is also higher in our model.
Unlike alternative benchmark models (RF and nearest-neighbor models trained on various sets of chemoinformatic features), our GNN model outperforms the median human panelist at predicting the panel mean rating. In other words, our GNN model better reflects the panel consensus than the typical panelist.

The POM also exhibited state-of-the-art performance on alternative human olfaction tasks like detecting the strength of a smell or the similarity of different smells. Thus, with the POM, it should be possible to predict the odor qualities of any of billions of as-yet-unknown odorous molecules, with broad applications to flavor and fragrance.

Test 2: Linking Odor Quality Back to Fundamental Biology
Because the Principal Odor Map was useful in predicting human odor perception, we asked whether it could also predict odor perception in animals, and the brain activity that underlies it. We found that the map could successfully predict the activity of sensory receptors, neurons, and behavior in most animals that olfactory neuroscientists have studied, including mice and insects.

What common feature of the natural world makes this map applicable to species separated by hundreds of millions of years of evolution? We realized that the common purpose of the ability to smell might be to detect and discriminate between metabolic states, i.e., to sense when something is ripe vs. rotten, nutritious vs. inert, or healthy vs. sick. We gathered data about metabolic reactions in dozens of species across the kingdoms of life and found that the map corresponds closely to metabolism itself. When two molecules are far apart in odor, according to the map, a long series of metabolic reactions is required to convert one to the other; by contrast, similarly smelling molecules are separated by just one or a few reactions. Even long reaction pathways containing many steps trace smooth paths through the map. And molecules that co-occur in the same natural substances (e.g., an orange) are often very tightly clustered on the map. The POM shows that olfaction is linked to our natural world through the structure of metabolism and, perhaps surprisingly, captures fundamental principles of biology.

Left: We aggregated metabolic reactions found in 17 species across 4 kingdoms to construct a metabolic graph. In this illustration, each circle is a distinct metabolite molecule and an arrow indicates that there is a metabolic reaction that converts one molecule to another. Some metabolites have an odor (color) and others do not (gray), and the metabolic distance between two odorous metabolites is the minimum number of reactions necessary to convert one into the other. In the path shown in bold, the distance is 3. Right: Metabolic distance was highly correlated with distance in the POM, an estimate of perceived odor dissimilarity.

Test 3: Extending the Model to Tackle a Global Health Challenge
A map of odor that is tightly connected to perception and biology across the animal kingdom opens new doors. Mosquitos and other insect pests are drawn to humans in part by their odor perception. Since the POM can be used to predict animal olfaction generally, we retrained it to tackle one of humanity’s biggest problems, the scourge of diseases transmitted by mosquitoes and ticks, which kill hundreds of thousands of people each year.

For this purpose, we improved our original model with two new sources of data: (1) a long-forgotten set of experiments conducted by the USDA on human volunteers beginning 80 years ago and recently made discoverable by Google Books, which we subsequently made machine-readable; and (2) a new dataset collected by our partners at TropIQ, using their high-throughput laboratory mosquito assay. Both datasets measure how well a given molecule keeps mosquitos away. Together, the resulting model can predict the mosquito repellency of nearly any molecule, enabling a virtual screen over huge swaths of molecular space. We validated this screen experimentally using entirely new molecules and found over a dozen of them with repellency at least as high as DEET, the active ingredient in most insect repellents. Less expensive, longer lasting, and safer repellents can reduce the worldwide incidence of diseases like malaria, potentially saving countless lives.

We digitized USDA mosquito repellency data for thousands of molecules previously scanned by Google Books, and used it to refine the learned representation (the map) at the heart of the model. We added additional layers, specifically to predict repellency in a mosquito feeder assay, and iteratively trained the model to improve assay predictions while running computational screens for candidate repellents.
Many molecules showing mosquito repellency in the laboratory assay also showed repellency when applied to humans. Several showed repellency greater than the most common repellents used today (DEET and picaridin).

The Road Ahead
We discovered that our modeling approach to smell prediction could be used to draw a Principal Odor Map for tackling odor-related problems more generally. This map was the key to measuring smell: it answered a range of questions about novel smells and the molecules that produce them, it connected smells back to their origins in evolution and the natural world, and it is helping us tackle important human-health challenges that affect millions of people. Going forward, we hope that this approach can be used to find new solutions to problems in food and fragrance formulation, environmental quality monitoring, and the detection of human and animal diseases.

Acknowledgements
This work was performed by the ML olfaction research team, including Benjamin Sanchez-Lengeling, Brian K. Lee, Jennifer N. Wei, Wesley W. Qian, and Jake Yasonik (the latter two were partly supported by the Google Student Researcher program) and our external partners including Emily Mayhew and Joel D. Mainland from the Monell Center, and Koen Dechering and Marnix Vlot from TropIQ. The Google Books team brought the USDA dataset online. Richard C. Gerkin was supported by the Google Visiting Faculty Researcher program and is also an Associate Research Professor at Arizona State University.

Source: Google AI Blog