A brief history of vaccination

Since at least the 1400s, people have looked for ways to protect themselves against infectious diseases. From the practice of “variolation” in the 15th century to today’s mRNA vaccines, immunization has a long history. Integral to that history has been the World Health Organization (WHO), whose global vaccine drives through the 20th and 21st centuries have played such a crucial role in reducing serious illness. For World Immunization Week, WHO has teamed up with Google Arts & Culture and scientific institutions from around the world to bring this history vividly to life with A Brief History of Vaccination.

From insufflation to vaccination

Looking back at the history of vaccination, with detailed stories drawn from medical archives, you’ll discover how we arrived at the jabs that have saved lives across the world. While you’ll encounter famous pioneers like Lady Mary Wortley Montagu, Edward Jenner and Louis Pasteur, you’ll also learn that vaccination has a much older history. In 15th-century China, for instance, there existed the practice of “insufflation” — blowing dried smallpox scabs into the nostril with a pipe to prevent natural smallpox, which was far more dangerous.

It was in the 20th century that earlier discoveries really started to bear fruit. Smallpox was eradicated globally and vaccines for polio, measles, influenza, hepatitis B, meningitis and many other diseases were developed. It was also the century that saw the inauguration of the WHO and its vital “Expanded Programme on Immunization,”which opened up a truly global front against vaccine-preventable diseases. A Brief History of Vaccination helps you to experience these great advances through photos, archive footage and historic scientific documents.

There are also those whose stories aren’t so well known, but nevertheless deserve to be told. You’ll learn about the enlightened Grand Duke of Tuscany who experimented with inoculation in the 18th century. Also featured here are the Mexican authorities whose efforts to defeat smallpox in the 19th century were ahead of their time.

Unfinished history

Of course, the struggle against infectious disease is ongoing. During the COVID-19 pandemic, new stories emerged of ingenuity and resilience against the odds. You’ll learn of the heroism of Spanish and British health workers, and the man from Uttarakhand who became a one-man ambulance service in the remote mountain villages of northern India.

As authorities and communities around the world have strived to contain the pandemic, it has become ever more apparent that education is key to any successful vaccination program. With this in mind, educators can find a clear and accessible lesson plan that will provide learners with useful information about vaccination history.

Through A Brief History of Vaccination we learn, above all, that our fight against infectious diseases has united people across continents and cultures. As Louis Pasteur observed, “Science knows no country, because knowledge belongs to humanity, and is the torch which illuminates the world.”

Meet 11 startups working to combat climate change

We believe that technology and entrepreneurship can help avert the world’s climate crisis. Startup founders are using tools — from machine learning to mobile platforms to large scale data processing — to accelerate the change to a low-carbon economy. As part ofGoogle’s commitment to address climate change, we’ll continue to invest in the technologists and entrepreneurs who are working to build climate solutions.

So this Earth Day, we’re announcing the second Google for Startups Accelerator: Climate Change cohort. This ten-week program consists of intensive workshops and expert mentorship designed to help growth-stage, sustainability-focused startups learn technical, product and leadership best practices. Meet the 11 selected startups using technology to better our planet:

  • AmpUpin Cupertino, California: AmpUp is an electric vehicle (EV) software company and network provider that helps drivers, hosts, and fleets to charge stress-free.
  • Carbon Limitin Boca Raton, Florida: Carbon Limit transforms concrete into a CO2 sponge with green cement nanotechnology, turning roads and buildings into permanent CO2 solutions.
  • ChargeNet Stationsin Los Angeles, California: ChargeNet Stations aims to make charging accessible and convenient in all communities, preventing greenhouse gas emissions through use of PV + storage.
  • ChargerHelp!In Los Angeles, California: ChargerHelp! provides on-demand repair of electric vehicle charging stations, while also building out local workforces, removing barriers and creating economic mobility within all communities.
  • CO-Zin Boulder, Colorado: CO-Z accelerates electricity decarbonization and empowers renters, homeowners and businesses with advanced control, automated savings and power failure protection.
  • Community Energy Labsin Portland, Oregon: Community Energy Labs uses artificial intelligence to make smart energy management and decarbonization both accessible and affordable for community building owners.
  • Moment Energyin Vancouver, British Columbia: Moment Energy repurposes retired electric vehicle (EV) batteries to provide clean, affordable and reliable energy storage.
  • Mi Terroin City of Industry, California: Mi Terro is a synthetic biology and advanced material company that creates home compostable, plastic-alternative biomaterials made from plant-based agricultural waste.
  • Nithioin Washington, DC: Nithio is an AI-driven platform for clean energy investment that standardizes credit risk to catalyze capital to address climate change and achieve universal energy access.
  • Re Companyin New York City, New York: Re Company is a reusable packaging subscription service that supplies reuse systems with optimally designed containers and cycles them back into the supply chain at end of life.
  • Understoryin Pacific Grove, California: Understory rapidly monitors and quantifies discrete landscape changes to mitigate the effects of environmental change and deliver actionable information for land management, habitat conservation and climate risk assessment.

When the program kicks off this summer, startups will receive mentoring and technical support tailored to their business through a mix of one-to-one and one-to-many learning sessions, both remotely and in-person, from Google engineers and external experts. Stay tuned on Google for Startups social channels to see their experience unfold over the next three months.

Learn more about Google for Startups Accelerator here, and the latest on Google’s commitment to sustainability here.

Pix2Seq: A New Language Interface for Object Detection

Object detection is a long-standing computer vision task that attempts to recognize and localize all objects of interest in an image. The complexity arises when trying to identify or localize all object instances while also avoiding duplication. Existing approaches, like Faster R-CNN and DETR, are carefully designed and highly customized in the choice of architecture and loss function. This specialization of existing systems has created two major barriers: (1) it adds complexity in tuning and training the different parts of the system (e.g., region proposal network, graph matching with GIOU loss, etc.), and (2), it can reduce the ability of a model to generalize, necessitating a redesign of the model for application to other tasks.

In “Pix2Seq: A Language Modeling Framework for Object Detection”, published at ICLR 2022, we present a simple and generic method that tackles object detection from a completely different perspective. Unlike existing approaches that are task-specific, we cast object detection as a language modeling task conditioned on the observed pixel inputs. We demonstrate that Pix2Seq achieves competitive results on the large-scale object detection COCO dataset compared to existing highly-specialized and well-optimized detection algorithms, and its performance can be further improved by pre-training the model on a larger object detection dataset. To encourage further research in this direction, we are also excited to release to the broader research community Pix2Seq’s code and pre-trained models along with an interactive demo.

Pix2Seq Overview
Our approach is based on the intuition that if a neural network knows where and what the objects in an image are, one could simply teach it how to read them out. By learning to “describe” objects, the model can learn to ground the descriptions on pixel observations, leading to useful object representations. Given an image, the Pix2Seq model outputs a sequence of object descriptions, where each object is described using five discrete tokens: the coordinates of the bounding box’s corners [ymin, xmin, ymax, xmax] and a class label.

Pix2Seq framework for object detection. The neural network perceives an image, and generates a sequence of tokens for each object, which correspond to bounding boxes and class labels.

With Pix2Seq, we propose a quantization and serialization scheme that converts bounding boxes and class labels into sequences of discrete tokens (similar to captions), and leverage an encoder-decoder architecture to perceive pixel inputs and generate the sequence of object descriptions. The training objective function is simply the maximum likelihood of tokens conditioned on pixel inputs and the preceding tokens.

Sequence Construction from Object Descriptions
In commonly used object detection datasets, images have variable numbers of objects, represented as sets of bounding boxes and class labels. In Pix2Seq, a single object, defined by a bounding box and class label, is represented as [ymin, xmin, ymax, xmax, class]. However, typical language models are designed to process discrete tokens (or integers) and are unable to comprehend continuous numbers. So, instead of representing image coordinates as continuous numbers, we normalize the coordinates between 0 and 1 and quantize them into one of a few hundred or thousand discrete bins. The coordinates are then converted into discrete tokens as are the object descriptions, similar to image captions, which in turn can then be interpreted by the language model. The quantization process is achieved by multiplying the normalized coordinate (e.g., ymin) by the number of bins minus one, and rounding it to the nearest integer (the detailed process can be found in our paper).

Quantization of the coordinates of the bounding boxes with different numbers of bins on a 480 × 640 image. With a small number of bins/tokens, such as 500 bins (∼1 pixel/bin), it achieves high precision even for small objects.

After quantization, the object annotations provided with each training image are ordered into a sequence of discrete tokens (shown below). Since the order of the objects does not matter for the detection task per se, we randomize the order of objects each time an image is shown during training. We also append an End of Sequence (EOS) token at the end as​​ different images often have different numbers of objects, and hence sequence lengths.

The bounding boxes and class labels for objects detected in the image on the left are represented in the sequences shown on the right. A random object ordering strategy is used in our work but other approaches to ordering could also be used.

The Model Architecture, Objective Function, and Inference
We treat the sequences that we constructed from object descriptions as a “dialect” and address the problem via a powerful and general language model with an image encoder and autoregressive language encoder. Similar to language modeling, Pix2Seq is trained to predict tokens, given an image and preceding tokens, with a maximum likelihood loss. At inference time, we sample tokens from model likelihood. The sampled sequence ends when the EOS token is generated. Once the sequence is generated, we split it into chunks of 5 tokens for extracting and de-quantizing the object descriptions (i.e., obtaining the predicted bounding boxes and class labels). It is worth noting that both the architecture and loss function are task-agnostic in that they don’t assume prior knowledge about object detection (e.g., bounding boxes). We describe how we can incorporate task-specific prior knowledge with a sequence augmentation technique in our paper.

Results
Despite its simplicity, Pix2Seq achieves impressive empirical performance on benchmark datasets. Specifically, we compare our method with well established baselines, Faster R-CNN and DETR, on the widely used COCO dataset and demonstrate that it achieves competitive average precision (AP) results.

Pix2Seq achieves competitive AP results compared to existing systems that require specialization during model design, while being significantly simpler. The best performing Pix2Seq model achieved an AP score of 45.

Since our approach incorporates minimal inductive bias or prior knowledge of the object detection task into the model design, we further explore how pre-training the model using the large-scale object detection COCO dataset can impact its performance. Our results indicate that this training strategy (along with using bigger models) can further boost performance.

The average precision of the Pix2Seq model with pre-training followed by fine-tuning. The best performing Pix2Seq model without pre-training achieved an AP score of 45. When the model is pre-trained, we see an 11% improvement with an AP score of 50.

Pix2Seq can detect objects in densely populated and complex scenes, such as those shown below.

Example complex and densely populated scenes labeled by a trained Pix2Seq model. Try it out here.

Conclusion and Future Work
With Pix2Seq, we cast object detection as a language modeling task conditioned on pixel inputs for which the model architecture and loss function are generic, and have not been engineered specifically for the detection task. One can, therefore, readily extend this framework to different domains or applications, where the output of the system can be represented by a relatively concise sequence of discrete tokens (e.g., keypoint detection, image captioning, visual question answering), or incorporate it into a perceptual system supporting general intelligence, for which it provides a language interface to a wide range of vision and language tasks. We also hope that the release of our Pix2Seq’s code, pre-trained models and interactive demo will inspire further research in this direction.

Acknowledgements
This post reflects the combined work with our co-authors: Saurabh Saxena, Lala Li, Geoffrey Hinton. We would also like to thank Tom Small for the visualization of the Pix2Seq illustration figure.

Source: Google AI Blog


Get more out of the Google app

There’s a lot you can do with the Google app – from immersing yourself in 3D augmented reality to sending a message to loved ones and searching for fashion inspiration. Here are a few of our favorite ways to use the Google app for Android and iOS to search for information and get things done through text, your voice or even your phone’s camera.

Go beyond the search box

With the Google app, you can go beyond using text to find information and inspiration in a variety of helpful and innovative ways. For example, you can:

  • Search with text and images at the same time: With multisearch in Lens, you can now use text and images at the same time to search for those hard to express queries. To get started, simply open up the Google app on Android or iOS, tap the Lens camera icon and either search one of your screenshots or snap a photo of the world around you, like the stylish orange dress that you actually want in green. Then, swipe up and tap the "+ Add to your search" button to add text.
  • Speak – or hum! – to Search: In addition to searching with your camera, you can also use your voice to search on the Google app instead of typing. Just tap the mic icon and say whatever it is you want to search for on Google. What about if you can’t remember the name of a song or the words, but the tune is stuck in your head? The Google app can help you figure it out. Tap the mic icon and say, “What's this song?” or click the “Search a song” button. Then start humming, whistling or singing for 10-15 seconds. Don’t worry, you don’t need perfect pitch to use this feature!
A gif showing the "Hum to Search" feature in action.
  • Keep up with your interests: With Discover, you can get updates for your interests, like your favorite sports teams, celebrities, fitness routines, and more. If you have personal results enabled, you can follow and unfollow topics and browse through a visual and immersive set of stories and updates tailored to your interests. You can read more about how to customize what you find in Discover on our support page. And you can save links, images, and places from Google search results to Collections within the app to easily find them later.

Stay organized and save time

With the Google app, you can knock out important tasks quickly and easily to take your productivity to the next level.

  • Keep your calendar updated: You can create Calendar events using Google Assistant, and also see Calendar updates, like important meetings that are upcoming. You can also get notifications when it’s time to leave for your event.
  • Copy your handwritten notes: If you’ve taken notes on paper, you can use Lens to quickly copy and paste the text to your phone, or to another signed-in device with Chrome like your computer. No more retyping those handwritten notes!
A gif showing Google Lens copying handwritten notes into text.
  • Make calls and texts: Want to get in touch with someone quickly? The Google app lets you use Google Assistant to send messages (or make calls) with your voice – no need to even open up your texts to type something out.
  • Simplify your checkout: Forgot to order a cooler for your upcoming camping trip? With the Google app, you can autofill saved info – like your addresses or payment info – for a seamless checkout.

Learn new facts, concepts and skills

There are many ways you can use the Google app to help you learn new things – immersing yourself in new concepts and getting help breaking down complex problems.

  • Translate: Learning a new language, or did you come across a photo with text in another language? Lens can translate more than 100 languages, such as Spanish and Arabic, and you can tap to hear words and sentences pronounced out loud.
Gif showing lens assisting with translation of Chinese text.
  • Get homework help: You can use Lens to get help on a homework problem. With step-by-step guides and videos, you can learn and understand the foundational concepts to solve math, chemistry, biology and physics problems.
  • Immerse yourself in AR: Augmented reality is also a powerful tool for visual learning. With Lens, you can view and interact with 3D objects and concepts – from animals, to STEM concepts, to world monuments, to your favorite athletes – right from Search. Placing these 3D objects directly into your own space can give you a sense of scale and detail.
Image showing animals in augmented reality.

The Google app offers the best way to search – enabling you to go beyond the search box to uncover new information, enhance your productivity, and have fun along the way.

Chrome Dev for Android Update

Hi everyone! We've just released Chrome Dev 102 (102.0.5005.9) for Android. It's now available on Google Play.

You can see a partial list of the changes in the Git log. For details on new features, check out the Chromium blog, and for details on web platform updates, check here.

If you find a new issue, please let us know by filing a bug.

Erhu Akpobaro
Google Chrome

Dev Channel Update for ChromeOS

The Dev channel is being updated to 102.0.5005.6 (Platform version: 14695.11.0) for most ChromeOS devices.


If you find new issues, please let us know by visiting our forum or filing a bug. Interested in switching channels Find out how. You can submit feedback using ‘Report an issue...’ in the Chrome menu (3 vertical dots in the upper right corner of the browser).


Cole Brown,
Google ChromeOS 

For Earth Day, an update on our commitments

In 2020, as part of our third decade of climate action, we established a bold set of goals to help build a carbon-free future for everyone. Today on Earth Day, we’re sharing recent progress we’ve made including new investments to help partners address climate change, product updates that allow everyone to make sustainable choices and highlights from our journey to net zero.

Helping our partners address climate change

To provide deeper insights into climate change data — like increased food insecurity, the nexus of health and climate and extreme weather events — we need to enable everyone to create solutions. We’ve continued to provide organizations, policymakers, researchers and more with the data, technology and resources they need to address climate change. Today we announced that Data Commons — our open-source platform built to organize public data and enable standardized, universal access to anyone — is now one of the world's largest knowledge graphs on sustainability. Data Commons has grown to include more than 100 data sources about the climate, health, food, crops, shelter, emissions and more.

Other initiatives we’ve recently announced to help partners include:

  • A Google.org Sustainability Seed Fund in Asia Pacific: This new $6 million fund provides organizations in areas experiencing the brunt of climate change with additional resources to address issues like air quality, water preservation and renewable energy access.
  • Our research shows, 75% of companies think technology will play a key role in their ability to reach sustainability goals: Our recent Google Cloud survey of nearly 1,500 executives across 16 countries found that sustainability tops business priorities, but few business leaders know how to begin or measure impact.
  • Helping build a free carbon calculator for businesses: For small and medium-sized enterprises (SMEs) finding the resources to measure and manage emissions is challenging. We partnered with the Sweden-based company Normative to provide funding and support to develop a free Business Carbon Calculator that is now available through the UN Race to Zero backed SME Climate Hub.

Helping everyone make more sustainable choices

Individuals are also looking for ways to take care of the planet. We’ve been looking at building more ways for our products to give people access to the information and tools needed to make more sustainable choices.

Today, when you go to Google.com, you’ll see timelapse imagery from Google Earth Timelapse and other environmental organizations that illustrates the effects of climate change. This is part of our ongoing efforts to spotlight the impact of climate disasters and help people learn what actions they can take to minimize the effects. Last October, we partnered with the United Nations to make it easier for people to find climate change information. When you search for ‘climate change’ in certain languages, you’ll see information panels and visuals on the causes and effects of climate change and individual actions they can take to live more sustainably. This was already available in English, French and Spanish, and today we expanded to include Arabic, Chinese, Indonesian, Italian, Japanese, Portuguese, Russian, Thai and Vietnamese.

Here are more ways our products are helping people make sustainable choices:

  • Saving energy with Nest: Since Nest launched its first smart thermostat over ten years ago, it has helped people save nearly 100 billion kilowatt-hours of energy — that’s enough energy to light up the entire planet for ten days! Now compatible Nest thermostats can do even more with Nest Renew, a thermostat service announced last year in the U.S. When Nest Renew customers take actions at home that save energy, they earn ‘Leafs’. Once customers reach Leaf milestones, they can vote to direct funds to one of our Energy Impact Program partners, Elevate and GRID Alternatives. These funds have gone toward energy-efficient upgrades to affordable housing in Chicago and the expansion of solar installation programs in California. Nest Renew is currently available in early preview, sign up to join the waitlist.
  • More sustainable transportation options: Over ten years ago, cycling directions came to Google Maps. Today, it’s available in over 30 countries. In 2021 alone we added over 170,000 kilometers of bike lanes and bikeable roads, bringing more options to people looking for sustainable transportation alternatives.

Building a carbon-free future at Google

Lastly, we’ve always believed that to enable others we need to be leaders in the way we address our impact on the planet. In October, we set a goal to achieve net-zero emissions across all of our operations and value chain, including our consumer hardware products, by 2030. We aim to reduce the majority of our emissions (versus our 2019 baseline) before 2030, and plan to invest in nature-based and technology-based carbon removal solutions to neutralize our remaining emissions.

We’ve recently shared more on how we’re driving toward net zero:

  • 24/7 carbon-free energy priorities: For emissions associated with powering our data centers and offices, we have an ambitious goal to operate on 24/7 carbon-free energy by 2030. This will require new technology to help with grid decarbonization, like our first-ever battery-based system for backup power at a hyperscale data center that is now operational in Belgium. Additionally, governments will need policies that speed up the transition to clean energy. Last week, we published a roadmap outlining policy priorities ​​that accelerate the decarbonization of electricity grids across the world and our commitment to advancing them.
  • Investing in carbon removals and carbon markets innovation: Beyond our value chain, we’ll build on our leadership in high-impact methane reduction and destruction projects. We’ll also invest in emerging companies developing technology-based and nature-based carbon removal solutions, like our recent $200 million limited partnership in Frontier. And we will help strengthen carbon markets through our Google.org contribution to Gold Standard’s digitization efforts and our $2 million contribution to the Integrity Council for the Voluntary Carbon Markets.

We all have to act now and act together if we’re going to avert the worst effects of climate change. At Google, one of the most powerful things we can do is build technology that allows us, partners and individuals to take meaningful action. We plan to continue this critical work and do what we can to protect the planet.

Data Commons: Making sustainability data accessible

At Google, we believe that giving everyone easy access to data can be revolutionary — especially when it comes to solving the world’s most pressing problems like climate change.

Take Google Maps for example. Before Google Maps, information — like satellite imagery, maps of roads and information about businesses — was found in different places. Google Maps brings all this helpful information together, so people can use it not only to navigate and explore the world with ease, but also to find solutions to problems facing their communities. We’ve seen people use Google Maps to help do everything from giving communities access to emergency food services to fighting the opioid crisis by highlighting drug drop-off centers.

Despite the critical urgency to combat the effects of climate change, finding data around sustainability is where mapping data was 15 years ago. It’s fragmented across thousands of silos, in a cacophony of schemas, and across a multitude of databases. In 2017, we started the Data Commons project to organize all this data to create standardized, universal access for consumers, journalists, policymakers and researchers. Today, Data Commons is one of the world's largest Knowledge Graphs on sustainability, spanning more than 100 new sources of data about climate, health, food, crops, shelter, emissions and more.

The graph contains nearly 3 billion time series across over 100,000 variables about 2.9 million places. Anyone can access, explore and understand this data using Google Search or our free dashboards and visualization tools. Or they can use our open and free APIs to build new tools based on this data. For enterprise customers, this data is available via Data Commons on the BigQuery Analytics Hub.

Illustration showing connecting dots and arrows that represent the data sources — including the Centers for Disease Control and Prevention, U.S. Census Bureau, National Aeronautics and Space Administration, World Bank and India Water Resources Information System.

The Data Commons Knowledge Graph is a single knowledge graph that includes more than 100 sources of sustainability data and more.

Connecting the dots on climate data

The effects of climate change are going to worsen food insecurity, health outcomes, economic inequities and other social issues. There is a dire need to create data-driven solutions that can mitigate these effects so we can take collective action. We’re working closely with the broader community — including universities, nonprofits and researchers — to use Data Commons to uncover insights and create solutions. Take a look at some of the work being done:

  • Temperature and health: Professor Arun Majumdar of Stanford University, who was also the Founding Director of the Advanced Research Projects Agency-Energy (ARPA-E), is using Data Commons to look at the intersection of temperature and human health. When humidity and temperature reach a critical threshold, the human body can no longer regulate its temperature. Arun and his team are identifying which places will reach this critical threshold first. With this information, local governments can take proactive steps to mitigate these effects, like building infrastructure that provides cooling to communities.
  • Water for everyone: Professor Balaraman Ravindran of the Indian Institute of Technology Madras is working with Data Commons to add India-based data on water quality. With this data, communities can get a better understanding of water use, quality, availability and more.
  • Understanding food scarcity challenges: Feeding America is a nationwide network of 200 member food banks serving tens of millions of people in need in the United States. Data from their annual Map the Meal Gap studyis accessible in Feeding America Data Commons so anyone can explore food security and how it intersects with variables like health, climate and education. For Feeding America, this data allows them to quickly identify U.S. locations where food insecurity is most exacerbated by other root causes of disparities and hardship.

Our quest to organize the world’s sustainability information

Climate change is a defining crisis of our time, but together we have the potential to curb its effects. At Google one of the ways we can continue to contribute to solving it is through our mission to organize information and make it easily accessible. Data Commons’ data and code is open source so anyone can use it, and it’s built collaboratively with the global community. Join us in using Data Commons to tackle climate change, and see other progress we’ve made toward the sustainability commitments we made as part of our third decade of climate action.

Beta Channel Update for ChromeOS

The Beta channel is being updated to 101.0.4951.41 (Platform version: 14588.67.0) for most ChromeOS devices.

If you find new issues, please let us know by visiting our forum or filing a bug. Interested in switching channels Find out how. You can submit feedback using ‘Report an issue...’ in the Chrome menu (3 vertical dots in the upper right corner of the browser).

Matt Nelson,
Google ChromeOS

Hidden Interfaces for Ambient Computing

As consumer electronics and internet-connected appliances are becoming more common, homes are beginning to embrace various types of connected devices that offer functionality like music control, voice assistance, and home automation. A graceful integration of devices requires adaptation to existing aesthetics and user styles rather than simply adding screens, which can easily disrupt a visual space, especially when they become monolithic surfaces or black screens when powered down or not actively used. Thus there is an increasing desire to create connected ambient computing devices and appliances that can preserve the aesthetics of everyday materials, while providing on-demand access to interaction and digital displays.

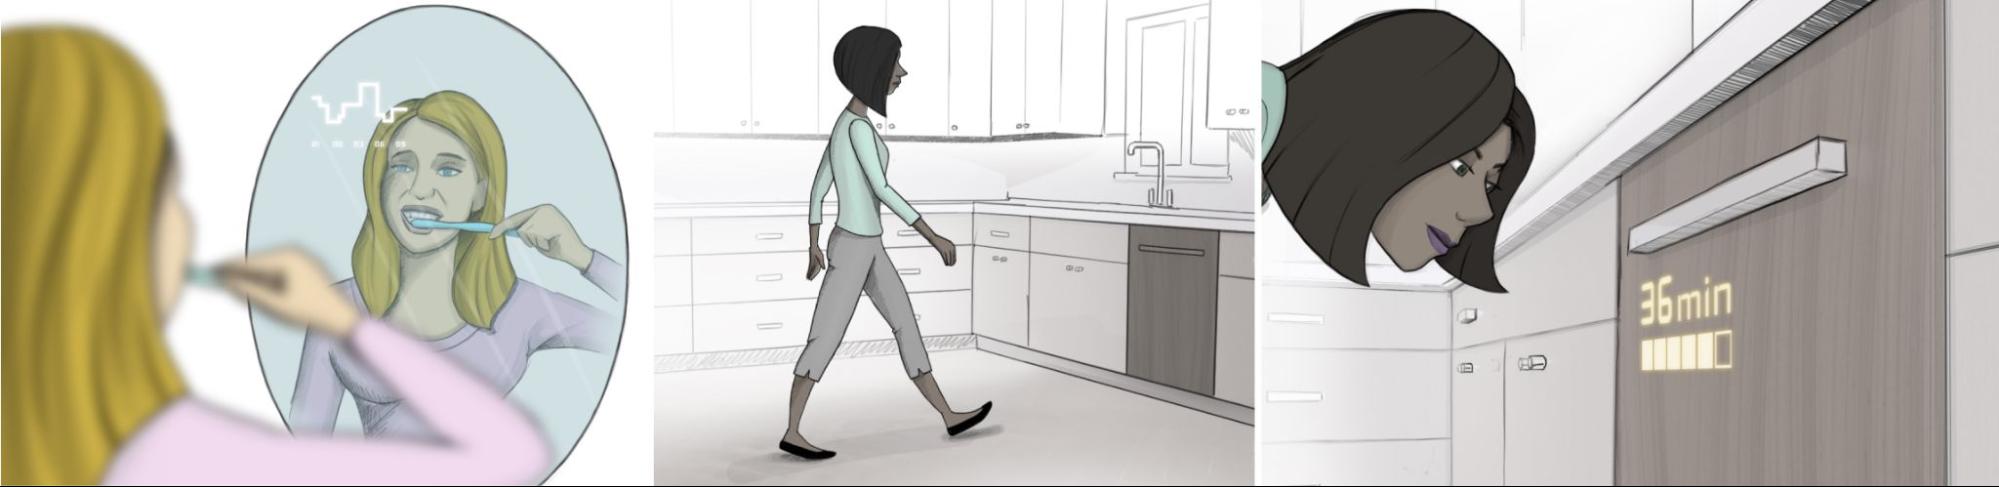
Illustration of how hidden interfaces can appear and disappear in everyday surfaces, such as a mirror or the wood paneling of a home appliance.

In “Hidden Interfaces for Ambient Computing: Enabling Interaction in Everyday Materials through High-Brightness Visuals on Low-Cost Matrix Displays”, presented at ACM CHI 2022, we describe an interface technology that is designed to be embedded underneath materials and our vision of how such technology can co-exist with everyday materials and aesthetics. This technology makes it possible to have high-brightness, low-cost displays appear from underneath materials such as textile, wood veneer, acrylic or one-way mirrors, for on-demand touch-based interaction.

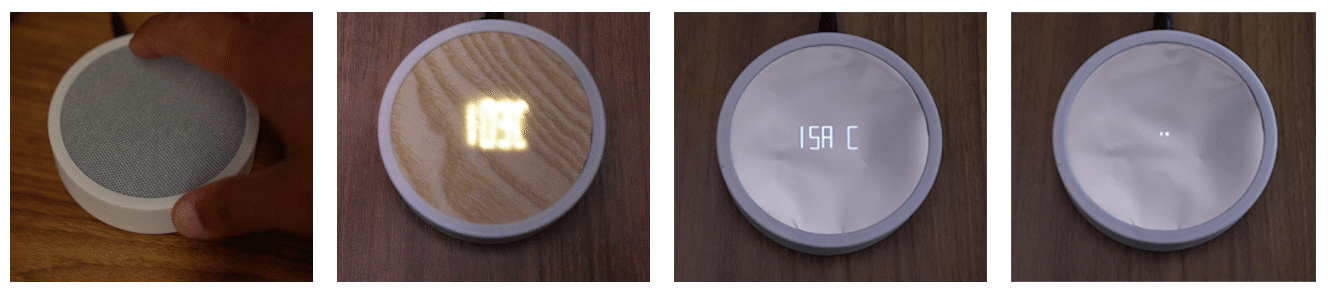
Hidden interface prototypes demonstrate bright and expressive rendering underneath everyday materials. From left to right: thermostat under textile, a scalable clock under wood veneer, and a caller ID display and a zooming countdown under mirrored surfaces.

Parallel Rendering: Boosting PMOLED Brightness for Ambient Computing
While many of today’s consumer devices employ active-matrix organic light-emitting diode (AMOLED) displays, their cost and manufacturing complexity is prohibitive for ambient computing. Yet other display technologies, such as E-ink and LCD, do not have sufficient brightness to penetrate materials.

To address this gap, we explore the potential of passive-matrix OLEDs (PMOLEDs), which are based on a simple design that significantly reduces cost and complexity. However, PMOLEDs typically use scanline rendering, where active display driver circuitry sequentially activates one row at a time, a process that limits display brightness and introduces flicker.

Instead, we propose a system that uses parallel rendering, where as many rows as possible are activated simultaneously in each operation by grouping rectilinear shapes of horizontal and vertical lines. For example, a square can be shown with just two operations, in contrast to traditional scanline rendering that needs as many operations as there are rows. With fewer operations, parallel rendering can output significantly more light in each instant to boost brightness and eliminate flicker. The technique is not strictly limited to lines and rectangles even if that is where we see the most dramatic performance increase. For example, one could add additional rendering steps for antialiasing (i.e., smoothing of) non-rectilinear content.

Illustration of scanline rendering (top) and parallel rendering (bottom) operations of an unfilled rectangle. Parallel rendering achieves bright, flicker-free graphics by simultaneously activating multiple rows.

Rendering User Interfaces and Text
We show that hidden interfaces can be used to create dynamic and expressive interactions. With a set of fundamental UI elements such as buttons, switches, sliders, and cursors, each interface can provide different basic controls, such as light switches, volume controls and thermostats. We created a scalable font (i.e., a set of numbers and letters) that is designed for efficient rendering in just a few operations. While we currently exclude letters “k, z, x” with their diagonal lines, they could be supported with additional operations. The per-frame-control of font properties coupled with the high frame rate of the display enables very fluid animations — this capability greatly expands the expressivity of the rectilinear graphics far beyond what is possible on fixed 7-segment LED displays.

In this work, we demonstrate various examples, such as a scalable clock, a caller ID display, a zooming countdown timer, and a music visualizer.

Realizing Hidden Interfaces with Interactive Hardware
To implement proof-of-concept hidden interfaces, we use a PMOLED display with 128×96 resolution that has all row and column drivers routed to a connector for direct access. We use a custom printed circuit board (PCB) with fourteen 16-channel digital-to-analog converters (DACs) to directly interface those 224 lines from a Raspberry Pi 3 A+. The touch interaction is enabled by a ring-shaped PCB surrounding the display with 12 electrodes arranged in arc segments.

Comparison to Existing Technologies
We compared the brightness of our parallel rendering to both the scanline on the same PMOLED and a small and large state-of-the-art AMOLED. We tested brightness through six common materials, such as wood and plastic. The material thickness ranged from 0.2 mm for the one-way mirror film to 1.6 mm for basswood. We measured brightness in lux (lx = light intensity as perceived by the human eye) using a light meter near the display. The environmental light was kept dim, slightly above the light meter’s minimum sensitivity. For simple rectangular shapes, we observed 5–40x brightness increase for the PMOLED in comparison to the AMOLED. The exception was the thick basswood, which didn’t let much light through for any rendering technology.

Example showing performance difference between parallel rendering on the PMOLED (this work) and a similarly sized modern 1.4″ AMOLED.

To validate the findings from our technical characterization with more realistic and complex content, we evaluate the number “2”, a grid of checkboxes, three progress bars, and the text “Good Life”. For this more complex content, we observed a 3.6–9.3x brightness improvement. These results suggest that our approach of parallel rendering on PMOLED enables display through several materials, and outperforms common state-of-the-art AMOLED displays, which seem to not be usable for the tested scenarios.

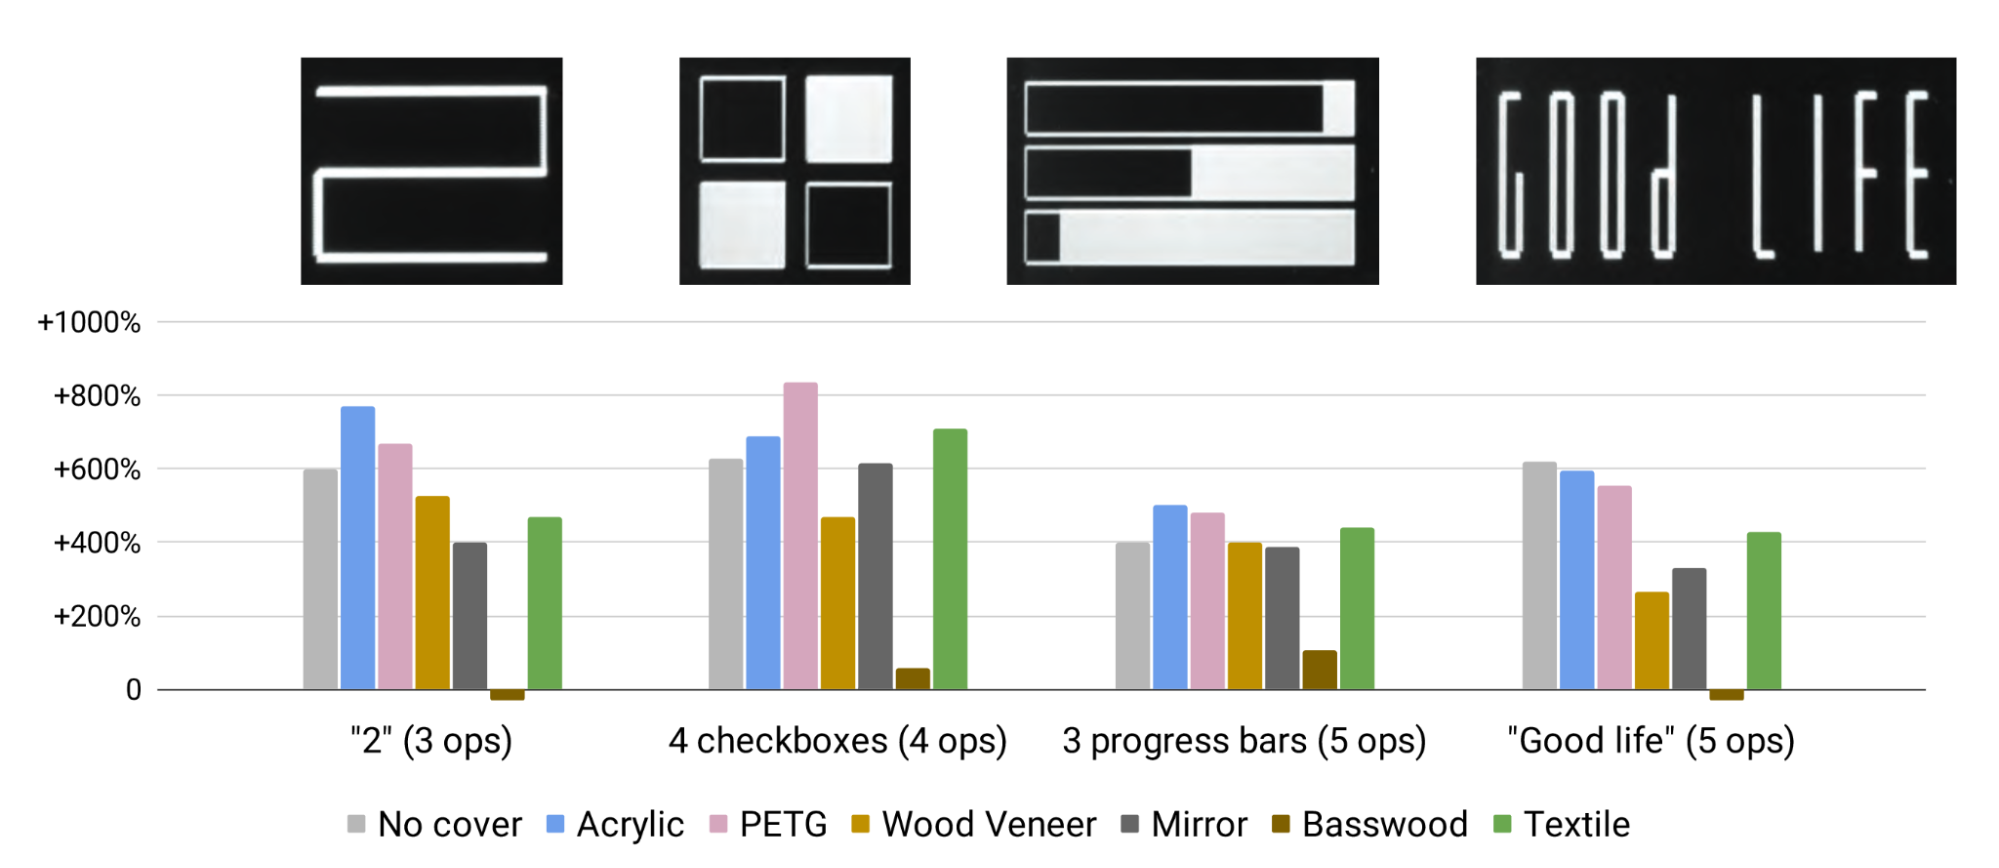
Brightness experiments with additional shapes that require different numbers of operations (ops). Measurements are shown in comparison to large state-of-the-art AMOLED displays.

What's Next?
In this work, we enabled hidden interfaces that can be embedded in traditional materials and appear on demand. Our lab evaluation suggests unmet opportunities to introduce hidden displays with simple, yet expressive, dynamic and interactive UI elements and text in traditional materials, especially wood and mirror, to blend into people’s homes.

In the future, we hope to investigate more advanced parallel rendering techniques, using algorithms that could also support images and complex vector graphics. Furthermore, we plan to explore efficient hardware designs. For example, application-specific integrated circuits (ASICs) could enable an inexpensive and small display controller with parallel rendering instead of a large array of DACs. Finally, longitudinal deployment would enable us to go deeper into understanding user adoption and behavior with hidden interfaces.

Hidden interfaces demonstrate how control and feedback surfaces of smart devices and appliances could visually disappear when not in use and then appear when in the user's proximity or touch. We hope this direction will encourage the community to consider other approaches and scenarios where technology can fade into the background for a more harmonious coexistence with traditional materials and human environments.

Acknowledgements
First and foremost, we would like to thank Ali Rahimi and Roman Lewkow for the collaboration, including providing the enabling technology. We also thank Olivier Bau, Aaron Soloway, Mayur Panchal and Sukhraj Hothi for their prototyping and fabrication contributions. We thank Michelle Chang and Mark Zarich for visual designs, illustrations and presentation support. We thank Google ATAP and the Google Interaction Lab for their support of the project. Finally, we thank Sarah Sterman and Mathieu Le Goc for helpful discussions and suggestions.

Source: Google AI Blog