Category Archives: Open Source Blog

News about Google’s open source projects and programs

Google Open Source Live: A monthly connection for open source communities

Starting in September, open source experts at Google will have a new place to meet with you online: Google Open Source Live, a virtual event series to connect with open source communities with a focus on different technologies and areas of expertise. Google Open Source Live launches on September 3, 2020, and will provide monthly content for open source developers at all levels, contributors, and community members. 
The inaugural event of this series will be: The new open source: Leadership, contributions and sustainability, in which the Google Open Source Programs Office, together with Developer Relations specialists, will share an overview of the best ways to get involved and succeed in the open source ecosystem with four exciting sessions.

Given how the 2020 pandemic has affected the communities’s ability to stay engaged and connect, it is important to us to stay present in the ecosystem. Therefore, we made a conscious decision to build an event series for developers to have the opportunity to hear directly from the Google Open Source Programs Office, developer advocates and experts. Each day will provide impactful information in a 2-hour time frame.

Attendee Experience

After attending several virtual events throughout the Summer, we designed our platform with one idea in mind: to create an alternative platform for developers to gather, learn, and interact with experts, and have fun.

Attendees can interact with the experts and speakers with Live Q&A chat during the sessions, and join an after party following the event! It’ll provide a great interactive opportunity for activities and to connect with others.

Sept. 3 Agenda

“The New Open Source: Leadership, contributions and sustainability”
9 AM - 11 AM PST

Session

Topic 

Speaker

Hosted by Stephen Fluin, DevRel Lead and Dustin Ingram, Developer Advocate.  

1

"Be the leader you want in OSS"

Megan Byrd-Sanicki

Manager, Operations & Research

2

"5 simple things you can do to improve OSS docs"

Erin McKean, Docs Advocacy Program Manager, OSPO

3

Fireside Chat: "Business models and contributor engagement in OS"

Seth Vargo, Developer Advocate

Kaslin Fields, Developer Advocate

4

"Sustainability in OS"

Megan Byrd-Sanicki, Manager

 Operations & Research

Google Open Source Live Event Calendar

Each month will focus on one open source project or concept and feature several speakers who are subject matter experts in their fields. Events take place monthly on the first Thursday.


2020

Sep 3

Oct 1

Nov 5

Dec 3

The new open source:

Leadership, contributions and sustainability

Knative day

On Google Open Source Live

Go day

On Google Open Source Live


Kubernetes day

On Google Open Source Live


2021

Feb 4

Mar 4

Apr 1

May 6

Istio day

On Google Open Source Live

Bazel day

On Google Open Source Live

Beam day

On Google Open Source Live

Spark day

On Google Open Source Live

Jun 3

Jul 1

Aug 5

Sep 2

CDAP day

On Google Open Source Live

Airflow day

On Google Open Source Live

OSS Security day

On Google Open Source Live

TBD


Find out more 

Sign up to receive more details and alerts, and follow GoogleOSS@ and #GoogleOSlive for updates on Twitter.


By Jamie Rachel, Event Program Manager for Google Open Source

Assess the security of Cloud deployments with InSpec for GCP

InSpec-GCP version 1.0 is now generally available, and two new Chef InSpec™ profiles have been released under an open source software license. The InSpec profiles contain controls for the GCP Center for Internet Security (CIS) Benchmark version 1.1.0 and the Payment Card Industry Data Security Standard (PCI DSS) version 3.2.1.

The Cloud Security Challenge

Developers are embracing automated continuous integration and continuous delivery (CI/CD), committing many application and infrastructure changes frequently. But centralized security teams can't review every application and infrastructure change. Those teams might have to block deployments (which decreases velocity and undermines continuous delivery) or review changes in production, where misconfigurations are more harmful and changes are more expensive.

Security reviews need to "shift left,” earlier in the software development lifecycle. Security teams likewise need to shift their own efforts to defining policies and providing tools to automate how compliance is verified. When developers adopt these tools, security and compliance checks become part of CI/CD, in a similar fashion to unit, functional, and integration tests, and thus become a normal part of the development workflow. Empowering developers to participate in this process means organizations can achieve continuous compliance. This also reinforces the mindset that security is everyone's responsibility.

What is InSpec

InSpec is a popular DevSecOps framework that checks the configuration state of resources in virtual machines and containers, on cloud providers such as GCP, AWS, and Azure. InSpec's lightweight nature, approachable domain-specific language, and extensibility make it a valuable tool for:
  • Expressing compliance policies as code
  • Enabling development teams to add tests that assess their applications' compliance with security policies before pushing changes to build and release pipelines
  • Automating compliance verification in CI/CD pipelines and as part of the release process
  • Unifying compliance assessments across multiple cloud providers and on-premises environments

InSpec for GCP and compliance profiles

The InSpec GCP resource pack 1.0 provides a consistent way to audit GCP resources. This release unifies the user experience by adding consistent behavior between resources and documentation for available fields. This resource pack also adds support for GCP endpoints that let you audit fields that are in beta (for example, GKE cluster pod security policy configuration).

You can use the GCP CIS Benchmark and the PCI DSS InSpec profiles to assess compliance with CIS and PCI DSS policies. CIS Benchmarks are configuration guides used by governments, businesses, industry, and academia. We strongly recommend configuring the workloads to meet or exceed these standards. PCI DSS is required for all organizations that accept or process credit card payments. The Terraform PCI Starter, coupled with the PCI InSpec profile, allows deployment of PCI-compliant environments and verifies their ongoing compliance.

This work is released under an open source license and we look forward to your feedback and contributions.

Validating PCI DSS and CIS compliance in infrastructure build pipelines

You can use InSpec to validate infrastructure deployments for compliance with standards such as PCI DSS and CIS. An automated validation process of new builds is important to detect insecure and non-compliant configurations as early as possible while minimizing the impact on developer agility.

With Cloud Build you can create CI pipelines for infrastructure-as-code deployments. You can run InSpec as an additional build step against resources in the GCP project to detect compliance violations in the target infrastructure. While this method doesn't prevent non-compliant build configurations, it does detect compliance issues, fail the build execution, and log the error in Cloud Logging. Cloud Build publishes build messages to a Cloud Pub/Sub topic, which can trigger a Cloud Function to integrate with appropriate alerting systems in case of a failed build. To prevent non-compliant infrastructure in a production environment, run the pipeline in a staging environment before promoting the content to production.

Here is an example pipeline definition for Cloud Build, using InSpec, to validate a project against the PCI guidelines. To run the PCI profile from a container inside a Cloud Build pipeline, clone the Git repository Payment Card Industry Data Security Standard (PCI DSS) version 3.2.1, build the Docker container from the root directory of the repository using the Dockerfile, and push the image to the Google Container Registry. The Cloud Build pipeline will store InSpec reports in a predefined bucket in json and html formats.

Here's an example for executing the PCI DSS InSpec profile as a step in a Cloud Build pipeline:

#...Previous execution steps
#
    - id: 'Run PCI Profile on in-scope project'
        waitFor: ['Write InSpec input file']
        name: gcr.io/${_GCR_PROJECT_ID}/inspec-gcp-pci-profile:v3.2.1-3
        entrypoint: '/bin/sh'
args:
    - '-c'
    - |
        inspec exec /share/. -t gcp:// \
        --input-file /workspace/inputs.yml \
        --reporter cli json:/workspace/pci_report.json \
        html:/workspace/pci_report.html | tee out.json


Note that in this example a previous execution step writes all required input parameters into the file /workspace/inputs.yml to make them available to the InSpec run. A CI/CD pipeline has been implemented for the PCI-GKE-Blueprint using Cloud Build and can be referenced as an example.

Try it yourself

Ready to try InSpec? Use this Cloud Shell Walkthrough to quickly install InSpec in your Cloud Shell instance and scan infrastructure in your GCP projects against the CIS Benchmark:


Chances are that in the walkthrough the InSpec scan detected some misconfigurations in your project.

As a developer of the project, you now know how to quickly scan your deployments, and you can begin to learn more about configuring your resources securely. Our Cloud Foundation Toolkit provides Terraform and Deployment Manager templates for best-practice configurations of your projects and underlying resources.

Most large organizations have platform teams that can adopt our Cloud Foundation Toolkit templates, which automate well-configured resource provisioning, and make those available to their developers. These organizations can also include InSpec testing steps in their CI/CD pipelines to provide early feedback to developers and to prevent misconfigured resources from getting released to Production.

By Bakh Inamov – Security and Compliance Specialist Engineer, Sam Levenick – Software Engineer, and Konrad Schieban – Infrastructure Cloud Consultant

Cloud Spanner Emulator Reaches 1.0 Milestone!

The Cloud Spanner emulator provides application developers with the full set of APIs, including the full breadth of SQL and DDL features that can be run locally for prototyping, development and testing. This offline emulator is free and improves developer productivity for customers. Today, we are happy to announce that Cloud Spanner emulator is generally available (GA) with support for Partitioned APIs, Cloud Spanner client libraries, and SQL features.

Since Cloud Spanner emulator’s beta launch in April, 2020, we have seen strong adoption of the local emulator from customers of Cloud Spanner. Several new and existing customers adopted the emulator in their development & continuous test pipelines. They noticed significant improvements in developer productivity, speed of test execution, and error-free applications deployed to production. We also added several features in this release based on the valuable feedback we received from beta users. The full list of features is documented in the GitHub readme.

Partition APIs

When reading or querying large amounts of data from Cloud Spanner, it can be useful to divide the query into smaller pieces, or partitions, and use multiple machines to fetch the partitions in parallel. The emulator now supports Partition Read, Partition Query, and Partition DML APIs.

Cloud Spanner client libraries

With the GA launch, the latest versions of all the Cloud Spanner client libraries support the emulator. We have added support for C#, Node.js, PHP, Python, Ruby client libraries and the Cloud Spanner JDBC driver. This is in addition to C++, Go and Java client libraries that were already supported with the beta launch. Be sure to check out the minimum version for each of the client libraries that support the emulator.

Use the Getting Started guides to try the emulator with the client library of your choice.

SQL features

Emulator now supports the full set of SQL features provided by Cloud Spanner. Some of the notable additions being support for SQL functions JSON_VALUE, JSON_QUERY, CEILING, POWER, CHARACTER_LENGTH, and FORMAT. We now also support untyped parameter bindings in SQL statements which are used by our client libraries written in languages with dynamic typing e.g., Python, PHP, Node.js and Ruby.

Using Emulator in CI/CD pipelines

You may now point the majority of your existing CI/CD to the Cloud Spanner emulator instead of a real Cloud Spanner instance brought up on GCP. This will save you both cost and time, since an emulator instance comes up instantly and is free to use!

What’s even better is that you can bring up multiple instances in a single execution of the emulator, and of course multiple databases. Thus, tests that interact with a Cloud Spanner database can now run in parallel since each of them can have their own database, making tests hermetic. This can reduce flakiness in unit tests and reduce the number of bugs that can make their way to continuous integration tests or to production.

In case your existing CI/CD architecture assumes the existence of a Cloud Spanner test instance and/or test database against which the tests run, you can achieve similar functionality with the emulator as well. Note that the emulator doesn’t come up with a default instance or a default database as we expect users to create instances and databases as required in their tests for hermeticity as explained above. Below are two examples of how you can bring up an emulator with a default instance or database: 1) By using a docker image or 2) Programmatically.

Starting Emulator from Docker

The emulator can be started using Docker on Linux, MacOS, and Windows. As a prerequisite, you would need to install Docker on your system. To bring up an emulator with a default database/instance, you can execute a shell script in your docker file to do so. Such a script would make RPC calls to CreateInstance and CreateDatabase after bringing up the emulator server. You can also look at this example on how to put this together when using docker.
Run Emulator Programmatically

You can bring up the emulator binary in the same process as your test program. Then you can then create a default instance/database in your ‘Setup’ and clean up the same when the tests are over. Note that the exact procedure for bringing up an ‘in-process’ service may vary with the client library language and platform of your choice.

Other alternatives to start the emulator, including pre-built linux binaries, are listed here.
Try it now

Learn more about Google Cloud Spanner emulator and try it out now.

By Asheesh Agrawal, Google Open Source

DEFCON Differential Privacy Training Launch

Differential privacy is a technique that enables organizations to learn from the majority of their data while simultaneously ensuring those results do not allow an individual’s data to be distinguished or re-identified. A popular way of attaining differential privacy is by adding noise to the data, which provides mathematical bounds on the amount of information that is leaked. Our open source offering aims to help developers implement differential privacy.

In the summer of 2019, we publicly launched our Differential Privacy Library. Since then, we’ve expanded it from just C++ to also include Go and Java.

We’ve come to realize that differential privacy requires more than just the library to be effectively implemented. We mentioned in a post earlier this summer that we want all developers to be able to interact with differential privacy, which requires more than an open-sourced library, but rather a training on the topic to share knowledge with all developers.

Our goal with this training is to provide a head start that is helpful for those considering differential privacy implementation. We also want to provide an experience on privacy and security that is understood and impactful to any individual in the field, whether they are a beginner or someone who has background knowledge in privacy.

This new training contains several steps and covers many topics, such as:
  • The foundations of differential privacy
  • Explanations as to why aggregation by itself may not hedge against privacy risks
  • The mathematical behind-the-scenes of noise
  • Tools that can be used in conjunction with differential privacy
  • Codelabs that users can take (in Go)
  • Additional resources to address any further questions

Step 1: Take our survey! It only takes five minutes!

This survey enables us to gain insights into what you are expecting to gain from this training. We are curious about what your objectives and goals are with this training, and if you have any experience with differential privacy.

Step 2: Check-out an introductory video to Differential Privacy!

We introduce topics like data aggregation, k-anonymity, differential privacy, noise, and others. The goal of this module is to introduce the foundations behind the differential privacy, and why it is an important and useful privacy tool.

Step 3: Try-out our codelabs

We have provided Codelabs in Go to help you practice implementing Differential Privacy library end-to-end.

Step 4: Learn more about differential privacy.

We want to offer an additional resource to help answer any questions you may have. If you have other resources that you find, please let us know and we will add these links to our overall training.

Step 5: Provide us with some feedback

Please use this survey as a platform to share your experience with this pilot. Did the content meet your expectations? Did it make sense? What was missing? This is the time for you to share your point of view and any pain points you experienced (as well as any positive aspects you encountered).

We hope this training provides an impactful experience from beginner coders to privacy specialists. The public differential privacy training will launch at the Stanford Biodesign: “Building for Digital Health” Buildathon, Sept 11-13, 2020, led by Stanford, and supported by Google Cloud and Apple Health engineers.

Please continue to reach out to us to share your experiences with us at [email protected]. The suggestions we receive will help us improve and it will inform our thinking as we add new features and updates.

Acknowledgements: Miguel Guevara, Bryant Gipson, Royce Wilson, Kate Frankenberg, Katie Holzheimer, Lior Gottleib, Carmen Bush

By Aditi Joshi – Security and Privacy Engineering, Google Cloud

Season of Docs announces 2020 technical writing projects

Season of Docs has announced the technical writers participating in the program and their projects! You can view a list of organizations and technical writing projects on the website.

The program received over 500 technical writer applications, and with them, over 800 technical writing project proposals. The enthusiasm from the technical writing and open source communities has been amazing!

What is next?

During the community bonding period from August 17 to September 13, mentors must work with the technical writers to prepare them for the doc development phase. By the end of community bonding, the technical writer should be familiar with the open source project and community, understand the product as a whole, establish communication channels with the mentoring organization, and set clear goals and expectations for the project. These are critical to the successful completion of the technical writing project.

Documentation development begins on September 14, 2020.

What is Season of Docs?

Documentation is essential to the adoption of open source projects as well as to the success of their communities. Season of Docs brings together technical writers and open source projects to foster collaboration and improve documentation in the open source space. You can find out more about the program on the introduction page of the website.

During the program, technical writers spend a few months working closely with an open source community. They bring their technical writing expertise to the project's documentation and, at the same time, learn about the open source project and new technologies.

The open source projects work with the technical writers to improve the project's documentation and processes. Together, they may choose to build a new documentation set, redesign the existing docs, or improve and document the project's contribution procedures and onboarding experience.

General timeline
August 16Google announces the accepted technical writer projects
August 17 - September 13Community bonding: Technical writers get to know mentors and the open source community, and refine their projects in collaboration with their mentors
September 14 - December 5Technical writers work with open source mentors on the accepted projects, and submit their work at the end of the period
January 6, 2021Google publishes the list of successfully-completed projects

See the full timeline for details, including the provision for projects that run longer than three months.

Find out more

Explore the Season of Docs website at g.co/seasonofdocs to learn more about the program. Use our logo and other promotional resources to spread the word. Check out the FAQ for further questions!

By Kassandra Dhillon and Erin McKean, Program Managers, Google Open Source Programs Office

Java zPages for OpenTelemetry

What is OpenTelemetry?

OpenTelemetry is an open source project aimed at improving the observability of our applications. It is a collection of cloud monitoring libraries and services for capturing distributed traces and metrics and integrates naturally with external observability tools, such as Prometheus and Zipkin. As of now, OpenTelemetry is in its beta stage and supports a few different languages.

What are zPages?

zPages are a set of dynamically generated HTML web pages that display trace and metrics data from the running application. The term zPages was coined at Google, where similar pages are used to view basic diagnostic data from a particular host or service. For our project, we built the Java /tracez and /traceconfigz zPages, which focus on collecting and displaying trace spans.

TraceZ

The /tracez zPage displays span data from the instrumented application. Spans are split into two groups: spans that are still running and spans that have completed.

TraceConfigZ

The /traceconfigz zPage displays the currently active tracing configuration and allows users to change the tracing parameters. Examples of such parameters include the sampling probability and the maximum number of attributes.

Using the zPages

This section describes how to start and use the Java zPages.

Add the dependencies to your project

First, you need to add OpenTelemetry as a dependency to your Java application.

Maven

For Maven, add the following to your pom.xml file:
<dependencies>
    <dependency>
        <groupId>io.opentelemetry</groupId>
        <artifactId>opentelemetry-api</artifactId>
        <version>0.7.0</version>
    </dependency>
    <dependency>
        <groupId>io.opentelemetry</groupId>
        <artifactId>opentelemetry-sdk</artifactId>
        <version>0.7.0</version>
    </dependency>
    <dependency>
        <groupId>io.opentelemetry</groupId>
        <artifactId>opentelemetry-sdk-extension-    zpages</artifactId>
        <version>0.7.0</version>
    </dependency>
</dependencies>

Gradle

For Gradle, add the following to your build.gradle dependencies:
implementation 'io.opentelemetry:opentelemetry-api:0.7.0'
implementation 'io.opentelemetry:opentelemetry-sdk:0.7.0'
implementation 'io.opentelemetry:opentelemetry-sdk-extension-zpages:0.7.0'

Register the zPages

To set-up the zPages, simply call startHttpServerAndRegisterAllPages(int port) from the ZPageServer class in your main function:
import io.opentelemetry.sdk.extensions.zpages.ZPageServer;

public class MyMainClass {
    public static void main(String[] args) throws Exception {
        ZPageServer.startHttpServerAndRegisterAllPages(8080);
        // ... do work
    }
}
Note that the package com.sun.net.httpserver is required to use the default zPages setup. Please make sure your version of the JDK includes this package if you plan to use the default server.

Alternatively, you can call registerAllPagesToHttpServer(HttpServer server) to register the zPages to a shared server:
import io.opentelemetry.sdk.extensions.zpages.ZPageServer;

public class MyMainClass {
    public static void main(String[] args) throws Exception {
        HttpServer server = HttpServer.create(new                     InetSocketAddress(8000), 10);
        ZPageServer.registerAllPagesToHttpServer(server);
        server.start();
        // ... do work
    }
}

Access the zPages

View all available zPages on the index page

The index page (at /) lists all available zPages with a link and description.


View trace spans on the /tracez zPage

The /tracez zPage displays information about running and completed spans, with completed spans further organized into latency and error buckets. The data is aggregated into a summary-level table:


You can click on each of the counts in the table cells to access the corresponding span details. For example, here are the details of the ChildSpan latency sample (row 1, col 4):


View and update the tracing configuration on the /traceconfigz zPage.

The /traceconfigz zPage provides an interface for users to modify the current tracing parameters:


Design

This section goes into the underlying design of our code.

Frontend


The frontend consists of two main parts: HttpHandler and HttpServer. The HttpHandler is responsible for rendering the HTML content, with each zPage implementing its own ZPageHandler. The HttpServer, on the other hand, is responsible for listening to incoming requests, obtaining the requested data, and then invoking the aforementioned ZPageHandlers. The HttpServer class from com.sun.net is used to construct the default server and to handle http requests on different routes.

Backend


The backend consists of two components as well: SpanProcessor and DataAggregator. The SpanProcessor watches the lifecycle of each span, invoking functions each time a span starts or ends. The DataAggregator, on the other hand, restructures the data from the SpanProcessor into an accessible format for the frontend to display. The class constructor requires a TracezSpanProcessor instance, so that the TracezDataAggregator class can access the spans collected by a specific TracezSpanProcessor. The frontend only needs to call functions in the DataAggregator to obtain information required for the web page.

Conclusion

We hope that this blog post has given you a little insight into the development and use cases of OpenTelemetry’s Java zPages. The zPages themselves are lightweight performance monitoring tools that allow users to troubleshoot and better understand their applications. Once OpenTelemetry is officially released, we hope that you try out and use the /tracez and /traceconfigz zPages!

By William Hu and Terry Wang – Software Engineering Interns, Core Compute Observability

Google Summer of Code 2020 Statistics: Part 2

With the program nearing the end of the summer, it’s time for another round of updates!

Universities

The 1,198 students accepted into the GSoC 2020 program came from 550 universities, of which, 114 have students participating for the first time in GSoC.

Schools with the most accepted students for GSoC 2020:
University# of Accepted Students
Indian Institute of Technology, Roorkee48
Indian Institute of Technology, Kanpur27
International Institute of Information Technology, Hyderabad24
National Institute of Technology Karnataka, Surathkal23
Birla Institute of Technology and Science, Pilani (BITS Pilani)13
Indian Institute of Technology, Kharagpur13
Indian Institute of Technology (BHU), Varanasi11
University of Moratuwa11
National Institute of Technology, Hamirpur10
Amrita Vishwa Vidyapeetham, Amritapuri Campus10
University of Tokyo10
University Of Colombo School Of Computing (UCSC)10

Mentors

Each year we pore over gobs of data to extract some interesting statistics about the GSoC mentors. Here’s a quick synopsis of our 2020 crew:
  • Registered mentors: 3,592
  • Mentors with assigned student projects: 2,156
  • Mentors who have participated in GSoC for 10 or more years: 78
  • Mentors who have been a part of GSoC for 5 years or more: 199
  • Mentors that are former GSoC students: 533 (24.7%)
  • Mentors that have also been involved in the Google Code-in program: 405 (18.8%)
  • Percentage of new mentors: 34.18%
GSoC 2020 had an international representation with mentors from 67 countries around the world!

The global pandemic, COVID-19, brought additional challenges to this year’s GSoC program. Whether living with the virus, adjusting to shifting school and work schedules, or pivoting to a remote lifestyle, students and mentors have had to prioritize their safety and delicately balance their new way of life. Despite these unprecedented times, our students continue to push on and our mentors fully support our students by sharing their passion for open source, listening to their concerns and providing them with valuable advice. For that commitment, we would like to acknowledge and give thanks to all students and mentors in the GSoC 2020 program. Not even a pandemic can dampen your enthusiasm and tireless contributions to the open source community!

By Stephanie Taylor – Program Manager, Google Open Source Programs Office

Supporting Wikipedia with more tools for editors

Google has a commitment to making information more accessible to people around the world, while ensuring that the information on the web is accurate and reflects the diversity of its users. Just like Google supports open source software development, WikiLoop is one of the explorations on better contributing to the open knowledge movement. To this day, Wikipedia, a Wikimedia movement project, remains a reliable information source that is also available with an open license, which makes it possible for Knowledge Engine of Google—as well as knowledge graph systems operated by others —to draw excerpts from it for Search features and other apps. With the project’s sustainability in mind, Google has contributed back to the Wikimedia movement in a number of ways since 2018. Building on this commitment, Google created the umbrella program WikiLoop in 2019, which hosts several tools for editors that focus on content quality, like WikiLoop DoubleCheck. 
WikiLoop is led by Zainan Zhou—a Googler for the last 7 years, and a Wikipedian for the last 5—who works as a software engineer in the Knowledge Engine team at Google. When he joined the free encyclopedia as an editor, he always wondered how his company could contribute to this open source project. Zainan involved the Wikipedia communities in every step of the development of WikiLoop, connecting with editors from different parts of the world at Wikimedia events, like WikidataCon, Wikimania, Wiki Conference North America, and WikiDevSummit, throughout 2019. The most recent involvement with the community of Wikipedia editors included a consultation and vote to change the name of the most popular WikiLoop artifact, a tool for peer-review of Wikipedia articles, DoubleCheck.

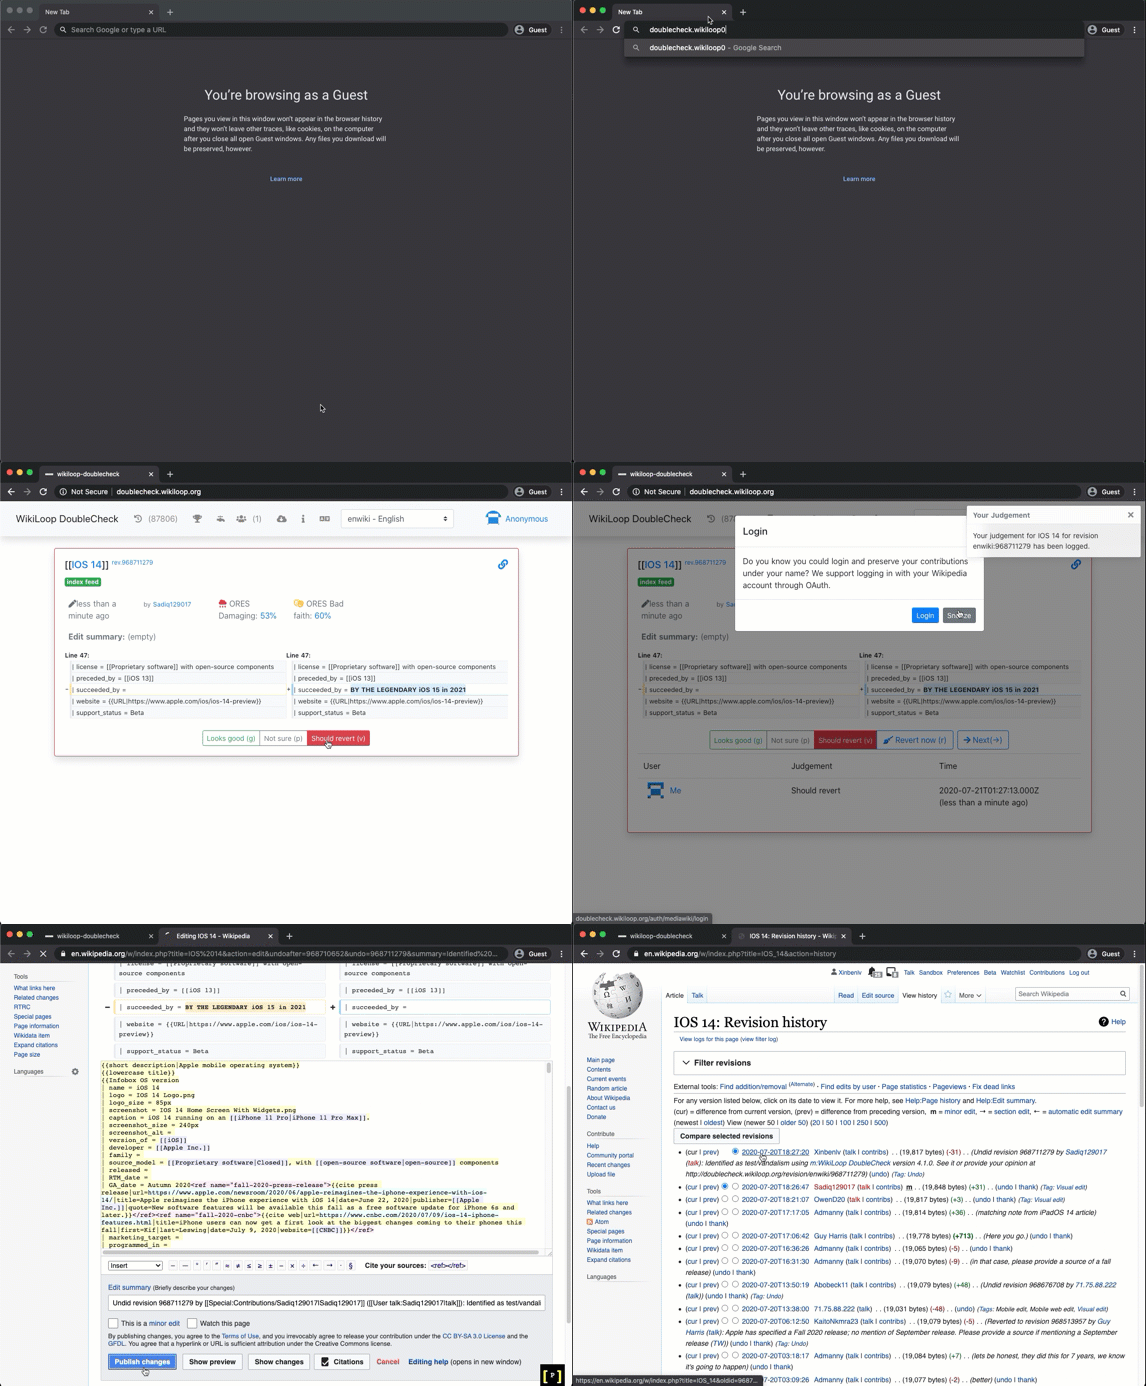
In the past few months, we focused on raising awareness of WikiLoop DoubleCheck. This tool allows registered and unregistered users to mark new edits with tags “looks good”, “not sure”, and “should revert”, a peer review system which editors could use to approve or revert new content on Wikipedia. Since its launch, the tool has witnessed a 309% quarter over quarter growth in tags added, and over 1,000 editors have used it to review Wikipedia content. With the help of volunteer translators and machine translation, WikiLoop DoubleCheck is now made available in 25 languages, and we hope to continue serving more Wikipedia editors in the months to come. In order for Google’s Knowledge Engine to organize the world's information, the knowledge source needs to be healthy. While peer-review on Wikipedia is an established process that has been going on for years, tools like WikiLoop DoubleCheck support the thousands of volunteers who dedicate their time to this task on Wikipedia by making information verification more accessible.


The WikiLoop program was originally conceived as a virtuous circle: providing data and tools to enhance human editor's productivity, and making the Wikipedia editorial input more machine-readable for open knowledge institutions, academia and researchers interested in advancing machine learning technology.

WikiLoop leverages Google’s talents at software development to contribute to global Wikipedia content accuracy by enhancing the existing suite of Wikimedia and community tools for content validation at scale. While WikiLoop is a contribution of Google to the Wikipedia communities, Google and the Wikimedia Foundation have partnered in other areas as well. Learn more about Google’s partnership with the Wikimedia Foundation on the partnership’s page on Meta-Wikimedia

While probably the most popular in the set, DoubleCheck is not the only tool under the WikiLoop umbrella. We are also building data sets and tools and continue to explore other opportunities to contribute to the open knowledge movement. Learn more about tools and other initiatives, like the Coalition call, on the program’s page on Meta-Wikimedia.

By María Cruz  Program Manager, Google Open Source Programs Office