Tag Archives: compression

LayerNAS: Neural Architecture Search in Polynomial Complexity

Every byte and every operation matters when trying to build a faster model, especially if the model is to run on-device. Neural architecture search (NAS) algorithms design sophisticated model architectures by searching through a larger model-space than what is possible manually. Different NAS algorithms, such as MNasNet and TuNAS, have been proposed and have discovered several efficient model architectures, including MobileNetV3, EfficientNet.

Here we present LayerNAS, an approach that reformulates the multi-objective NAS problem within the framework of combinatorial optimization to greatly reduce the complexity, which results in an order of magnitude reduction in the number of model candidates that must be searched, less computation required for multi-trial searches, and the discovery of model architectures that perform better overall. Using a search space built on backbones taken from MobileNetV2 and MobileNetV3, we find models with top-1 accuracy on ImageNet up to 4.9% better than current state-of-the-art alternatives.


Problem formulation

NAS tackles a variety of different problems on different search spaces. To understand what LayerNAS is solving, let's start with a simple example: You are the owner of GBurger and are designing the flagship burger, which is made up with three layers, each of which has four options with different costs. Burgers taste differently with different mixtures of options. You want to make the most delicious burger you can that comes in under a certain budget.

Make up your burger with different options available for each layer, each of which has different costs and provides different benefits.

Just like the architecture for a neural network, the search space for the perfect burger follows a layerwise pattern, where each layer has several options with different changes to costs and performance. This simplified model illustrates a common approach for setting up search spaces. For example, for models based on convolutional neural networks (CNNs), like MobileNet, the NAS algorithm can select between a different number of options — filters, strides, or kernel sizes, etc. — for the convolution layer.


Method

We base our approach on search spaces that satisfy two conditions:

  • An optimal model can be constructed using one of the model candidates generated from searching the previous layer and applying those search options to the current layer.
  • If we set a FLOP constraint on the current layer, we can set constraints on the previous layer by reducing the FLOPs of the current layer.

Under these conditions it is possible to search linearly, from layer 1 to layer n knowing that when searching for the best option for layer i, a change in any previous layer will not improve the performance of the model. We can then bucket candidates by their cost, so that only a limited number of candidates are stored per layer. If two models have the same FLOPs, but one has better accuracy, we only keep the better one, and assume this won’t affect the architecture of following layers. Whereas the search space of a full treatment would expand exponentially with layers since the full range of options are available at each layer, our layerwise cost-based approach allows us to significantly reduce the search space, while being able to rigorously reason over the polynomial complexity of the algorithm. Our experimental evaluation shows that within these constraints we are able to discover top-performance models.


NAS as a combinatorial optimization problem

By applying a layerwise-cost approach, we reduce NAS to a combinatorial optimization problem. I.e., for layer i, we can compute the cost and reward after training with a given component Si . This implies the following combinatorial problem: How can we get the best reward if we select one choice per layer within a cost budget? This problem can be solved with many different methods, one of the most straightforward of which is to use dynamic programming, as described in the following pseudo code:

while True:
	# select a candidate to search in Layer i
	candidate = select_candidate(layeri)
	if searchable(candidate):
		# Use the layerwise structural information to generate the children.
		children = generate_children(candidate)
		reward = train(children)
		bucket = bucketize(children)
		if memorial_table[i][bucket] < reward:
			memorial_table[i][bucket] = children
		move to next layer
Pseudocode of LayerNAS.
Illustration of the LayerNAS approach for the example of trying to create the best burger within a budget of $7–$9. We have four options for the first layer, which results in four burger candidates. By applying four options on the second layer, we have 16 candidates in total. We then bucket them into ranges from $1–$2, $3–$4, $5–$6, and $7–$8, and only keep the most delicious burger within each of the buckets, i.e., four candidates. Then, for those four candidates, we build 16 candidates using the pre-selected options for the first two layers and four options for each candidate for the third layer. We bucket them again, select the burgers within the budget range, and keep the best one.

Experimental results

When comparing NAS algorithms, we evaluate the following metrics:

  • Quality: What is the most accurate model that the algorithm can find?
  • Stability: How stable is the selection of a good model? Can high-accuracy models be consistently discovered in consecutive trials of the algorithm?
  • Efficiency: How long does it take for the algorithm to find a high-accuracy model?

We evaluate our algorithm on the standard benchmark NATS-Bench using 100 NAS runs, and we compare against other NAS algorithms, previously described in the NATS-Bench paper: random search, regularized evolution, and proximal policy optimization. Below, we visualize the differences between these search algorithms for the metrics described above. For each comparison, we record the average accuracy and variation in accuracy (variation is noted by a shaded region corresponding to the 25% to 75% interquartile range).

NATS-Bench size search defines a 5-layer CNN model, where each layer can choose from eight different options, each with different channels on the convolution layers. Our goal is to find the best model with 50% of the FLOPs required by the largest model. LayerNAS performance stands apart because it formulates the problem in a different way, separating the cost and reward to avoid searching a significant number of irrelevant model architectures. We found that model candidates with fewer channels in earlier layers tend to yield better performance, which explains how LayerNAS discovers better models much faster than other algorithms, as it avoids spending time on models outside the desired cost range. Note that the accuracy curve drops slightly after searching longer due to the lack of correlation between validation accuracy and test accuracy, i.e., some model architectures with higher validation accuracy have a lower test accuracy in NATS-Bench size search.

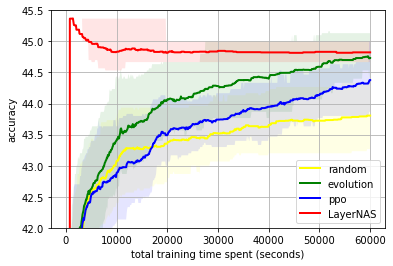
Top: NATS-Bench size search test accuracy on Cifar10; Middle: On Cifar100; Bottom: On ImageNet16-120. Average on 100 runs compared with random search (random), Regularized Evolution (evolution), and Proximal Policy Optimization (PPO).

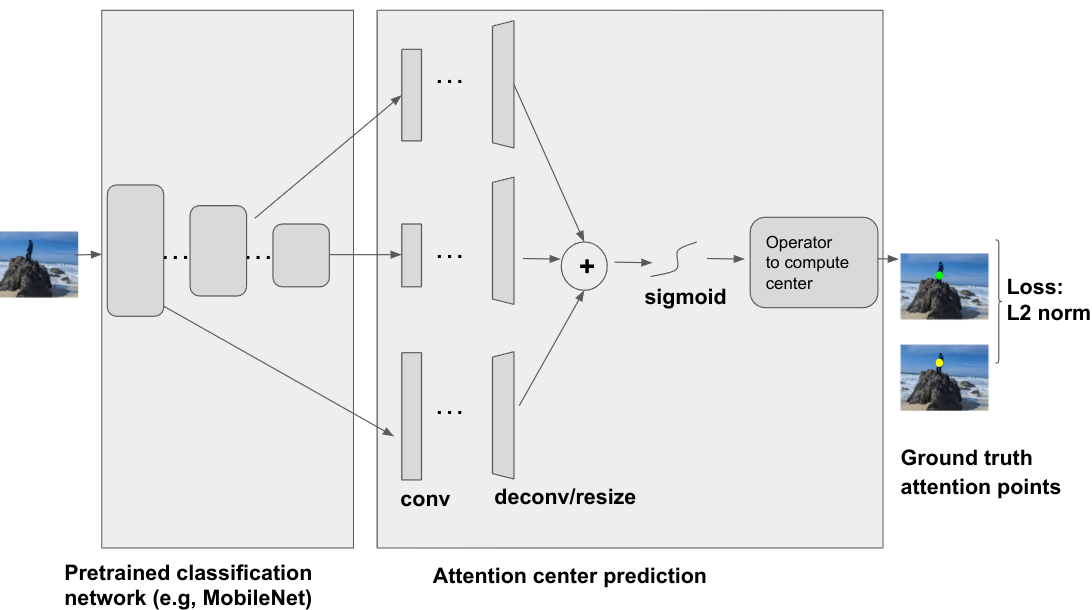
We construct search spaces based on MobileNetV2, MobileNetV2 1.4x, MobileNetV3 Small, and MobileNetV3 Large and search for an optimal model architecture under different #MADDs (number of multiply-additions per image) constraints. Among all settings, LayerNAS finds a model with better accuracy on ImageNet. See the paper for details.

Comparison on models under different #MAdds.

Conclusion

In this post, we demonstrated how to reformulate NAS into a combinatorial optimization problem, and proposed LayerNAS as a solution that requires only polynomial search complexity. We compared LayerNAS with existing popular NAS algorithms and showed that it can find improved models on NATS-Bench. We also use the method to find better architectures based on MobileNetV2, and MobileNetV3.


Acknowledgements

We would like to thank Jingyue Shen, Keshav Kumar, Daiyi Peng, Mingxing Tan, Esteban Real, Peter Young, Weijun Wang, Qifei Wang, Xuanyi Dong, Xin Wang, Yingjie Miao, Yun Long, Zhuo Wang, Da-Cheng Juan, Deqiang Chen, Fotis Iliopoulos, Han-Byul Kim, Rino Lee, Andrew Howard, Erik Vee, Rina Panigrahy, Ravi Kumar and Andrew Tomkins for their contribution, collaboration and advice.

Source: Google AI Blog


Open sourcing the attention center model

When you look at an image, what parts of an image do you pay attention to first? Would a machine be able to learn this? We provide a machine learning model that can be used to do just that. Why is it useful? The latest generation image format (JPEG XL) supports serving the parts that you pay attention to first, which results in an improved user experience: images will appear to load faster. But the model not only works for encoding JPEG XL images, but can be used whenever we need to know where a human would look first.

An open sourcing attention center model

What regions in an image will attract the majority of human visual attention first? We trained a model to predict such a region when given an image, called the attention center model, which is now open sourced. In addition to the model, we provide a script to use it in combination with the JPEG XL encoder: google/attention-center.

Some example predictions of our attention center model are shown in the following figure, where the green dot is the predicted attention center point for the image. Note that in the “two parrots” image both parrots’ heads are visually important, so the attention center point will be in the middle.

Four images in quadrants as follows: A red door with brass doorknob in top left quadrant, headshot of a brown skinned girl waering a colorful sweater and ribbons in her hair and painted face smiling at the camera in the top right quadrant, A teal shuttered catherdral style window against a sand colored stucco wall with pink and red hibiscus in the forefront in the bottom left quadrant, A blue and yellow macaw and red and green macaw next to each other in the bottom right quadrant
Images are from Kodak image data set: http://r0k.us/graphics/kodak/

The model is 2MB and in the TensorFlow Lite format. It takes an RGB image as input and outputs a 2D point, which is the predicted center of human attention on the image. That predicted center is the place where we should start with operations (decoding and displaying in JPEG XL case). This allows the most visually salient/import regions to be processed as early as possible. Check out the code and continue to build upon it!

Attention center ground-truth data

To train a model to predict the attention center, we first need to have some ground-truth data from the attention center. Given an image, some attention points can either be collected by eye trackers [1], or be approximated by mouse clicks on a blurry version of the image [2]. We first apply temporal filtering to those attention points and keep only the initial ones, and then apply spatial filtering to remove noise (e.g., random gazes). We then compute the center of the remaining attention points as the attention center ground-truth. An example illustration figure is shown below for the process of obtaining the ground-truth.

Five images in a row showing the original image of a person standing on a rock by the ocean; the first is the original image, the second showing gaze/attention points, the third shoing temporal filtering, the fourth spatial filtering, and fifth, attention center

Attention center model architecture

The attention center model is a deep neural net, which takes an image as input, and uses a pre-trained classification network, e.g, ResNet, MobileNet, etc., as the backbone. Several intermediate layers that output from the backbone network are used as input for the attention center prediction module. These different intermediate layers contain different information e.g., shallow layers often contain low level information like intensity/color/texture, while deeper layers usually contain higher and more semantic information like shape/object. All are useful for the attention prediction. The attention center prediction applies convolution, deconvolution and/or resizing operator together with aggregation and sigmoid function to generate a weighting map for the attention center. And then an operator (the Einstein summation operator in our case) can be applied to compute the (gravity) center from the weighting map. An L2 norm between the predicted attention center and the ground-truth attention center can be computed as the training loss.

Attention center model architecture

Progressive JPEG XL images with attention center model

JPEG XL is a new image format that allows the user to encode images in a way to ensure the more interesting parts come first. This has the advantage that when viewing images that are transferred over the web, we can already display the attention grabbing part of the image, i.e. the parts where the user looks first and as soon as the user looks elsewhere ideally the rest of the image already has arrived and has been decoded. Using Saliency in progressive JPEG XL images | Google Open Source Blog illustrates how this works in principle. In short, in JPEG XL, the image is divided into square groups (typically of size 256 x 256), and the JPEG XL encoder will choose a starting group in the image and then grow concentric squares around that group. It was this need for figuring out where the attention center of an image is that led us to open source the attention center model, together with a script to use it in combination with the JPEG XL encoder. Progressive decoding of JPEG XL images has recently been added to Chrome starting from version 107. At the moment, JPEG XL is behind an experimental flag, which can be enabled by going to chrome://flags, searching for “jxl”.

To try out how partially loaded progressive JPEG XL images look, you can go to https://google.github.io/attention-center/.

By Moritz Firsching, Junfeng He, and Zoltan Szabadka – Google Research

References

[1] Valliappan, Nachiappan, Na Dai, Ethan Steinberg, Junfeng He, Kantwon Rogers, Venky Ramachandran, Pingmei Xu et al. "Accelerating eye movement research via accurate and affordable smartphone eye tracking." Nature communications 11, no. 1 (2020): 1-12.

[2] Jiang, Ming, Shengsheng Huang, Juanyong Duan, and Qi Zhao. "Salicon: Saliency in context." In Proceedings of the IEEE conference on computer vision and pattern recognition, pp. 1072-1080. 2015.

Lyra V2 – a better, faster, and more versatile speech codec

Since we open sourced the first version of Lyra on GitHub last year, we are delighted to see a vibrant community growing around it, with thousands of stars, hundreds of forks, and many comments and pull requests. There are people who fixed and formatted our code, built continuous integration for the project, and even added support for Web Assembly.

We are incredibly grateful for all these contributions, and we also heard the community's feedback, asking us to improve Lyra. Some examples of what developers wanted were to run Lyra on more platforms, develop applications in more languages; and for a model that computes faster with more bitrate options and lower latency, and better audio quality with fewer artifacts.

That's why we are now releasing Lyra V2, with a new architecture that enjoys a wider platform support, provides scalable bitrate capabilities, has better performance, and generates higher quality audio. With this release, we hope to continue to evolve with the community, and with its collective creativity, see new applications being developed and new directions emerging.

New Architecture

Lyra V2 is based on an end-to-end neural audio codec called SoundStream. The architecture has a residual vector quantizer (RVQ) sitting before and after the transmission channel, which quantizes the encoded information into a bitstream and reconstructs it on the decoder side.

Lyra V2's SoundStream architecture
The integration of RVQ into the architecture allows changing the bitrate of Lyra V2 at any time by selecting the number of quantizers to use. When more quantizers are used, higher quality audio is generated (at a cost of a higher bitrate). In Lyra V2, we support three different bitrates: 3.2 kps, 6 kbps, and 9.2 kbps. This enables developers to choose a bitrate most suitable for their network condition and quality requirements.

Lyra V2's model is exported in TensorFlow Lite, TensorFlow's lightweight cross-platform solution for mobile and embedded devices, which supports various platforms and hardware accelerations. The code is tested on Android phones and Linux, with experimental Mac and Windows support. Operation on iOS and other embedded platforms is not currently supported, although we expect it is possible with additional effort. Moreover, this paradigm opens Lyra to any future platform supported by TensorFlow Lite.

Better Performance

With the new architecture, the delay is reduced from 100 ms with the previous version to 20 ms. In this regard, Lyra V2 is comparable to the most widely used audio codec Opus for WebRTC, which has a typical delay of 26.5 ms, 46.5 ms, and 66.5 ms.

Lyra V2 also encodes and decodes five times faster than the previous version. On a Pixel 6 Pro phone, Lyra V2 takes 0.57 ms to encode and decode a 20 ms audio frame, which is 35 times faster than real time. The reduced complexity means that more phones can run Lyra V2 in real time than V1, and that the overall battery consumption is lowered.

Higher Quality

Driven by the advance of machine learning research over the years, the quality of the generated audio is also improved. Our listening tests show that the audio quality (measured in MUSHRA score, an indication of subjective quality) of Lyra V2 at 3.2 kbps, 6 kbps, and
9.2 kbps measures up to Opus at 10 kbps, 13 kbps, and 14 kbps respectively.

Lyra vs. Opus at various bitrates


Sample 1

Sample 2


Original

Opus       @6kbps


LyraV1


Opus     @10kbps


LyraV2 @3.2kbps


Opus           @13k


LyraV2    @6kbps


Opus     @14kbps


LyraV2 @9.2kbps

This makes Lyra V2 a competitive alternative to other state-of-the-art telephony codecs. While Lyra V1 already compares favorably to the Adaptive Multi-Rate (AMR-NB) codec, Lyra V2 further outperforms Enhanced Voice Services (EVS) and Adaptive Multi-Rate Wideband (AMR-WB), and is on par with Opus, all the while using only 50% - 60% of their bandwidth.

Lyra vs. state-of-the-art codecs


Sample 1

Sample 2


Original


AMR-NB


LyraV1


EVS


AMR-WB


Opus           @13kbps


LyraV2    @6kbps

This means more devices can be connected in bandwidth-constrained environments, or that additional information can be sent over the network to reduce voice choppiness through forward error correction and packet loss concealment.

Open Source Release

Lyra V2 continues to provide what is already in Lyra V1 (the build tools, the testing frameworks, the C++ encoding and decoding API, the signal processing toolchain, and the example Android app). Developers who have experience with the Lyra V1 API will find that the V2 API looks familiar, but with a few changes. For example, now it's possible to change bitrates during encoding (more information is available in the release notes). In addition, the model definitions and weights are included as .tflite files. As with V1, this release is a beta version and the API and bitstream are expected to change. The code for running Lyra is open sourced under the Apache license. We can’t wait to see what innovative applications people will create with the new and improved Lyra!

By Hengchin Yeh - Chrome

Acknowledgements

The following people helped make the open source release possible: from Chrome: Alejandro Luebs, Michael Chinen, Andrew Storus, Tom Denton, Felicia Lim, Bastiaan Kleijn, Jan Skoglund, Yaowu Xu, Jamieson Brettle, Omer Osman, Matt Frost, Jim Bankoski; and from Google Research: Neil Zeghidour, Marco Tagliasacchi

UVQ: Measuring YouTube’s Perceptual Video Quality

Online video sharing platforms, like YouTube, need to understand perceptual video quality (i.e., a user's subjective perception of video quality) in order to better optimize and improve user experience. Video quality assessment (VQA) attempts to build a bridge between video signals and perceptual quality by using objective mathematical models to approximate the subjective opinions of users. Traditional video quality metrics, like peak signal-to-noise ratio (PSNR) and Video Multi-Method Assessment Fusion (VMAF), are reference-based and focus on the relative difference between the target and reference videos. Such metrics, which work best on professionally generated content (e.g., movies), assume the reference video is of pristine quality and that one can induce the target video's absolute quality from the relative difference.

However, the majority of the videos that are uploaded on YouTube are user-generated content (UGC), which bring new challenges due to their remarkably high variability in video content and original quality. Most UGC uploads are non-pristine and the same amount of relative difference could imply very different perceptual quality impacts. For example, people tend to be less sensitive to the distortions of poor quality uploads than of high quality uploads. Thus, reference-based quality scores become inaccurate and inconsistent when used for UGC cases. Additionally, despite the high volume of UGC, there are currently limited UGC video quality assessment (UGC-VQA) datasets with quality labels. Existing UGC-VQA datasets are either small in size (e.g., LIVE-Qualcomm has 208 samples captured from 54 unique scenes), compared with datasets with millions of samples for classification and recognition (e.g., ImageNet and YouTube-8M), or don’t have enough content variability (sampling without considering content information, like LIVE-VQC and KoNViD-1k).

In "Rich Features for Perceptual Quality Assessment of UGC Videos", published at CVPR 2021, we describe how we attempt to solve the UGC quality assessment problem by building a Universal Video Quality (UVQ) model that resembles a subjective quality assessment. The UVQ model uses subnetworks to analyze UGC quality from high-level semantic information to low-level pixel distortions, and provides a reliable quality score with rationale (leveraging comprehensive and interpretable quality labels). Moreover, to advance UGC-VQA and compression research, we enhance the open-sourced YouTube-UGC dataset, which contains 1.5K representative UGC samples from millions of UGC videos (distributed under the Creative Commons license) on YouTube. The updated dataset contains ground-truth labels for both original videos and corresponding transcoded versions, enabling us to better understand the relationship between video content and its perceptual quality.

Subjective Video Quality Assessment
To understand perceptual video quality, we leverage an internal crowd-sourcing platform to collect mean opinion scores (MOS) with a scale of 1–5, where 1 is the lowest quality and 5 is the highest quality, for no-reference use cases. We collect ground-truth labels from the YouTube-UGC dataset and categorize UGC factors that affect quality perception into three high-level categories: (1) content, (2) distortions, and (3) compression. For example, a video with no meaningful content won't receive a high quality MOS. Also, distortions introduced during the video production phase and video compression artifacts introduced by third-party platforms, e.g., transcoding or transmission, will degrade the overall quality.

MOS= 2.052 MOS= 4.457
Left: A video with no meaningful content won't receive a high quality MOS. Right: A video displaying intense sports shows a higher MOS.
MOS= 1.242 MOS= 4.522
Left: A blurry gaming video gets a very low quality MOS. Right: A video with professional rendering (high contrast and sharp edges, usually introduced in the video production phase) shows a high quality MOS.
MOS= 2.372 MOS= 4.646
Left: A heavily compressed video receives a low quality MOS. Right: a video without compression artifacts shows a high quality MOS.

We demonstrate that the left gaming video in the second row of the figure above has the lowest MOS (1.2), even lower than the video with no meaningful content. A possible explanation is that viewers may have higher video quality expectations for videos that have a clear narrative structure, like gaming videos, and the blur artifacts significantly reduce the perceptual quality of the video.

UVQ Model Framework
A common method for evaluating video quality is to design sophisticated features, and then map these features to a MOS. However, designing useful handcrafted features is difficult and time-consuming, even for domain experts. Also, the most useful existing handcrafted features were summarized from limited samples, which may not perform well on broader UGC cases. In contrast, machine learning is becoming more prominent in UGC-VQA because it can automatically learn features from large-scale samples.

A straightforward approach is to train a model from scratch on existing UGC quality datasets. However, this may not be feasible as there are limited quality UGC datasets. To overcome this limitation, we apply a self-supervised learning step to the UVQ model during training. This self-supervised step enables us to learn comprehensive quality-related features, without ground-truth MOS, from millions of raw videos.

Following the quality-related categories summarized from the subjective VQA, we develop the UVQ model with four novel subnetworks. The first three subnetworks, which we call ContentNet, DistortionNet and CompressionNet, are used to extract quality features (i.e., content, distortion and compression), and the fourth subnetwork, called AggregationNet, maps the extracted features to generate a single quality score. ContentNet is trained in a supervised learning fashion with UGC-specific content labels that are generated by the YouTube-8M model. DistortionNet is trained to detect common distortions, e.g., Gaussian blur and white noise of the original frame. CompressionNet focuses on video compression artifacts, whose training data are videos compressed with different bitrates. CompressionNet is trained using two compressed variants of the same content that are fed into the model to predict corresponding compression levels (with a higher score for more noticeable compression artifacts), with the implicit assumption that the higher bitrate version has a lower compression level.

The ContentNet, DistortionNet and CompressionNet subnetworks are trained on large-scale samples without ground-truth quality scores. Since video resolution is also an important quality factor, the resolution-sensitive subnetworks (CompressionNet and DistortionNet) are patch-based (i.e., each input frame is divided into multiple disjointed patches that are processed separately), which makes it possible to capture all detail on native resolution without downscaling. The three subnetworks extract quality features that are then concatenated by the fourth subnetwork, AggregationNet, to predict quality scores with domain ground-truth MOS from YouTube-UGC.

The UVQ training framework.

Analyzing Video Quality with UVQ
After building the UVQ model, we use it to analyze the video quality of samples pulled from YouTube-UGC and demonstrate that its subnetworks can provide a single quality score along with high-level quality indicators that can help us understand quality issues. For example, DistortionNet detects multiple visual artifacts, e.g., jitter and lens blur, for the middle video below, and CompressionNet detects that the bottom video has been heavily compressed.

ContentNet assigns content labels with corresponding probabilities in parentheses, i.e., car (0.58), vehicle (0.42), sports car (0.32), motorsports (0.18), racing (0.11).
DistortionNet detects and categorizes multiple visual distortions with corresponding probabilities in parentheses, i.e., jitter (0.112), color quantization (0.111), lens blur (0.108), denoise (0.107).
CompressionNet detects a high compression level of 0.892 for the video above.

Additionally, UVQ can provide patch-based feedback to locate quality issues. Below, UVQ reports that the quality of the first patch (patch at time t = 1) is good with a low compression level. However, the model identifies heavy compression artifacts in the next patch (patch at time t = 2).

Patch at time t = 1 Patch at time t = 2
Compression level = 0.000 Compression level = 0.904
UVQ detects a sudden quality degradation (high compression level) for a local patch.

In practice, UVQ can generate a video diagnostic report that includes a content description (e.g., strategy video game), distortion analysis (e.g., the video is blurry or pixelated) and compression level (e.g., low or high compression). Below, UVQ reports that the content quality, looking at individual features, is good, but the compression and distortion quality is low. When combining all three features, the overall quality is medium-low. We see that these findings are close to the rationale summarized by internal user experts, demonstrating that UVQ can reason through quality assessments, while providing a single quality score.

UVQ diagnostic report. ContentNet (CT): Video game, strategy video game, World of Warcraft, etc. DistortionNet (DT): multiplicative noise, Gaussian blur, color saturation, pixelate, etc. CompressionNet (CP): 0.559 (medium-high compression). Predicted quality score in [1, 5]: (CT, DT, CP) = (3.901, 3.216, 3.151), (CT+DT+CP) = 3.149 (medium-low quality).

Conclusion
We present the UVQ model, which generates a report with quality scores and insights that can be used to interpret UGC video perceptual quality. UVQ learns comprehensive quality related features from millions of UGC videos and provides a consistent view of quality interpretation for both no-reference and reference cases. To learn more, read our paper or visit our website to see YT-UGC videos and their subjective quality data. We also hope that the enhanced YouTube-UGC dataset enables more research in this space.

Acknowledgements
This work was possible through a collaboration spanning several Google teams. Key contributors include: Balu Adsumilli, Neil Birkbeck, Joong Gon Yim from YouTube and Junjie Ke, Hossein Talebi, Peyman Milanfar from Google Research. Thanks to Ross Wolf, Jayaprasanna Jayaraman, Carena Church, and Jessie Lin for their contributions.

Source: Google AI Blog


Using Saliency in progressive JPEG XL images

At Google, we are working towards improving the web experience for users. Getting images delivered fast is a crucial part of the web experience and progressive images can help getting the salient parts, detected by machine learning, first. When you look at an image, you don’t immediately look at the entire image, but tend to gaze at the most interesting, or “salient”, parts of the image first. When delivering images over the web, it is now possible to organize the data in such a way that the most salient parts arrive first. Ideally you don’t even notice that some less salient parts have not yet arrived, because by the time you look at those parts they have already arrived and rendered.

We will explain how this works with the new open source image format JPEG XL, but we’ll start by taking a step back and describing how images are currently delivered and rendered on the web.

How partial images are displayed on the web

It’s important that web sites including images load quickly, because waiting for images to load causes frustration. Two techniques in particular are used to make images appear fast: One is showing an approximation of the image before all bytes of the image are transmitted, often known as “progressive image loading.” Another is making the byte size of the image smaller by using strong image compression.

What is progressive image loading?

Some image formats are implemented in a way that does not allow any kind of progressive image loading; all the bytes of the image have to be received before rendering can begin. The next, most simple, type of image loading is sometimes called “sequential image loading.” For these images, the data is organized in a way that pixels come in a particular order, typically in rows and from top to bottom.

Formats with this kind of image loading include PNG, webp, and JPEG. The JPEG format allows more sophisticated forms of progressive images. Here, we can organize the data so that it comes in multiple scans, with each scan showing more detail than the previous one.

For example, even if only approximately 15% of the data for an image is loaded, it often already has decent results. See the following images comparing no progression:

100% of bytes loaded, original image

15% of bytes loaded, no progressive image loading

15% of bytes loaded, sequential image loading

100% of bytes loaded, original image
15% of bytes loaded, progressive JPEG

In the first scan, the progressive JPEG only has a small amount of information available for the image, (e.g. only the average color of 8x8 blocks). Known as the DC-only scan, because the average color of each 8x8 block is called DC-component in the discrete cosine transform, it is the basis of JPEG image compression. Check out this computerphile video on JPEG DCT for a basic introduction. Instead of displaying an image that consists of 8x8 blocks, JPEG rendering in Chrome and Firefox choose to render the preview with some smoothing, to provide a less distracting experience.

Progressive JPEG XLs

While the quality (and therefore byte-sizes) of the individual scans in a progressive JPEG image can be controlled, the order within a scan is still top to bottom, like in a sequential JPEG. JPEG XL goes beyond that by making it possible to send the data necessary to display all details of the most salient parts first, followed by the less salient parts. For example, in a portrait, we can decide to first send the bytes for the face, and then, for the out-of-focus background.

In general, progressive JPEG XL works in the following way:
  • There is always an 8x8 downsampled image available (similar to a DC-only scan in a progressive JPEG). The decoder can display that with a nice upsampling, which gives the impression of a smoothed version of the image.
  • The image is divided into square groups (typically of size 256 x 256) and it is possible to provide an order of these groups during encoding. In particular, we can order the groups by saliency and choose an order that anticipates where the viewer might look first, while not being disturbing.
While the format allows for a very flexible order of the groups, our current encoder chooses a starting group and then grows concentric squares around that group. This is because we expect that this will be less distracting to the user. To make successive updates even less noticeable, we smooth the boundary between groups for which all the data has arrived and those that still contain an incomplete approximation. One requirement of this technique is a good way of identifying where the salient parts of an image are, which is needed when encoding an image. This information is typically represented by a saliency map which can be visualized as a heatmap image, where the more salient parts are redder.

Original image next to saliency map image
Original image.                                                                                                             Saliency map.

Smooth DC-image next to image with group border
Smooth DC-image.                                                                                                  Image with group order.

Stay tuned for videos showing progressive JPEG XL in action.

How to find good saliency maps for images

Saliency prediction models (overview) aim at predicting which regions in an image will attract human attention. To predict saliency effectively, our model leverages the power of deep neural nets to consider both high level semantic signals like face, objects, shapes etc., as well as low or medium level signals like color, intensity, texture, and so on. The model is trained on a large scale public gaze/saliency data set, to make sure the predicted saliency best mimics human gaze/fixation behaviour on each image. The model takes an image as the input and output a saliency map, which can serve as a visual importance map, and hence help determine the decoding order for each region in the image. Example images and their predicted saliency are as follows:

Example images and their predicted saliency

At the time of writing (July 2021), Chrome and Firefox did not yet support decoding JPEG XL image progressively in the way we describe, but the spec does allow encoding arbitrary group orders.

Different users have different experiences when it comes to looking at images loading on the web.We hope that this way of progressively delivering images will improve user experience especially on lower-bandwidth connections.

By Moritz Firsching and Junfeng He – Google Research

Lyra – enabling voice calls for the next billion users


Lyra Logo

The past year has shown just how vital online communication is to our lives. Never before has it been more important to clearly understand one another online, regardless of where you are and whatever network conditions are available. That’s why in February we introduced Lyra: a revolutionary new audio codec using machine learning to produce high-quality voice calls.

As part of our efforts to make the best codecs universally available, we are open sourcing Lyra, allowing other developers to power their communications apps and take Lyra in powerful new directions. This release provides the tools needed for developers to encode and decode audio with Lyra, optimized for the 64-bit ARM android platform, with development on Linux. We hope to expand this codebase and develop improvements and support for additional platforms in tandem with the community.

The Lyra Architecture

Lyra’s architecture is separated into two pieces, the encoder and decoder. When someone talks into their phone the encoder captures distinctive attributes from their speech. These speech attributes, also called features, are extracted in chunks of 40ms, then compressed and sent over the network. It is the decoder’s job to convert the features back into an audio waveform that can be played out over the listener’s phone speaker. The features are decoded back into a waveform via a generative model. Generative models are a particular type of machine learning model well suited to recreate a full audio waveform from a limited number of features. The Lyra architecture is very similar to traditional audio codecs, which have formed the backbone of internet communication for decades. Whereas these traditional codecs are based on digital signal processing (DSP) techniques, the key advantage for Lyra comes from the ability of the generative model to reconstruct a high-quality voice signal.

Lyra Architecture Chart

The Impact

While mobile connectivity has steadily increased over the past decade, the explosive growth of on-device compute power has outstripped access to reliable high speed wireless infrastructure. For regions where this contrast exists—in particular developing countries where the next billion internet users are coming online—the promise that technology will enable people to be more connected has remained elusive. Even in areas with highly reliable connections, the emergence of work-from-anywhere and telecommuting have further strained mobile data limits. While Lyra compresses raw audio down to 3kbps for quality that compares favourably to other codecs, such as Opus, it is not aiming to be a complete alternative, but can save meaningful bandwidth in these kinds of scenarios.

These trends provided motivation for Lyra and are the reason our open source library focuses on its potential for real time voice communication. There are also other applications we recognize Lyra may be uniquely well suited for, from archiving large amounts of speech, and saving battery by leveraging the computationally cheap Lyra encoder, to alleviating network congestion in emergency situations where many people are trying to make calls at once. We are excited to see the creativity the open source community is known for applied to Lyra in order to come up with even more unique and impactful applications.

The Open Source Release

The Lyra code is written in C++ for speed, efficiency, and interoperability, using the Bazel build framework with Abseil and the GoogleTest framework for thorough unit testing. The core API provides an interface for encoding and decoding at the file and packet levels. The complete signal processing toolchain is also provided, which includes various filters and transforms. Our example app integrates with the Android NDK to show how to integrate the native Lyra code into a Java-based android app. We also provide the weights and vector quantizers that are necessary to run Lyra.

We are releasing Lyra as a beta version today because we wanted to enable developers and get feedback as soon as possible. As a result, we expect the API and bitstream to change as it is developed. All of the code for running Lyra is open sourced under the Apache license, except for a math kernel, for which a shared library is provided until we can implement a fully open solution over more platforms. We look forward to seeing what people do with Lyra now that it is open sourced. Check out the code and demo on GitHub, let us know what you think, and how you plan to use it!

By Andrew Storus and Michael Chinen – Chrome

Acknowledgements

The following people helped make the open source release possible:
Yero Yeh, Alejandro Luebs, Jamieson Brettle, Tom Denton, Felicia Lim, Bastiaan Kleijn, Jan Skoglund, Yaowu Xu, Jim Bankoski (Chrome), Chenjie Gu, Zach Gleicher, Tom Walters, Norman Casagrande, Luis Cobo, Erich Elsen (DeepMind).

Lyra: A New Very Low-Bitrate Codec for Speech Compression

Connecting to others online via voice and video calls is something that is increasingly a part of everyday life. The real-time communication frameworks, like WebRTC, that make this possible depend on efficient compression techniques, codecs, to encode (or decode) signals for transmission or storage. A vital part of media applications for decades, codecs allow bandwidth-hungry applications to efficiently transmit data, and have led to an expectation of high-quality communication anywhere at any time.

As such, a continuing challenge in developing codecs, both for video and audio, is to provide increasing quality, using less data, and to minimize latency for real-time communication. Even though video might seem much more bandwidth hungry than audio, modern video codecs can reach lower bitrates than some high-quality speech codecs used today. Combining low-bitrate video and speech codecs can deliver a high-quality video call experience even in low-bandwidth networks. Yet historically, the lower the bitrate for an audio codec, the less intelligible and more robotic the voice signal becomes. Furthermore, while some people have access to a consistent high-quality, high-speed network, this level of connectivity isn’t universal, and even those in well connected areas at times experience poor quality, low bandwidth, and congested network connections.

To solve this problem, we have created Lyra, a high-quality, very low-bitrate speech codec that makes voice communication available even on the slowest networks. To do this, we’ve applied traditional codec techniques while leveraging advances in machine learning (ML) with models trained on thousands of hours of data to create a novel method for compressing and transmitting voice signals.

Lyra Overview
The basic architecture of the Lyra codec is quite simple. Features, or distinctive speech attributes, are extracted from speech every 40ms and are then compressed for transmission. The features themselves are log mel spectrograms, a list of numbers representing the speech energy in different frequency bands, which have traditionally been used for their perceptual relevance because they are modeled after human auditory response. On the other end, a generative model uses those features to recreate the speech signal. In this sense, Lyra is very similar to other traditional parametric codecs, such as MELP.

However traditional parametric codecs, which simply extract from speech critical parameters that can then be used to recreate the signal at the receiving end, achieve low bitrates, but often sound robotic and unnatural. These shortcomings have led to the development of a new generation of high-quality audio generative models that have revolutionized the field by being able to not only differentiate between signals, but also generate completely new ones. DeepMind’s WaveNet was the first of these generative models that paved the way for many to come. Additionally, WaveNetEQ, the generative model-based packet-loss-concealment system currently used in Duo, has demonstrated how this technology can be used in real-world scenarios.

A New Approach to Compression with Lyra
Using these models as a baseline, we’ve developed a new model capable of reconstructing speech using minimal amounts of data. Lyra harnesses the power of these new natural-sounding generative models to maintain the low bitrate of parametric codecs while achieving high quality, on par with state-of-the-art waveform codecs used in most streaming and communication platforms today. The drawback of waveform codecs is that they achieve this high quality by compressing and sending over the signal sample-by-sample, which requires a higher bitrate and, in most cases, isn’t necessary to achieve natural sounding speech.

One concern with generative models is their computational complexity. Lyra avoids this issue by using a cheaper recurrent generative model, a WaveRNN variation, that works at a lower rate, but generates in parallel multiple signals in different frequency ranges that it later combines into a single output signal at the desired sample rate. This trick enables Lyra to not only run on cloud servers, but also on-device on mid-range phones in real time (with a processing latency of 90ms, which is in line with other traditional speech codecs). This generative model is then trained on thousands of hours of speech data and optimized, similarly to WaveNet, to accurately recreate the input audio.

Comparison with Existing Codecs
Since the inception of Lyra, our mission has been to provide the best quality audio using a fraction of the bitrate data of alternatives. Currently, the royalty-free open-source codec Opus, is the most widely used codec for WebRTC-based VOIP applications and, with audio at 32kbps, typically obtains transparent speech quality, i.e., indistinguishable from the original. However, while Opus can be used in more bandwidth constrained environments down to 6kbps, it starts to demonstrate degraded audio quality. Other codecs are capable of operating at comparable bitrates to Lyra (Speex, MELP, AMR), but each suffer from increased artifacts and result in a robotic sounding voice.

Lyra is currently designed to operate at 3kbps and listening tests show that Lyra outperforms any other codec at that bitrate and is compared favorably to Opus at 8kbps, thus achieving more than a 60% reduction in bandwidth. Lyra can be used wherever the bandwidth conditions are insufficient for higher-bitrates and existing low-bitrate codecs do not provide adequate quality.

Clean Speech
Original
Opus@6kbps
Lyra@3kbps
Speex@3kbps
Noisy Environment
Original
Opus@6kbps
Lyra@3kbps
Speex@3kbps


ReferenceOpus@6kbpsLyra@3kbps


Ensuring Fairness
As with any ML based system, the model must be trained to make sure that it works for everyone. We’ve trained Lyra with thousands of hours of audio with speakers in over 70 languages using open-source audio libraries and then verifying the audio quality with expert and crowdsourced listeners. One of the design goals of Lyra is to ensure universally accessible high-quality audio experiences. Lyra trains on a wide dataset, including speakers in a myriad of languages, to make sure the codec is robust to any situation it might encounter.

Societal Impact and Where We Go From Here
The implications of technologies like Lyra are far reaching, both in the short and long term. With Lyra, billions of users in emerging markets can have access to an efficient low-bitrate codec that allows them to have higher quality audio than ever before. Additionally, Lyra can be used in cloud environments enabling users with various network and device capabilities to chat seamlessly with each other. Pairing Lyra with new video compression technologies, like AV1, will allow video chats to take place, even for users connecting to the internet via a 56kbps dial-in modem.

Duo already uses ML to reduce audio interruptions, and is currently rolling out Lyra to improve audio call quality and reliability on very low bandwidth connections. We will continue to optimize Lyra’s performance and quality to ensure maximum availability of the technology, with investigations into acceleration via GPUs and TPUs. We are also beginning to research how these technologies can lead to a low-bitrate general-purpose audio codec (i.e., music and other non-speech use cases).

Acknowledgements
Thanks to everyone who made Lyra possible including Jan Skoglund, Felicia Lim, Michael Chinen, Bastiaan Kleijn, Tom Denton, Andrew Storus, Yero Yeh (Chrome Media), Henrik Lundin, Niklas Blum, Karl Wiberg (Google Duo), Chenjie Gu, Zach Gleicher, Norman Casagrande, Erich Elsen (DeepMind).

Source: Google AI Blog


Basis Universal Textures – Khronos Ratification and Support

In 2019, Google partnered with Binomial to open source the Basis Universal texture codec with the goal to make high-quality textures more efficient for network transmission and graphics processing unit (GPU) memory usage. The Basis Universal texture format is 6-8 times smaller than JPEG on the GPU, yet has similar storage size as JPEG—making it a great alternative to current GPU compression methods that are inefficient and don’t operate cross platform. The format is intended for a variety of use cases: games, virtual and augmented reality, maps, photos, small videos, and more.

the Basis Universal texture codec
Over the past year, several exciting developments have been made to make Basis Universal more useful. A new high-quality mode was introduced, allowing the codec to use the highest quality formats modern GPUs support, finally bringing the web up to modern GPU texture standards—with cross platform support. Additionally, the Basis encoder now has an option to build a WebAssembly version, allowing for innovative web applications to take advantage of outputting to the super-compressed format. Lastly, the Khronos Group has announced and ratified the Basis Universal texture extension to glTF format, allowing for compressed assets that can be shipped and displayed everywhere in a KTX 2.0 container. This will have profound impacts on how models are distributed via the web and advance applications like eCommerce, making it easy to take advantage of 3D content on any platform.

In addition to these new features, developers worldwide have been making it easier to take advantage of Basis Universal. <model-viewer> has just added support for glTF files with universal textures, making it as easy as two lines of JavaScript to have beautiful, interactive 3D models on your page and in the coming months, the <model-viewer> editor will add support for encoding to universal textures. Additionally, 3D engines like Three.js, Babylon.js, Godot, Archilogic, and Playcanvas have added support for Basis Universal, with more engine support coming. Basis Universal is already in applications many use every day.

We look forward to seeing Basis Universal adoption soar as it has never been easier to distribute 3D assets. Check out the code and demo on GitHub, let us know what you think, and how you plan to use it!

By Stephanie Hurlburt, Binomial and Jamieson Brettle, Chrome Media