Posted by Moritz Hardt, Research ScientistMachine learning and statistical analysis play an important role at the forefront of scientific and technological progress. But with all data analysis, there is a danger that findings observed in a particular sample do not generalize to the underlying population from which the data were drawn. A popular
XKCD cartoon illustrates that if you test sufficiently many different colors of jelly beans for correlation with acne, you will eventually find one color that correlates with acne at a
p-value below the infamous 0.05 significance level.
Unfortunately, the problem of false discovery is even more delicate than the cartoon suggests. Correcting reported p-values for a fixed number of multiple tests is a fairly well understood topic in statistics. A simple approach is to multiply each p-value by the number of tests, but there are more sophisticated tools. However, almost all existing approaches to ensuring the validity of statistical inferences assume that the analyst performs a
fixed procedure chosen before the data are examined. For example, “test all 20 flavors of jelly beans”. In practice, however, the analyst is informed by data exploration, as well as the results of previous analyses. How did the scientist choose to study acne and jelly beans in the first place? Often such choices are influenced by previous interactions with the same data. This
adaptive behavior of the analyst leads to an increased risk of spurious discoveries that are neither prevented nor detected by standard approaches. Each adaptive choice the analyst makes multiplies the number of possible analyses that could possibly follow; it is often difficult or impossible to describe and analyze the exact experimental setup ahead of time.
In
The Reusable Holdout: Preserving Validity in Adaptive Data Analysis, a joint work with
Cynthia Dwork (Microsoft Research),
Vitaly Feldman (IBM Almaden Research Center),
Toniann Pitassi (University of Toronto),
Omer Reingold (Samsung Research America) and
Aaron Roth (University of Pennsylvania), to appear in
Science tomorrow, we present a new methodology for navigating the challenges of adaptivity. A central application of our general approach is the
reusable holdout mechanism that allows the analyst to safely validate the results of many adaptively chosen analyses without the need to collect costly fresh data each time.
The curse of adaptivityA beautiful example of how false discovery arises as a result of adaptivity is
Freedman’s paradox. Suppose that we want to build a model that explains “systolic blood pressure” in terms of hundreds of variables quantifying the intake of various kinds of food. In order to reduce the number of variables and simplify our task, we first select some promising looking variables, for example, those that have a positive correlation with the response variable (systolic blood pressure). We then fit a linear regression model on the selected variables. To measure the goodness of our model fit, we crank out a standard
F-test from our favorite statistics textbook and report the resulting p-value.
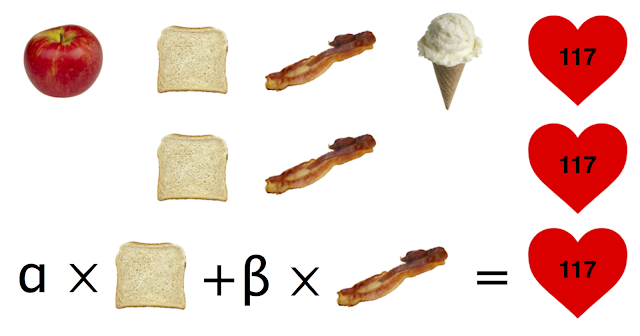 |
| Inference after selection: We first select a subset of the variables based on a data-dependent criterion and then fit a linear model on the selected variables. |
Freedman showed that the reported p-value is highly misleading - even if the data were completely random with no correlation whatsoever between the response variable and the data points, we’d likely observe a significant p-value! The bias stems from the fact that we selected a subset of the variables adaptively based on the data, but we never account for this fact. There is a huge number of possible subsets of variables that we selected from. The mere fact that we chose one test over the other by peeking at the data creates a selection bias that invalidates the assumptions underlying the F-test.
Freedman’s paradox bears an important lesson. Significance levels of standard procedures do not capture the vast number of analyses one can choose to carry out or to omit. For this reason, adaptivity is one of the primary explanations of why research findings are frequently false as was argued by Gelman and Loken who aptly refer to adaptivity as
“garden of the forking paths”.
Machine learning competitions and holdout setsAdaptivity is not just an issue with p-values in the empirical sciences. It affects other domains of data science just as well. Machine learning competitions are a perfect example. Competitions have become an extremely popular format for solving prediction and classification problems of all sorts.
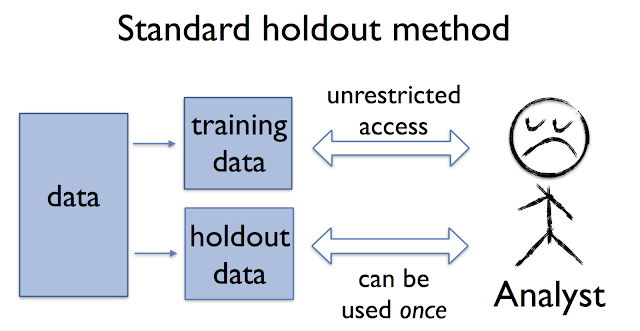
Each team in the competition has full access to a publicly available training set which they use to build a predictive model for a certain task such as image classification. Competitors can repeatedly submit a model and see how the model performs on a fixed holdout data set not available to them. The central component of any competition is the public leaderboard which ranks all teams according to the prediction accuracy of their best model so far on the holdout. Every time a team makes a submission they observe the score of their model on the same holdout data. This methodology is inspired by the classic holdout method for validating the performance of a predictive model.
Ideally, the holdout score gives an accurate estimate of the true performance of the model on the underlying distribution from which the data were drawn. However, this is only the case when the model is independent of the holdout data! In contrast, in a competition the model generally incorporates previously observed feedback from the holdout set. Competitors work adaptively and iteratively with the feedback they receive. An improved score for one submission might convince the team to tweak their current approach, while a lower score might cause them to try out a different strategy. But the moment a team modifies their model based on a previously observed holdout score, they create a dependency between the model and the holdout data that invalidates the assumption of the classic holdout method. As a result, competitors may begin to overfit to the holdout data that supports the leaderboard. This means that their score on the public leaderboard continues to improve, while the true performance of the model does not. In fact, unreliable leaderboards are a widely observed phenomenon in machine learning competitions.
Reusable holdout setsA standard proposal for coping with adaptivity is simply to discourage it. In the empirical sciences, this proposal is known as
pre-registration and requires the researcher to specify the exact experimental setup ahead of time. While possible in some simple cases, it is in general too restrictive as it runs counter to today’s complex data analysis workflows.
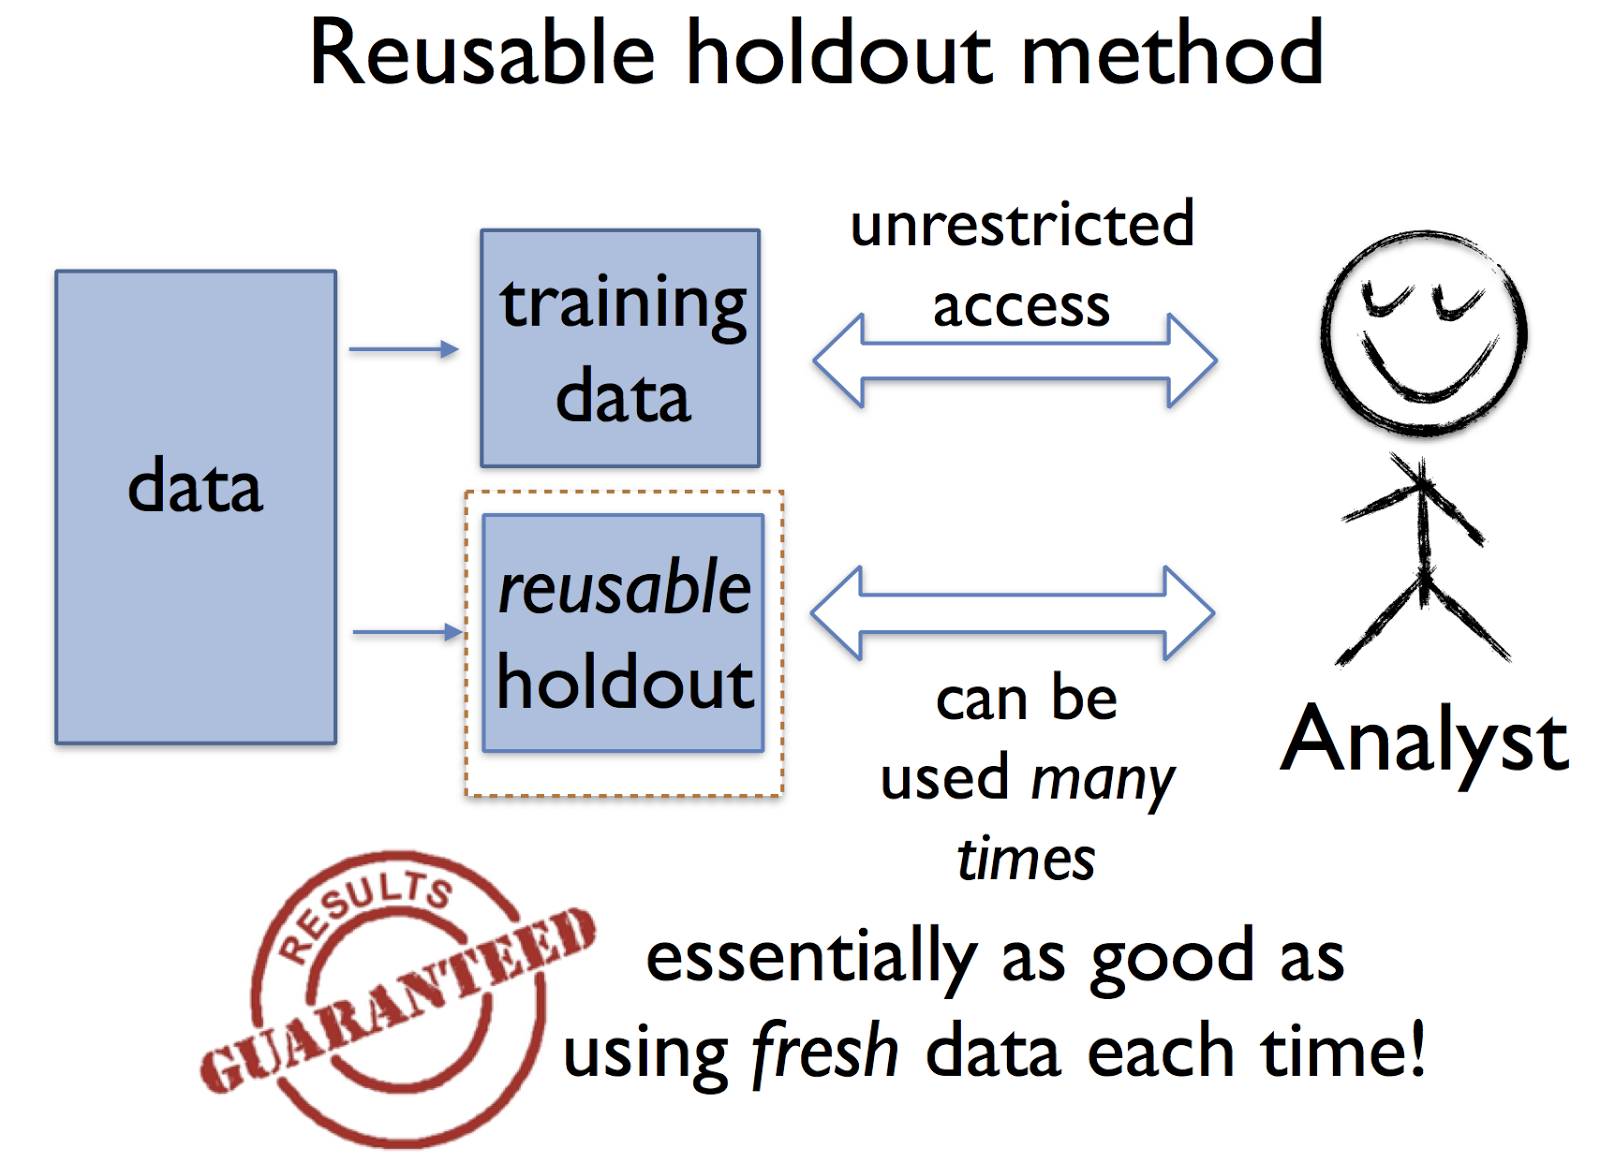
Rather than limiting the analyst, our approach provides means of reliably verifying the results of an arbitrary adaptive data analysis. The key tool for doing so is what we call the
reusable holdout method. As with the classic holdout method discussed above, the analyst is given unfettered access to the training data. What changes is that there is a new algorithm in charge of evaluating statistics on the holdout set. This algorithm ensures that the holdout set maintains the essential guarantees of fresh data over the course of many estimation steps.
The limit of the method is determined by the size of the holdout set - the number of times that the holdout set may be used grows roughly as the square of the number of collected data points in the holdout, as our theory shows.
Armed with the reusable holdout, the analyst is free to explore the training data and verify tentative conclusions on the holdout set. It is now entirely safe to use any information provided by the holdout algorithm in the choice of new analyses to carry out, or the tweaking of existing models and parameters.
A general methodologyThe reusable holdout is only one instance of a broader methodology that is, perhaps surprisingly, based on
differential privacy—a notion of privacy preservation in data analysis. At its core, differential privacy is a notion of
stability requiring that any single sample should not influence the outcome of the analysis significantly.
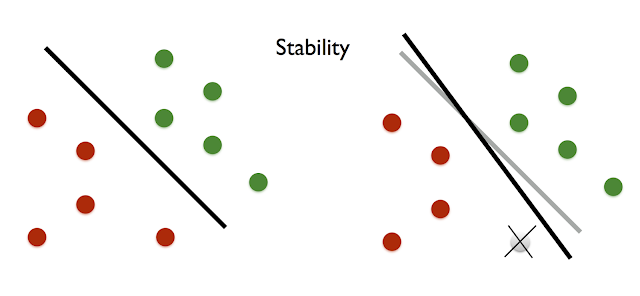 |
| Example of a stable learning algorithm: Deletion of any single data point does not affect the accuracy of the classifier much. |
A beautiful line of work in machine learning shows that various notions of stability imply
generalization. That is any sample estimate computed by a stable algorithm (such as the prediction accuracy of a model on a sample) must be close to what we would observe on fresh data.
What sets differential privacy apart from other stability notions is that it is preserved by
adaptive composition. Combining multiple algorithms that each preserve differential privacy yields a new algorithm that also satisfies differential privacy albeit at some quantitative loss in the stability guarantee. This is true even if the output of one algorithm influences the choice of the next. This strong adaptive composition property is what makes differential privacy an excellent stability notion for adaptive data analysis.
In a nutshell, the reusable holdout mechanism is simply this: access the holdout set only through a suitable differentially private algorithm. It is important to note, however, that the user does not need to understand differential privacy to use our method. The user interface of the reusable holdout is the same as that of the widely used classical method.
Reliable benchmarksA closely
related work with Avrim Blum dives deeper into the problem of maintaining a reliable leaderboard in machine learning competitions (see
this blog post for more background). While the reusable holdout could directly be used for this purpose, it turns out that a variant of the reusable holdout, we call the
Ladder algorithm, provides even better accuracy.
This method is not just useful for machine learning competitions, since there are many problems that are roughly equivalent to that of maintaining an accurate leaderboard in a competition. Consider, for example, a performance benchmark that a company uses to test improvements to a system internally before deploying them in a production system. As the benchmark data set is used repeatedly and adaptively for tasks such as model selection, hyper-parameter search and testing, there is a danger that eventually the benchmark becomes unreliable.
ConclusionModern data analysis is inherently an adaptive process. Attempts to limit what data scientists will do in practice are ill-fated. Instead we should create tools that respect the usual workflow of data science while at the same time increasing the reliability of data driven insights. It is our goal to continue exploring techniques that can help to create more reliable validation techniques and benchmarks that track true performance more accurately than existing methods.


