Tag Archives: Partners

Partner Interconnect now generally available


We are happy to announce that Partner Interconnect, launched in beta in April, is now generally available. Partner Interconnect lets you connect your on-premises resources to Google Cloud Platform (GCP) from the partner location of your choice, at a data rate that meets your needs.

With general availability, you can now receive an SLA for Partner Interconnect connections if you use one of the recommended topologies. If you were a beta user with one of those topologies, you will automatically be covered by the SLA. Charges for the service start with GA (see pricing).

Partner Interconnect is ideal if you want physical connectivity to your GCP resources but cannot connect at one of Google’s peering locations, or if you want to connect with an existing service provider. If you need help understanding the connection options, the information here can help.

In this blog we will walk through how you can start using Partner Interconnect, from choosing a partner that works best for you all the way through how you can deploy and start using your interconnect.


Choosing a partner


If you already have a service provider partner for network connectivity, you can check the list of supported service providers to see if they offer Partner Interconnect service. If not, you can select a partner from the list based on your data center location.

Some critical factors to consider are:
  • Make sure the partner can offer the availability and latency you need between your on-premises network and their network.
  • Check whether the partner offers Layer 2 connectivity, Layer 3 connectivity, or both. If you choose a Layer 2 Partner, you have to configure and establish a BGP session between your Cloud Routers and on-premises routers for each VLAN attachment that you create. If you choose a Layer 3 partner, they will take care of the BGP configuration.
  • Please review the recommended topologies for production-level and non-critical applications. Google provides a 99.99% (with Global Routing) or 99.9% availability SLA, and that only applies to the connectivity between your VPC network and the partner's network.

Bandwidth options and pricing


Partner Interconnect provides flexible options for bandwidth between 50 Mbps and 10 Gbps. Google charges on a monthly basis for VLAN attachments depending on capacity and egress traffic (see options and pricing).

Setting up Partner Interconnect VLAN attachments


Once you’ve established network connectivity with a partner, and they have set up interconnects with Google, you can set up and activate VLAN attachments using these steps:
  1. Create VLAN attachments.
  2. Request provisioning from the partner.
  3. If you have a Layer 2 partner, complete the BGP configuration and then activate the attachments for traffic to start. If you have a Layer 3 partner, simply activate the attachments, or use the pre-activation option.
With Partner Interconnect, you can connect to GCP where and how you want to. Follow these steps to easily access your GCP compute resources from your on-premises network.

Related content


Behind the scenes with the Dragon Ball Legends GCP backend


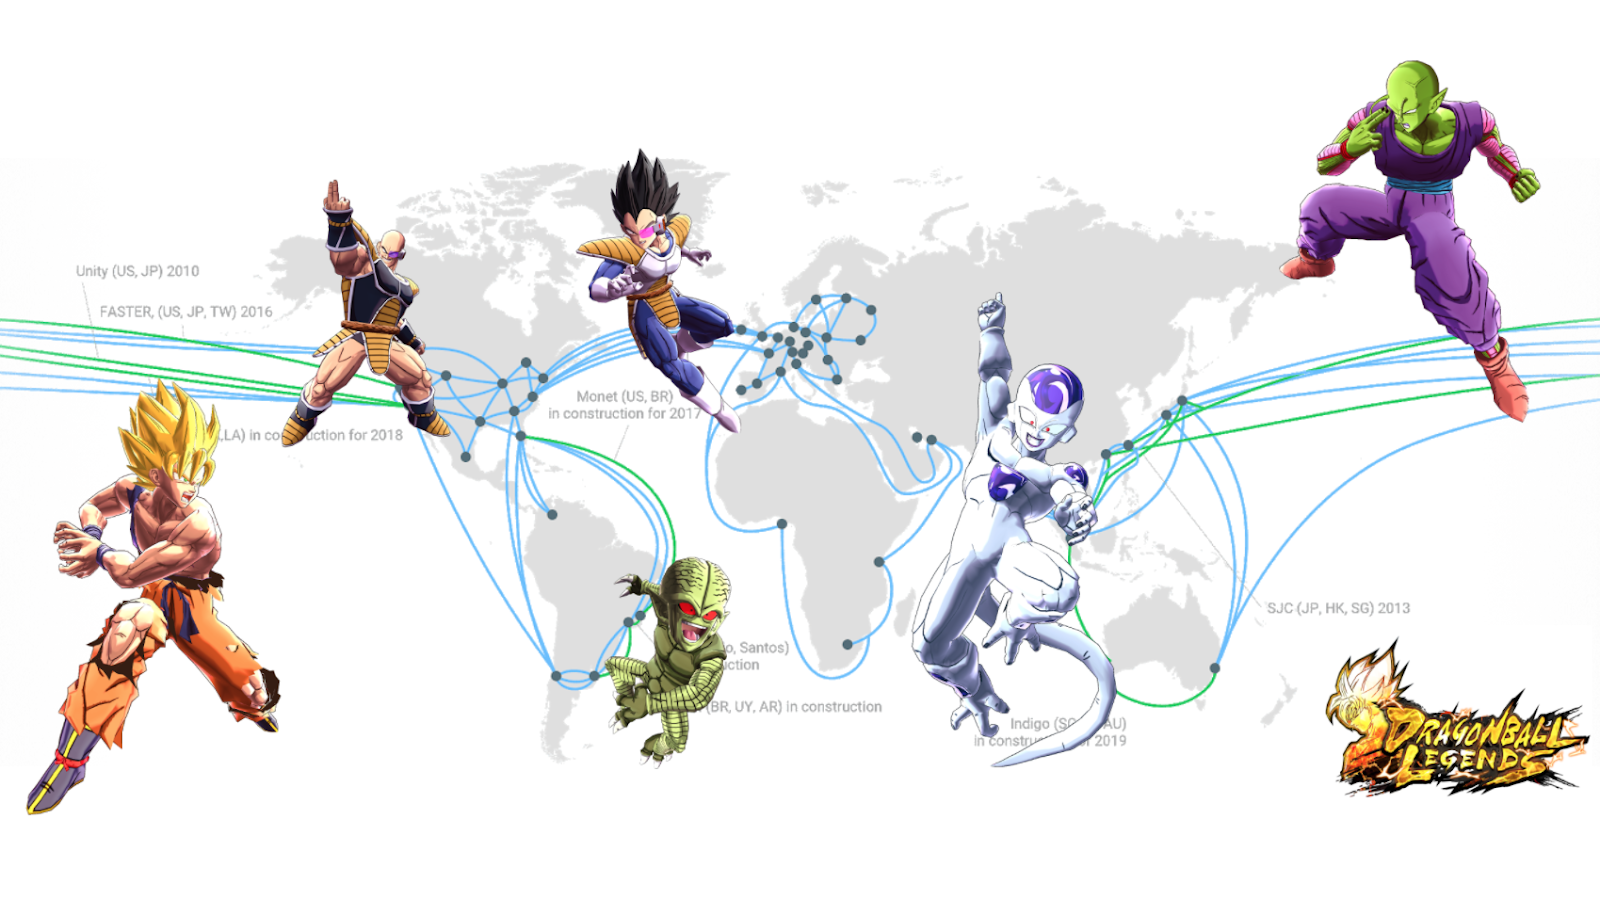
Dragon Ball Legends, a new mobile game from Bandai Namco Entertainment (BNE), is based on its popular Dragon Ball Z franchise, and is rolling out to gamers around the world as we speak. But planning the cloud infrastructure to power the game dates back to February 2017, when BNE approached Google Cloud to talk about the interesting challenges they were facing, and how we could help.

Based on their anticipated demand, BNE had three ambitious requirements for their game:
  1. Extreme scalability. The game would be launched globally, so it needed backend that could scale with millions of players and still perform well.
  2. Global network. Because the game allows real-time player versus player battles, it needs a reliable and low-latency network across regions.
  3. Real-time data analytics. The game is designed to evolve with players in real-time, so it was critical to have a data analytics pipeline to stream data to a data warehouse. Then the operation team can measure and evaluate how people are playing the game and adjust it on-the-fly.
All three of these are areas where we have a lot of experience. Google has multiple global services with more than a billion users, and we use the data those services generate to improve them over time. And because Google Cloud Platform (GCP) runs on the same infrastructure as these Google services, GCP customers can take advantage of the same enabling technologies.

Let’s take a look at how BNE worked with Google Cloud to build the infrastructure for Dragon Ball Legends.


Challenge #1: Extreme scalability

MySQL is extensively used by gaming companies in Japan because engineers are used to working with relational databases with schema, SQL queries and strong consistency. This simplifies a lot on the application side that doesn’t have to handle any database limitations like eventual consistency or schema enforcement. MySQL is a widely used even outside gaming and most backend engineers already have strong experience using this database.

While MySQL offers many advantages, it has one big limitation: scalability. Indeed, as a scale-up database if you want to increase MySQL performance, you need to add more CPU, RAM or disk. And when a single instance of MySQL can’t handle the load anymore, you can divide the load by sharding—splitting users into groups and assigning them to multiple independent instances of MySQL. Sharding has a number of drawbacks, however. Most gaming developers calculate the number of shards they’ll need for the database before the game launches since resharding is labor-intensive and error-prone. That causes gaming companies tend to overprovision the database to eventually handle more players than they expect. If the game is as popular as expected, everything is fine. But what if the game is a runaway hit and exceeds the anticipated demand? And what about the long tail representing a gradual decrease in active players? What if it’s an out-and-out flop? MySQL sharding is not dynamically scalable, and adjusting its size requires maintenance as well as risk.

In an ideal world, databases can scale in and out without downtime while offering the advantages of a relational database. When we first heard that BNE was considering MySQL sharding to handle the massive anticipated traffic for Dragon Ball Legends, we suggested they consider Cloud Spanner instead.


Why Cloud Spanner?

Cloud Spanner is a fully managed relational database that offers horizontal scalability and high availability while keeping strong consistency with a schema that is similar to MySQL’s. Better yet, as a managed service, it’s looked after by Google SREs, removing database maintenance and minimizing the risk of downtime. We thought Cloud Spanner would be able to help BNE make their game global.


Evaluation to implementation

Before adopting a new technology, engineers should always test it to confirm its expected performance in a real world scenario. Before replacing MySQL, BNE created a new Cloud Spanner instance in GCP, including a few tables with a similar schema to what they used in MySQL. Since their backend developers were writing in Scala, they chose the Java client library for Cloud Spanner and wrote some sample code to load-test Cloud Spanner and see if it could keep up with their queries per second (QPS) requirements for writes—around 30,000 QPS at peak. Working with our customer engineer and the Cloud Spanner engineering team, they met this goal easily. They even developed their own DML (Data Manipulation Language) wrapper to write SQL commands like INSERT, UPDATE and DELETE.


Game release

With the proof of concept behind them, they could start their implementation. Based on the expected daily active users (DAU), BNE calculated how many Cloud Spanner nodes they needed—enough for the 3 million pre-registered players they were expecting. To prepare the release, they organized two closed beta tests to validate their backend, and didn’t have a single issue with the database! In the end, over 3 million participants worldwide pre-registered for Dragon Ball Legends, and even with this huge number, the official game release went flawlessly.

Long story short, BNE can focus on improving the game rather than spending time operating their databases.


Challenge #2: Global network

Let’s now talk about BNE’s second challenge: building a global real-time player-vs-player (PvP) game. BNE’s goal for Dragon Ball Legends was to let all its players play against one another, anywhere in the world. If you know anything about networking, you understand the challenge around latency. Round-trip time (RTT) ( between Tokyo and San Francisco, for example, is on average around 100 ms. To address that, they decided to divide every game second into 250 ms intervals. So while the game looks like it’s real-time to users, it’s actually a really fast turn-based game at its core (you can read more about the architecture here). And while some might say that 250ms offers plenty of room for latency, it’s extremely hard to predict the latency when communicating across the Internet.


Why Cloud Networking?

Here’s what it looks like for a game client to access the game server on GCP over the internet. Since the number of hops can vary every time, this means that playing PvP can sometimes feel fast, sometimes slow.

Once of the main reasons BNE decided to use GCP for the Dragon Ball Legends backend was the Google dedicated network. As you can see in the picture below, when using GCP, once the game client accesses one of the hundreds of GCP Point Of Presence (POP) around the world, it’s on the Google dedicated network. That means none unpredictable hops, for predictable and lowest possible latency.


Taking advantage of the Google Cloud Network

Usually, gaming companies implement PvP by connecting two players directly or through a dedicated game server. Usually combat games that require low latency between players will prefer P2P communication. In general, when two players are geographically close, P2P works very well, but it’s often unreliable when trying to communicate across regions (some carriers even block P2P protocols). For two players from two different continents to communicate through Google’s dedicated network, players first try to communicate through P2P, and if that fails, they failover to an open source implementation of STUN/TURN Server called coturn, which acts as a relay between the two players.. That way, cross continent battles leverage the low-latency and reliable Google network as much as possible.


Challenge #3: Real-time data analytics

BNE’s last challenge was around real-time data analytics. BNE wanted to offer the best user experience to their fans and one of the ways to do that is through live game operations, or LiveOps, in which operators make constant changes to the game so it always feels fresh. But to understand players’ needs, they needed data— usually users’ actions log data. And if they could get this data in near real-time, they could then make decisions on what changes to apply to the game to increase users’ satisfaction and engagement.

To gather this data, BNE used a combination of Cloud Pub/Sub, Cloud Dataflow to transform in users’ data in real-time and insert it into BigQuery.
  • Cloud Pub/Sub offers a globally reliable messaging system that buffers the logs until they can be handled by Cloud Dataflow.
  • Cloud Dataflow is a fully managed parallel processing service that lets you execute ETL in real-time and in parallel.
  • BigQuery is the fully managed data warehouse where all the game logs are stored. Since BigQuery offers petabyte-scale storage, scaling was not a concern. Thanks to heavy parallel processing when querying the logs, BNE can get a response to a query, scanning terabytes of data in a few seconds.
This system lets a game producer visualize a player’s behavior in near real-time and take decision on what new features to bring to the game or what to change inside the game to satisfy all their fans.


Takeaways

Using Cloud Spanner, BNE could focus on developing an amazing game instead of spending time on database capacity planning and scaling. Operations-wise, by using a fully managed scalable database, they drastically reduced risks related to human error as well as an operational overhead.

Using Cloud Networking, they leveraged Google’s dedicated network to offer the best user experience to their fans, even when fighting across regions.

And finally, using Google’s analytics stack (Cloud PubSub, Cloud Dataflow and BigQuery), BNE was able to analyze players’ behaviors in near real-time and make decisions about how to adjust the game to make their fans even happier!

If you want to hear more details about how they evaluated and adopted Cloud Spanner for their game, please join them at their Google Cloud NEXT’18 session in San Francisco.

Exploring container security: Using Cloud Security Command Center (and five partner tools) to detect and manage an attack


Editor’s note: This is the sixth in a series of blog posts on container security at Google.

If you suspect that a container has been compromised, what do you do? In today’s blog post on container security, we’re focusing in on container runtime security—how to detect, respond to, and mitigate suspected threats for containers running in production. There’s no one way to respond to an attack, but there are best practices that you can follow, and in the event of a compromise, we want to make it easy for you to do the right thing.

Today, we’re excited to announce that you’ll soon be able to manage security alerts for your clusters in Cloud Security Command Center (Cloud SCC), a central place on Google Cloud Platform (GCP) to unify, analyze and view security data across your organization. Further, even though we just announced Cloud SCC a few weeks ago, already five container security companies have integrated their tools with Cloud SCC to help you better secure the containers you’re running on Google Kubernetes Engine.

With your Kubernetes Engine assets in Cloud SCC, you can view security alerts for your Kubernetes Engine clusters in a single pane of glass, and choose how to best take action. You’ll be able to view, organize and index your Kubernetes Engine cluster assets within each project and across all the projects that your organization is working on. In addition, you’ll be able to associate your container security findings to either specific clusters, container images and/or VM instances as appropriate.

Until then, let’s take a deeper look at runtime security in the context of containers and Kubernetes Engine.

Responding to bad behavior in your containers

Security operations typically includes several steps. For example, NIST’s well known framework includes steps to identify, protect, detect, respond, and recover. In containers, this translates to detecting abnormal behavior, remediating a potential threat, performing forensics after an incident, and enforcing runtime policies in isolated environments such as the new gVisor sandboxed container environment.

But first, how do you detect that a container is acting maliciously? Typically, this requires creating a baseline of what normal behaviour looks like, and using rules or machine learning to detect variation from that baseline. There are many ways to create that initial behavioral baseline (i.e., how a container should act), for example, using kprobes, tracepoints, and eBPF kernel inspection. Deviation from this baseline then triggers an alert or action.

If you do find a container that appears to be acting badly, there are several actions you might want to take, in increasing order of severity:

  • Just send an alert. This notifies your security response team that something unusual had been detected. For example, if security monitoring is relatively new in your environment, you might be worried about having too many false positives. Cloud SCC lets you unify container security signals with other security signals across your organization. With Cloud SCC, you can: see the live monitored state of container security issues in the dashboard; access the details either in the UI or via the API; and set up customer-defined filters to generate Cloud Pub/Sub topics that can then trigger email, SMS, or bugs in Jira.
  • Isolate a container. This moves the container to a new network, or otherwise restricts its network connectivity. For example, you might want to do this if you think one container is being used to perform a denial of service attack on other services.
  • Pause a container, e.g., `gcloud compute instances stop`. This suspends all running processes in the container. For example, if you detect suspected cryptomining, you might want to limit resource use and make a backup prior to further investigation.
  • Restart a container, e.g., `docker restart` or `kubectl delete pod`. This kills and restarts a running container, and resets the current state of the application. For example, if you suspect an attacker has created a foothold in your container, this might be a first step to counter their efforts, but this won’t stop an attacker from replicating an attack—just temporarily remove them.
  • Kill a container, i.e., `docker kill`. This kills a running container, halting all running processes (and less gracefully than `docker stop`). This is typically a last resort for a suspected malicious container.

Analyzing a security incident

After an incident, your security forensics team might step in to determine what really happened, and how they can prevent it the next time around. On Kubernetes Engine, you can look at a few different sources of event information:

  • Security event history and monitoring status in Cloud SCC. You can view the summary status of your assets and security findings in the dashboard, configure alerting and notification to a custom Cloud Pub/Sub topic and then query and explore specific events in detail either via the UI or API.
  • Container logs, kubelet logs, Docker logs, and audit logs in Stackdriver. Kubernetes Engine Audit Logging captures certain actions by default, both in the Kubernetes Engine API (e.g., create cluster, remove nodepool) and in the Kubernetes API (e.g., create a pod, update a DaemonSet).
  • Snapshots. You can snapshot a container’s filesystem in docker with `docker export`.

Announcing our container runtime security partners

To give you the best options for container runtime security on Google Cloud Platform, we’re excited to announce five partners who have already integrated with Cloud SCC: Aqua Security, Capsule8, Stackrox, Sysdig Secure, and Twistlock. These technical integrations allow you to use their cutting-edge security tools with your deployments, and view their findings and recommendations directly in Cloud SCC.

Aqua Security

Aqua’s integration with Cloud SCC provides real-time visibility into container security events and policy violations, including:

  • Inventory of vulnerabilities in container images in Google Container Registry, and alerts on new vulnerabilities
  • Container user security violations, such as privilege escalation attempts
  • Attempts to run unapproved images
  • Policy violations of container network, process, and host resource usage

To learn more and get a demo of Aqua’s integration with Google Cloud SCC, visit aquasec.com/gcp

Capsule8

Capsule8 is a real-time, zero-day attack detection platform purpose-built for modern production infrastructures. The Capsule8 integration with Google delivers continuous security across GCP environments to detect and help shut down attacks as they happen. Capsule8 runs entirely in the customer's Google Compute Engine environment and accounts and only requires a lightweight installation-free sensor running on each Compute Engine instance to stream behavioral telemetry to identify and help shut down zero-day attacks in real-time.

For more information on Capsule8’s integration with GCP, please visit: https://capsule8.com/capsule8-for-google-cloud-platform/

Stackrox

StackRox has partnered with Google Cloud to deliver comprehensive security for customers running containerized applications on Kubernetes Engine. StackRox visualizes the container attack surface, exposes malicious activity using machine learning, and stops attacks. Under the partnership, StackRox is working closely with the GCP team to offer an integrated experience for Kubernetes and Kubernetes Engine users as part of Cloud SCC.

“My current patchwork of security vendor solutions is no longer viable – or affordable – as our enterprise is growing too quickly and cyber threats evolve constantly. StackRox has already unified a handful of major product areas into a single security engine, so moving to containers means positive ROI."

- Gene Yoo, Senior Vice President and Head of Information Security at City National Bank

For more information on StackRox’s integration with GCP, please visit: https://www.stackrox.com/google-partnership

Sysdig Secure

By bringing together container visibility and a native Kubernetes Engine integration, Sysdig Secure provides the ability to block threats, enforce compliance, and audit activity across an infrastructure through microservices-aware security policies. Security events are enriched with hundreds of container and Kubernetes metadata before being sent to Cloud SCC. This brings the most relevant signals to your attention and correlates Sysdig events with other security information sources so you can have a single point of view and the ability to react accordingly at all levels.

"We chose to develop on Google Cloud for its robust, cost-effective platform. Sysdig is the perfect complement because it allows us to effectively secure and monitor our Kubernetes services with a single agent. We're excited to see that Google and Sysdig are deepening their partnership through this product integration.”

- Ashley Penny, VP of infrastructure, Cota Healthcare. 

For more information on Sysdig Secure’s integration with GCP, please visit: https://sysdig.com/gke-monitoring/

Twistlock

Twistlock surfaces cloud-native security intel vulnerability findings, compliance posture, runtime anomalies, and firewall logs directly into Cloud SCC. Customers can use Cloud SCC's big data capabilities to analyze and alert at scale, integrating container, serverless, and cloud-native VM security intelligence alongside other apps and workloads connected to Cloud SCC.

"Twistlock enables us to pinpoint vulnerabilities, block attacks, and easily enforce compliance across our environment, giving our team the visibility and control needed to run containers at scale."

- Anthony Scodary, Co-Founder of Gridspace

For more information on Twistlock’s integration with GCP, please visit: https://twistlock.com/partners/google-cloud-platform

Now you have the tools you need to protect your containers! Safe computing!

And if you’re at KubeCon in Copenhagen, join us at our booth for a demo and discussion around container security.

Expanding our GPU portfolio with NVIDIA Tesla V100


Cloud-based hardware accelerators like Graphic Processing Units, or GPUs, are a great choice for computationally demanding workloads such as machine learning and high-performance computing (HPC). We strive to provide the widest selection of popular accelerators on Google Cloud to meet your needs for flexibility and cost. To that end, we’re excited to announce that NVIDIA Tesla V100 GPUs are now publicly available in beta on Compute Engine and Kubernetes Engine, and that NVIDIA Tesla P100 GPUs are now generally available.

Today’s most demanding workloads and industries require the fastest hardware accelerators. You can now select as many as eight NVIDIA Tesla V100 GPUs, 96 vCPU and 624GB of system memory in a single VM, receiving up to 1 petaflop of mixed precision hardware acceleration performance. The next generation of NVLink interconnects deliver up to 300GB/s of GPU-to-GPU bandwidth, 9X over PCIe, boosting performance on deep learning and HPC workloads by up to 40%. NVIDIA V100s are available immediately in the following regions: us-west1, us-central1 and europe-west4. Each V100 GPU is priced as low as $2.48 per hour for on-demand VMs and $1.24 per hour for Preemptible VMs. Like our other GPUs, the V100 is also billed by the second and Sustained Use Discounts apply.

Our customers often ask which GPU is the best for their CUDA-enabled computational workload. If you’re seeking a balance between price and performance, the NVIDIA Tesla P100 GPU is a good fit. You can select up to four P100 GPUs, 96 vCPUs and 624GB of memory per virtual machine. Further, the P100 is also now available in europe-west4 (Netherlands) in addition to us-west1, us-central1, us-east1, europe-west1 and asia-east1.

Our GPU portfolio offers a wide selection of performance and price options to help meet your needs. Rather than selecting a one-size-fits-all VM, you can attach our GPUs to custom VM shapes and take advantage of a wide selection of storage options, paying for only the resources you need.


Google Cloud GPU Type
VM Configuration Options
NVIDIA GPU
GPU Mem
GPU Hourly Price**
GPUs
vCPUs*
System Memory*
16GB
$2.48 Standard
$1.24 Preemptible
1,8
(2,4) coming in beta
1-96
1-624 GB
16GB
$1.46 Standard
$0.73 Preemptible
1,2,4
1-96
1-624 GB
12GB
$0.45 Standard
$0.22 Preemptible
1,2,4,8
1-64
1-416 GB

* Maximum vCPU count and system memory limit on the instance might be smaller depending on the zone or the number of GPUs selected.
** GPU prices listed as hourly rate, per GPU attached to a VM that are billed by the second. Pricing for attaching GPUs to preemptible VMs is different from pricing for attaching GPUs to non-preemptible VMs. Prices listed are for US regions. Prices for other regions may be different. Additional Sustained Use Discounts of up to 30% apply to GPU on-demand usage only.


Google Cloud makes managing GPU workloads easy for both VMs and containers. On Google Compute Engine, customers can use instance templates and managed instance groups to easily create and scale GPU infrastructure. You can also use NVIDIA V100s and our other GPU offerings in Kubernetes Engine, where Cluster Autoscaler helps provide flexibility by automatically creating nodes with GPUs, and scaling them down to zero when they are no longer in use. Together with Preemptible GPUs, both Compute Engine managed instance groups and Kubernetes Engine’s Autoscaler let you optimize your costs while simplifying infrastructure operations.

LeadStage, a marketing automation provider, is impressed with the value and scale of GPUs on Google Cloud.

"NVIDIA GPUs work great for complex Optical Character Recognition tasks on poor quality data sets. We use V100 and P100 GPUs on Google Compute Engine to convert millions of handwritten documents, survey drawings, and engineering drawings into machine-readable data. The ability to deploy thousands of Preemptible GPU instances in seconds was vastly superior to the capacity and cost of our previous GPU cloud provider." 
— Adam Seabrook, Chief Executive Officer, LeadStage
Chaos Group provides rendering solutions for visual effects, film, architectural, automotive design and media and entertainment, and is impressed with the speed of NVIDIA V100s on Google Cloud.

"V100 GPUs are great for running V-Ray Cloud rendering services. Among all possible hardware configurations that we've tested, V100 ranked #1 on our benchmarking platform. Thanks to V100 GPUs we can use cloud GPUs on-demand on Compute Engine to render our clients' jobs extremely fast."
— Boris Simandoff, Director of Engineering, Chaos Group
 If you have computationally demanding workloads, GPUs can be a real game-changer. Check our GPU page to learn more about how you can benefit from P100, V100 and other Google Cloud GPUs!

Introducing Partner Interconnect, a fast, economical onramp to GCP


If you’re building a link between your data center and Google Cloud, we have three ways to get you there: Cloud VPN over the public internet, Dedicated Interconnect, and now, Partner Interconnect—high-bandwidth connectivity to the nearest Google Cloud Platform (GCP) region through our many partners.

Like Dedicated Interconnect, Partner Interconnect offers private connectivity to GCP to organizations that don't require the full 10Gbps of a dedicated circuit. Partner Interconnect also allows organizations whose data centers are geographically distant from a Google Cloud region or Point of Presence (POP) to connect to GCP, using our partners’ connections.

Connect with who you want, how you want

Partner Interconnect lets you connect to GCP from a convenient location, at a data rate that meets your needs. Partner Interconnect lets you purchase a partial circuit, from 50Mbps to 10Gbps. In contrast, Dedicated Interconnect offers full circuits that are 10Gbps links.

Partner Interconnect also lets you pick from a list of providers to connect from your facility to the nearest Google Cloud POP. At launch, Partner Interconnect is available from partners across the globe, who together provide expansive coverage to GCP.
List of Google partners at launch

Getting up and running with Partner Interconnect is easy, as our partners have already set up and certified the infrastructure with Google Cloud. This provides a turnkey solution that minimizes the effort needed to bring up network connectivity from your data center to GCP.

Built on the Google network

With Partner Interconnect you get access to the GCP network and the global infrastructure that it connects to. We’ve built the GCP network over the last decade, it supports many POPs around the globe and we continue to invest in it to meet the growing needs of our customers.

Once connected to the GCP network, you have access to advanced networking technologies like GCP VPC, which seamlessly gives you a global reach to our distributed data centers across our backbone. No need to have distinct connections to each GCP region—just connect to one of our many partners and we take care of the rest behind the scenes!

GCP’s Global VPC enables access to your entire deployment by connecting to a single region.

Partner Interconnect will be generally available in the coming weeks. You can learn more at the Cloud Interconnect page. And if you’re a service provider who would like to help your customers connect to our cloud, please contact your local Google Cloud representative.

Introducing Kayenta: An open automated canary analysis tool from Google and Netflix


To perform continuous delivery at any scale, you need to be able to release software changes not just at high velocity, but safely as well. Today, Google and Netflix are pleased to announce Kayenta, an open-source automated canary analysis service that allows teams to reduce risk associated with rolling out deployments to production at high velocity.

Developed jointly by Google and Netflix, Kayenta is an evolution of Netflix’s internal canary system, reimagined to be completely open, extensible and capable of handling more advanced use cases. It gives enterprise teams the confidence to quickly push production changes by reducing error-prone, time-intensive and cumbersome manual or ad-hoc canary analysis.

Kayenta is integrated with Spinnaker, an open-source multi-cloud continuous delivery platform.

This allows teams to easily set up an automated canary analysis stage within a Spinnaker pipeline. Kayenta fetches user-configured metrics from their sources, runs statistical tests, and provides an aggregate score for the canary. Based on the score and set limits for success, Kayenta can automatically promote or fail the canary, or trigger a human approval path.
"Automated canary analysis is an essential part of the production deployment process at Netflix and we are excited to release Kayenta. Our partnership with Google on Kayenta has yielded a flexible architecture that helps perform automated canary analysis on a wide range of deployment scenarios such as application, configuration and data changes. Spinnaker’s integration with Kayenta allows teams to stay close to their pipelines and deployments without having to jump into a different tool for canary analysis. By the end of the year, we expect Kayenta to be making thousands of canary judgments per day. Spinnaker and Kayenta are fast, reliable and easy-to-use tools that minimize deployment risk, while allowing high velocity at scale."

Greg Burrell, Senior Reliability Engineer at Netflix (read more in Netflix’s blog post)
A final result summary from Kayenta looks something like the following:
“Canary analysis along with Spinnaker deployment pipelines enables us to automatically identify bad deployments. With 1000+ pipelines running in production, any form of human intervention as a part of canary analysis can be a huge blocker to our continuous delivery efforts. Automated canary deployment, as enabled by Kayenta, has allowed our team to increase development velocity by detecting anomalies faster. Additionally, being open source, standardizing on Kayenta helps reduce the risk of vendor lock-in. We look forward to working closely with Google and Netflix to further integrate Kayenta into our development cycle and get rid of our self-developed Jenkins job canary”

— Tom Feiner, Systems Operations Engineer at Waze

Continuous delivery challenges at scale


Canary analysis is a good way to reduce the risk associated with introducing new changes to end users in production. The basic idea is to route a small subset of production traffic, for example 1%, through a deployment that reflects the changes (the canary) and a newly deployed instance that has the same code and configuration as production (the baseline). The production instance is not modified in any way. Typically three instances are created each for baseline and canary, while production has multiple instances. Creating a new baseline helps minimize startup effects and limit the system variations between it and the canary. The system then compares the key performance and functionality metrics between the canary and the baseline, as chosen by the system owner. To continue with deployment, the canary should behave as well or better than the baseline.
Canary analysis is often carried out in a manual, ad-hoc or statistically incorrect manner. A team member, for instance, manually inspects logs and graphs showcasing a variety of metrics (CPU usage, memory usage, error rate, CPU usage per request) across the canary and production to make a decision on how to proceed with the proposed change. Manual or ad-hoc canary analysis can cause additional challenges:

  • Speed and scalability bottlenecks: For organizations like Google and Netflix that run at scale and that want to perform comparisons many times over multiple deployments in a single day, manual canary analysis isn't really an option. Even for other organizations, a manual approach to canary analysis can’t keep up with the speed and shorter delivery time frame of continuous delivery. Configuring dashboards for each canary release can be a significant manual effort, and manually comparing hundreds of different metrics across the canary and baseline is tiresome and laborious.
  • Accounting for human error: Manual canary analysis requires subjective assessment and is prone to human bias and error. It can be hard for people to separate real issues from noise. Humans often make mistakes while interpreting metrics and logs and deciding whether to promote or fail the canary. Collecting, monitoring and then aggregating multiple canary metrics for analysis in a manual manner further adds to the areas where an error can be made because of human judgement.
  • Risk of incorrect decisions: Comparing short-term metrics of a new deployment to the long-running production instances in a manual or ad-hoc fashion is an inaccurate way to identify the health of the canary. Mainly because it can be hard to distinguish whether the performance deviations you see in the canary are statistically relevant or simply random. As a result, you may end up pushing bad deployments to production.
  • Poor support for advanced use cases: To optimize the continuous delivery cycle with canary analysis, you need a high degree of confidence about whether to promote or fail the canary. But gaining the confidence to make go/no-go decisions based on manual or ad-hoc processes is time-consuming, primarily because a manual or ad-hoc canary analysis can’t handle advanced use cases such as adjusting boundaries and parameters in real-time.

The Kayenta approach 

Compared to manual or ad-hoc analysis, Kayenta runs automatic statistical tests on user-specified metrics and returns an aggregate score (success, marginal, failure). This rigorous analysis helps better inform rollout or rollback decisions and identify bad deployments that might go unnoticed with traditional canary analysis. Other benefits of Kayenta include:

  • Open: Enterprise teams that want to perform automated canary analysis with commercial offerings must provide confidential metrics to the provider, resulting in vendor lock-in.
  • Built for hybrid and multi-cloud: Kayenta provides a consistent way to detect problems across canaries, irrespective of the target environment. Given its integration to Spinnaker, Kayenta lets teams perform automated canary analysis across multiple environments, including Google Cloud Platform (GCP), Kubernetes, on-premise servers or other cloud providers.
  • Extensible: Kayenta makes it easy to add new metric sources, judges, and data stores. As a result, you can configure Kayenta to serve more diverse environments as your needs change.
  • Gives confidence quickly: Kayenta lets you adjust boundaries and parameters while performing automatic canary analysis. This lets you move fast and decide whether to promote or fail the canary as soon as you’ve collected enough data.
  • Low overhead: It's easy to get started with Kayenta. No need to write custom scripts or manually fetch canary metrics, merge these metrics or perform statistical analysis to decide whether to either deploy or rollback the canary. Deep links are provided by Kayenta within canary analysis results for in-depth diagnostic purposes.
  • Insight: For advanced use cases, Kayenta can help perform retrospective canary analysis. This gives engineering and operations teams insights into how to refine and improve canary analysis over time.

Integration with Spinnaker

Kayenta’s integration to Spinnaker has produced a new “Canary” pipeline stage in Spinnaker. Here you can specify which metrics to check from which sources, including monitoring tools such as Stackdriver, Prometheus, Datadog or Netflix’s internal tool Atlas. Next, Kayenta fetches metrics data from the source, creates a pair of control/experiment time series datasets and calls a Canary Judge. The Canary Judge performs statistical tests, evaluating each metric individually, and returns an aggregate score from 0 to 100 using pre-configured metric weights. Depending on user configuration, the score is then classified as "success," "marginal," or "failure." Success promotes the canary and continues the deployment, a marginal score can trigger a human approval path and failure triggers a roll back.

Join us!


With Kayenta, you now have an open, automated way to perform canary analysis and quickly deploy changes to production with confidence. By open-sourcing Kayenta, our goal is to build a community where metric stores and judges are provided both by the open source community and via proprietary systems. Here are some ways you can learn more about Kayenta and contribute to the project:


  • Read more about Kayenta in Netflix’s blog
  • Attend Spinnaker meetup in Bay Area

We hope you will join us!

Expanding MongoDB Atlas availability on GCP


With over 35 million downloads and customers ranging from Cisco to Metlife to UPS, MongoDB is one of the most popular NoSQL databases for developers and enterprises alike.

MongoDB is available on Google Cloud Platform (GCP) through MongoDB’s simple-to-use, fully managed Database as a Service (DBaaS) product, MongoDB Atlas. With MongoDB Atlas, you get a globally distributed database with cross-region replication, multi-region fault tolerance and the ability to provide fast, responsive read access to data users around the globe. You can even configure your clusters to survive the outage of an entire cloud region.

Now, thanks to strong demand for MongoDB Atlas from GCP customers, Google and MongoDB have expanded the availability of MongoDB Atlas on GCP, making it available across most GCP regions as well as on Cloud Launcher.
With this expanded geographic availability, you can now join the wide variety of organizations around the world, from innovators in the social media space to industry leaders in energy, that are already running MongoDB on GCP.

How MongoDB Atlas works on GCP 


But first, to understand how MongoDB Atlas works on GCP, let’s discuss the architecture of a MongoDB cluster.

MongoDB maintains multiple copies of data called replica sets using native replication. A replica set is a fully self-healing unit that helps prevent database downtime. Failover is fully automated, eliminating the need for administrators to intervene manually.
You can configure the number of replicas in a MongoDB replica set; a larger number of replicas provides increased data availability and protection against database downtime (e.g., in case of multiple machine failures, rack failures, data center failures or network partitions). It's recommended that any MongoDB cluster include at least three replica set members, ideally geographically distributed to ensure no single point of failure.

Alternatively, you can configure operations to write to multiple replicas before returning the write acknowledgement to the application, for near-synchronous replication. This multi-data center awareness enables global data distribution and separation between operational and analytical workloads. Replica sets also provide operational flexibility by providing a way to upgrade hardware and software without taking the database offline.

MongoDB provides horizontal scale-out in the cloud via a process called sharding. Sharding distributes data across multiple physical partitions (shards). Sharding allows MongoDB to address the hardware limitations of a single server without adding complexity to the application. MongoDB automatically balances the data in the cluster as the data grows or the size of the cluster increases or decreases.

Sharding is transparent to applications; whether there's one or one hundred shards, the application code for querying MongoDB is the same.
MongoDB provides multiple sharding policies, letting you distribute data across a cluster according to query patterns or data locality.

MongoDB clusters managed by MongoDB Atlas on GCP are organized into Projects. All clusters within a Project live inside a single Virtual Private Cloud (VPC) per region, ensuring network isolation from other customers. By default, clusters contain three MongoDB replica set members, which are distributed across the available zones within a single GCP region.

Creating a globally distributed database with MongoDB Atlas


Configuring cross-region replication is easy from the MongoDB Atlas UI, as shown below:
Once configured, MongoDB Atlas automatically scales the storage on clusters and makes it easy to scale the compute (memory and CPU), to larger cluster sizes, or enable sharding in the UI or API, with no manual intervention.

We hope you take advantage of the availability of MongoDB Atlas across more GCP regions to reduce the operational overhead of setting up and scaling the database, letting you focus on building better apps, faster. We look forward to seeing what you build and hearing your feedback so we can continue to make GCP the best place for running MongoDB in the cloud.

More on MongoDB


Easy HPC clusters on GCP with Slurm


High performance and technical computing is all about scale and speed. Many applications, such as drug discovery and genomics, financial services and image processing require access to a large and diverse set of computing resources on demand. With more and faster computing power, you can convert an idea into a discovery, a hypothesis into a cure or an inspiration into a product. Google Cloud provides the HPC community with on-demand access to large amounts of high-performance resources with Compute Engine. But a challenge remains: how do you harness these powerful resources to execute your HPC jobs quickly, and seamlessly augment an existing HPC cluster with Compute Engine capacity?

To help with this problem, we teamed up with SchedMD to release a preview of tools that makes it easier to launch the Slurm workload manager on Compute Engine, and to expand your existing cluster when you need extra resources. This integration was built by the experts at SchedMD in accordance with Slurm best practices. Slurm is a leading open-source HPC workload manager used often in the TOP500 supercomputers around the world.
With this integration, you can easily launch an auto-scaled Slurm cluster on Compute Engine. The cluster auto-scales according to job requirements and queue depth. Once the Slurm cloud cluster is setup, you can also use Slurm to federate jobs from your on-premises cluster to the Slurm cluster running in Compute Engine. With your HPC cluster in the cloud, you can give each researcher, team or job a dedicated, tailor-fit set of elastic resources so they can focus on solving their problems rather than waiting in queues.
Let’s walk through launching a Slurm cluster on Compute Engine.

Step 1: Grab the Cloud Deployment Manager scripts from SchedMD’s Github repository. Review the included README.md for more information. You may want to customize the deployment manager scripts for your needs. Many cluster parameters can be configured in the included slurm-cluster.yaml file.

At a minimum, you need to edit slurm-cluster.yaml to paste in your munge_key and specify your GCP username in default_users and the Slurm version you want to use (e.g., 17.11.5).

Step 2: Run the following command from the Cloud Shell or your local terminal with gcloud command installed:

gcloud deployment-manager deployments create slurm --config 
slurm-cluster.yaml

Then, navigate to the Deployment Manager section of the developer console and observe that your deployment is successful.
Step 3: If you navigate to the Compute Engine section of the developer console, you’ll see that Deployment Manager created a number of VM instances for you, among them a Slurm login node. After the VMs are provisioned, Slurm will be installed and configured on the VMs. You can now SSH into the login node by clicking the SSH button in the console or by running gcloud compute ssh login1 --zone=us-west1-a (Note: You may need to change the zone if you modified it in the slurm-cluster.yaml file.

Once you’ve logged in, you can interact with Slurm and submit jobs as usual using sbatch. For example, copy the sample script below into a new file called slurm-sample1.sh:

#!/bin/bash
#
#SBATCH --job-name=hostname_sleep_sample
#SBATCH --output=out_%j.txt
#
#SBATCH --nodes=2

srun hostname
sleep 60

Then, submit it with:

sbatch slurm-sample1.sh

You can then observe the job being distributed to the compute nodes using the sinfo and squeue commands. Notice how if the submitted job requires more resources than initially deployed, new instances will be automatically created, up to the maximum specified in slurm-cluster.yaml. To try this, set #SBATCH --nodes=4 and resubmit the job. Once the ephemeral compute instances are idle for a period of time specified, they'll be deprovisioned.

Note that for your convenience the deployment manager scripts set up NFS as part of the deployment.

Check out the included README for more information and if you need help getting started with Slurm check out the quick start guide or contact SchedMD.

Expanding our Google Cloud security partnerships


As we discussed in today’s blog post, security is top of mind for many businesses as they move to the cloud. To help more businesses take advantage of the cloud’s security benefits, we’re working with several leading security providers to offer solutions that complement Google Cloud Platform’s capabilities, and enable customers to leverage their existing tools from these vendors in the cloud. These partner solutions cover a broad set of enterprise security needs, such as advanced threat prevention, compliance, container security, managed security services and more.

Today, we’re announcing new partnerships, new solutions by existing partners and new partner integrations in our Cloud Security Command Center (Cloud SCC), currently in alpha. Here’s a little more on what each of these partnerships will offer:

Auth0 offers the ability to secure cloud endpoints and seamlessly implement secure identity management into customer products and services. Whether the goal is to add additional authentication sources like social login, migrate users without requiring password resets or add multi-factor authentication, Auth0 provides a range of services to accomplish many identity-related tasks. Auth0’s platform supports multiple use cases (B2B, B2C, B2E, IoT, API) and integrates into existing tech stacks.

Check Point  can now secure multiple VPCs using a single CloudGuard security gateway to protect customer applications. A single CloudGuard gateway can monitor traffic in and out of more than one VPC network at any given time, providing a more efficient and scalable solution for running and securing workloads.

Cloudflare Web Application Firewall helps prevents attackers from compromising sensitive customer data, and helps protect customers from common vulnerabilities like SQL injection attacks, cross-site scripting and cross-site forgery. Additionally, integration with the Cloud Security Command CenterAlpha combines their intelligence with Google security and data risk insights to give customers a holistic view of their security posture.

Dome9 has developed a compliance test suite for the Payment Card Industry Data Security Standard (PCI DSS) in the Dome9 Compliance Engine. Using the Compliance Engine, Google Cloud customers can assess the compliance posture of their projects, identify risks and gaps, fix issues such as overly permissive firewall rules, enforce compliance requirements and demonstrate compliance in audits. The integration between the Dome9 Arc platform and the Cloud Security Command Center allows customers to consume and explore the results of assessments of the Dome9 Compliance Engine directly from Cloud SCC.

Fortinet provides scalable network protection for workloads in Google Cloud Platform (GCP). Its FortiGate provides next-generation firewall and advanced security, and its Fortinet Security Fabric integration enables single pane-of-glass visibility and policy across on-premises workloads and GCP for consistent hybrid cloud security.

Palo Alto Networks VM-Series Next Generation Firewall helps customers to securely migrate their applications and data to GCP, protecting them through application whitelisting and threat prevention policies. Native automation features allow developers and cloud architects to create “touchless” deployments and policy updates, effectively embedding the VM-Series into the application development workflow. The VM-Series on GCP can be configured to forward threat prevention, URL Filtering and WildFire logs of high severity to the Cloud Security Command Center to provide a consolidated view of a customer’s GCP security posture.

Qualys provides vulnerability assessments for Google Compute Engine instances. Users can get their vulnerability posture at a glance and drill down for details and actionable intelligence for the vulnerabilities identified. Customers can get this visibility within the Cloud Security Command Center by deploying the lightweight Qualys agents on the instances, baking them into images or deploying them directly into Compute Engine instances.

Rackspace Managed Security and Compliance Assistance provides additional active security on GCP to detect and respond to advanced cyber threats. Rackspace utilizes pre-approved actions to promptly remediate security incidents. It also complements the strategic planning, architectural guidance and 24x7x365 operational support available through Managed Services for GCP.

RedLock Cloud 360 Platform is a cloud threat defense security and compliance solution that provides additional visibility and control for GCP. RedLock collects and correlates disparate data sets from Google Cloud to determine the risk posture of a customer’s environment, then employs risk scoring algorithms to help prioritize and remediate the highest risks. Redlock’s integration with the Cloud Security Command Center provides customers with centralized visibility into security and compliance risks. As part of the integration, RedLock periodically scans a customer's Google Cloud environments and sends results pertaining to resource misconfigurations, compliance violations, network security risks and anomalous user activities.

StackRox augments Google Kubernetes Engine’s built-in security functions with a deep focus on securing the container runtime environment. StackRox’s core capabilities and functionality include network discovery and visualization of the application, detection of adversarial actions and detection of new attacks via machine-learning capabilities.

Sumo Logic Machine Data Analytics Platform offers enterprise-class monitoring, troubleshooting and security for mission-critical cloud applications. Sumo Logic platform integrates directly with GCP services through Google Stackdriver to collect audit and operational data in real-time so that customers can monitor and troubleshoot Google VPC, Cloud IAM, Cloud Audit, App Engine, Compute Engine, Cloud SQL, BigQuery, Cloud Storage, Kubernetes Engine and Cloud Functions, with more coming soon.

To learn more about our partner program, or to find a partner, visit our partner page.