Tag Archives: Management Tools

Partnering on open source: Managing Google Cloud Platform with Chef


Managing cloud resources is a critical part of the application lifecycle. That’s why today, we released and open sourced a set of comprehensive cookbooks for Chef users to manage Google Cloud Platform (GCP) resources.

Chef is a continuous automation platform powered by an awesome community. Together, Chef and GCP enable you to drive continuous automation across infrastructure, compliance and applications.

The new cookbooks allow you to define an entire GCP infrastructure using Chef recipes. The Chef server then creates the infrastructure, enforces it, and ensures it stays in compliance. The cookbooks are idempotent, meaning you can reapply them when changes are required and still achieve the same result.

The new cookbooks support the following products:


We also released a unified authentication cookbook that provides a single authentication mechanism for all the cookbooks.

These new cookbooks are Chef certified, having passed the Chef engineering team’s rigorous quality and review bar, and are open-source under the Apache-2.0 license on GCP's Github repository.

We tested the cookbooks on CentOS, Debian, Ubuntu, Windows and other operating systems. Refer to the operating system support matrix for compatibility details. The cookbooks work with Chef Client, Chef Server, Chef Solo, Chef Zero, and Chef Automate.

To learn more about these Chef cookbooks, register for the webinar with myself and Chef’s JJ Asghar on 15 October 2017.

Getting started with Chef on GCP

Using these new cookbooks is as easy as following these four steps:
  1. Install the cookbooks.
  2. Get a service account with privileges for the GCP resources that you want to manage and enable the the APIs for each of the GCP services you will use.
  3. Describe your GCP infrastructure in Chef:
    1. Define a gauth_credential resource
    2. Define your GCP infrastructure
  4. Run Chef to apply the recipe.
Now, let’s discuss these steps in more detail.

1. Install the cookbooks

You can find all the GCP cookbooks for Chef on Chef Supermarket. We also provide a “bundle” cookbook that installs every GCP cookbook at once. That way you can choose the granularity of the code you pull into your infrastructure.

Note: These Google cookbooks require neither administrator privileges nor special privileges/scopes on the machines that Chef runs on. You can install the cookbooks either as a regular user on the machine that will execute the recipe, or on your Chef server; the latter option distributes the cookbooks to all clients.

The authentication cookbook requires a few of our gems. You can install them using various methods, including using Chef itself:


chef_gem 'googleauth'
chef_gem 'google-api-client'


For more details on how to install the gems, please visit the authentication cookbook documentation.

Now, you can go ahead and install the Chef cookbooks. Here’s how to install them all with a single command:


knife cookbook site install google-cloud


Or, you can install only the cookbooks for select products:


knife cookbook site install google-gcompute    # Google Compute Engine
knife cookbook site install google-gcontainer  # Google Container Engine
knife cookbook site install google-gdns        # Google Cloud DNS
knife cookbook site install google-gsql        # Google Cloud SQL
knife cookbook site install google-gstorage    # Google Cloud Storage


2. Get your service account credentials and enable APIs

To ensure maximum flexibility and portability, you must authenticate and authorize GCP resources using service account credentials. Using service accounts allows you to restrict the privileges to the minimum necessary to perform the job.

Note: Because service accounts are portable, you don’t need to run Chef inside GCP. Our cookbooks run on any computer with internet access, including other cloud providers. You might, for example, execute deployments from within a CI/CD system pipeline such as Travis or Jenkins, or from your own development machine.

Click here to learn more about service accounts, and how to create and enable them.

Also make sure to enable the the APIs for each of the GCP services you intend to use.

3a. Define your authentication mechanism

Once you have your service account, add the following resource block to your recipe to begin authenticating with it. The resource name, here 'mycred' is referenced in the objects in the credential parameter.


gauth_credential 'mycred' do
  action :serviceaccount
  path '/home/nelsonjr/my_account.json'
  scopes ['https://www.googleapis.com/auth/compute']
end


For further details on how to setup or customize authentication visit the Google Authentication cookbook documentation.

3b. Define your resources

You can manage any resource for which we provide a type. The example below creates an SQL instance and database in Cloud SQL. For the full list of resources that you can manage, please refer to the respective cookbook documentation link or to this aggregate summary view.


gsql_instance ‘my-app-sql-server’ do
  action :create
  project 'google.com:graphite-playground'
  credential 'mycred'
end

gsql_database 'webstore' do
  action :create
  charset 'utf8'
  instance ‘my-app-sql-server’
  project 'google.com:graphite-playground'
  credential 'mycred'
end


Note that the above code has to be described in a recipe within a cookbook. We recommend you have a “profile” wrapper cookbook that describes your infrastructure, and reference the Google cookbooks as a dependency.

4. Apply your recipe

Next, we direct Chef to enforce the recipe in the “profile” cookbook. For example:

$ chef-client -z --runlist ‘recipe[mycloud::myapp]’

In this example, mycloud is the “profile” cookbook, and myapp is the recipe that contains the GCP resource declarations.

Please note that you can apply the recipe from anywhere that Chef can execute recipes (client, server, automation), once or multiple times, or periodically in the background using an agent.
Next steps

Now you're ready to start managing GCP resources with Chef, and start reaping the benefits of cross-cloud configuration management. Our plan is to continue to improve the cookbooks and add support for more Google products. We're also preparing to release the technology used to create these cookbooks as open source. If you have questions about this effort please visit Chef on GCP discussions forum, or reach out to us on [email protected].

Announcing Stackdriver Debugger for Node.js


We’ve all been there. The code looked fine on your machine, but now you’re in production and it’s suddenly not working.

Tools like Stackdriver Error Reporting can make it easier to know when something goes wrong — but how do you diagnose the root cause of the issue? That’s where Stackdriver Debugger comes in.
Stackdriver Debugger lets you inspect the state of an application at any code location without using logging statements and without stopping or slowing down your applications. This means users are not impacted during debugging. Using the production debugger, you can capture the local variables and call stack and link it back to a specific line location in your source code. You can use this to analyze your applications’ production state and understand your code’s behavior in production.

What’s more, we’re excited to announce that Stackdriver Debugger for Node.js is now officially in beta. The agent is open source, and available on npm.


Setting up Stackdriver Debugger for Node.js


To get started, first install the @google-cloud/debug-agent npm module in your application:

$ npm install --save @google-cloud/debug-agent

Then, require debugger in the entry point of your application:

require('@google-cloud/debug-agent')
.start({ allowExpressions: true });

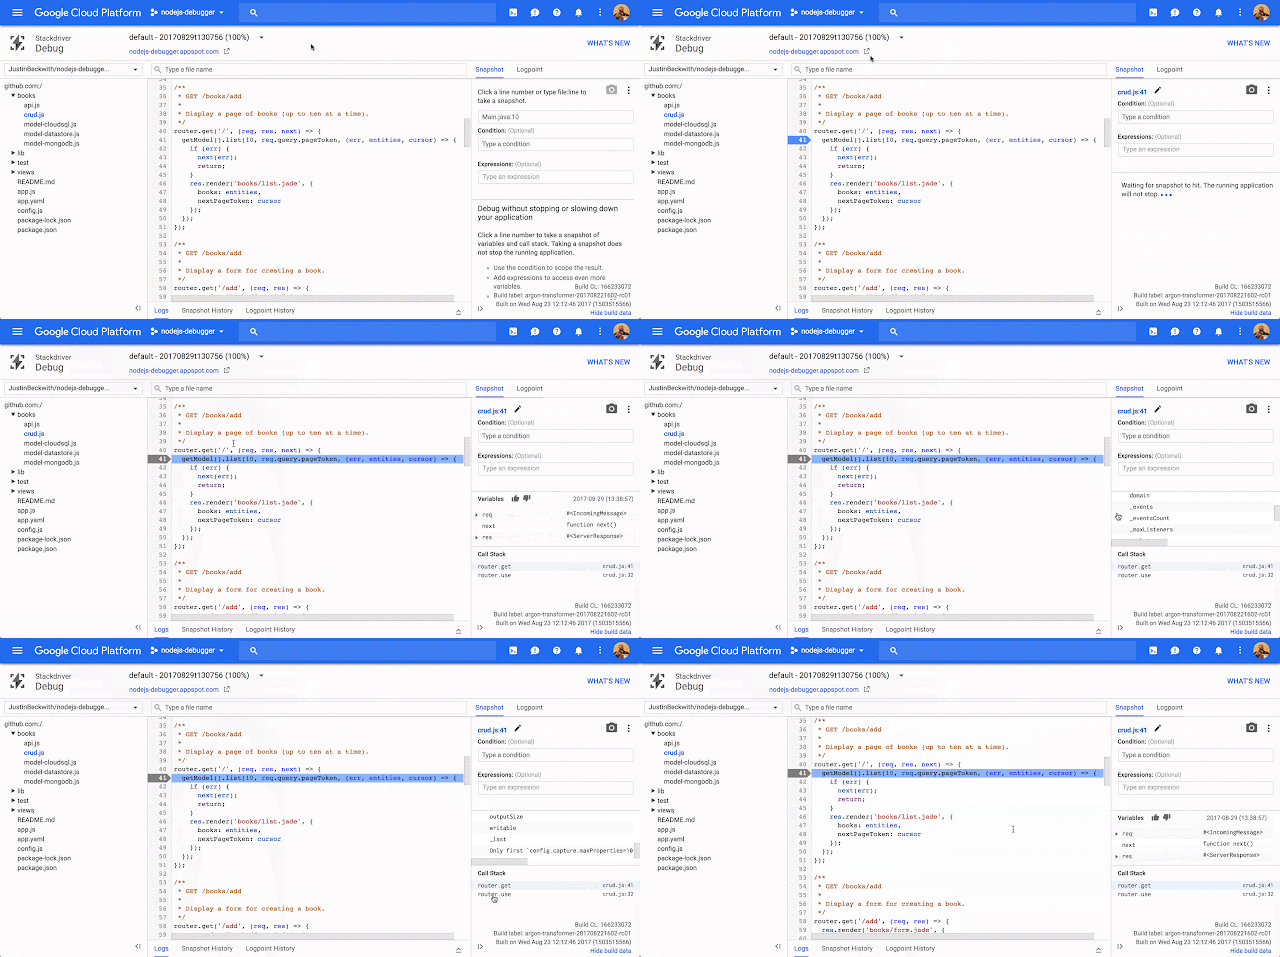
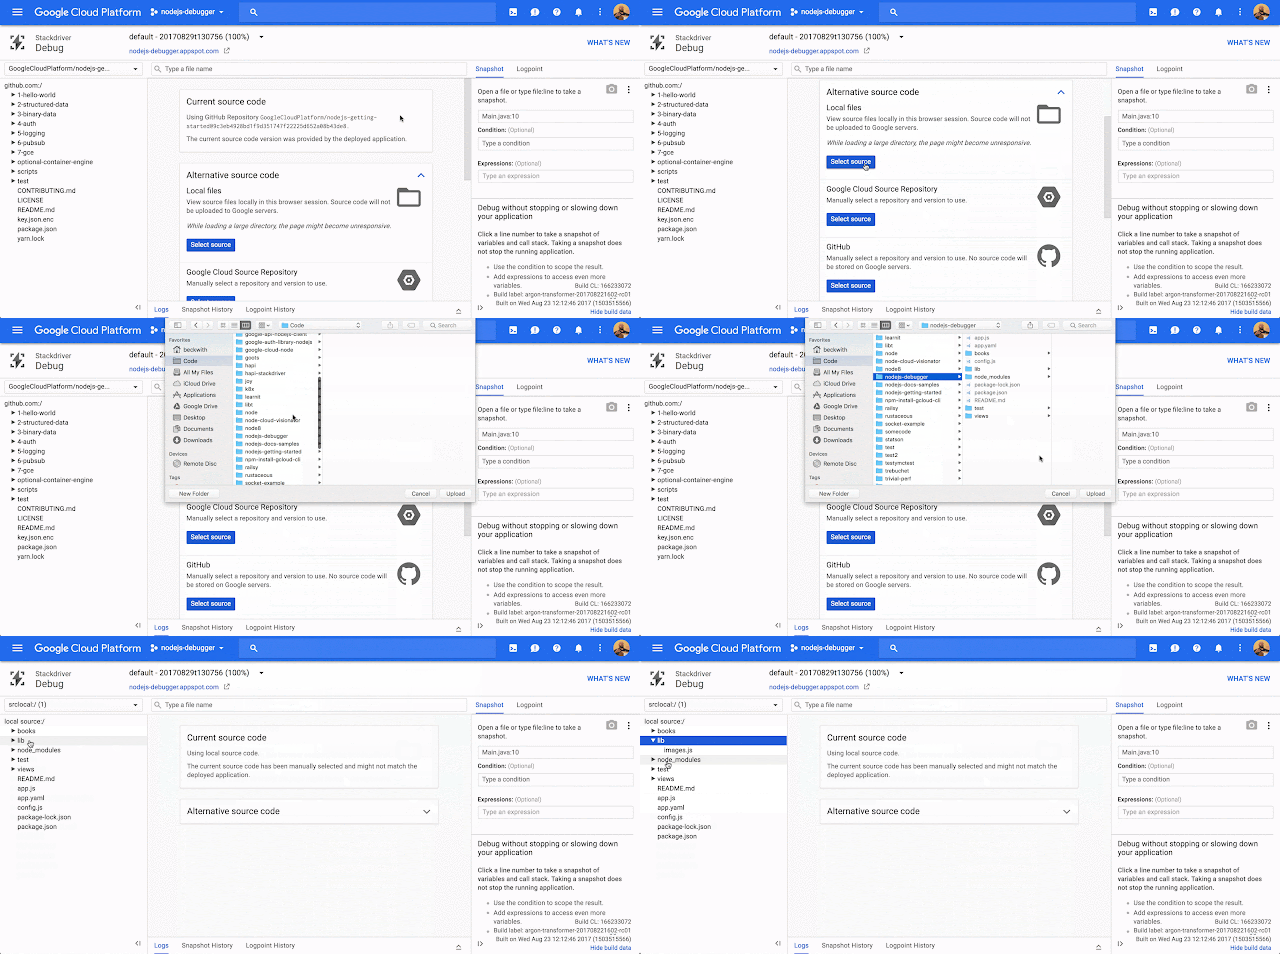
Now deploy your application! You’ll need to associate your sources with the application running in production, and you can do this via Cloud Source Repositories, GitHub or by copying sources directly from your desktop.


Using Logpoints 

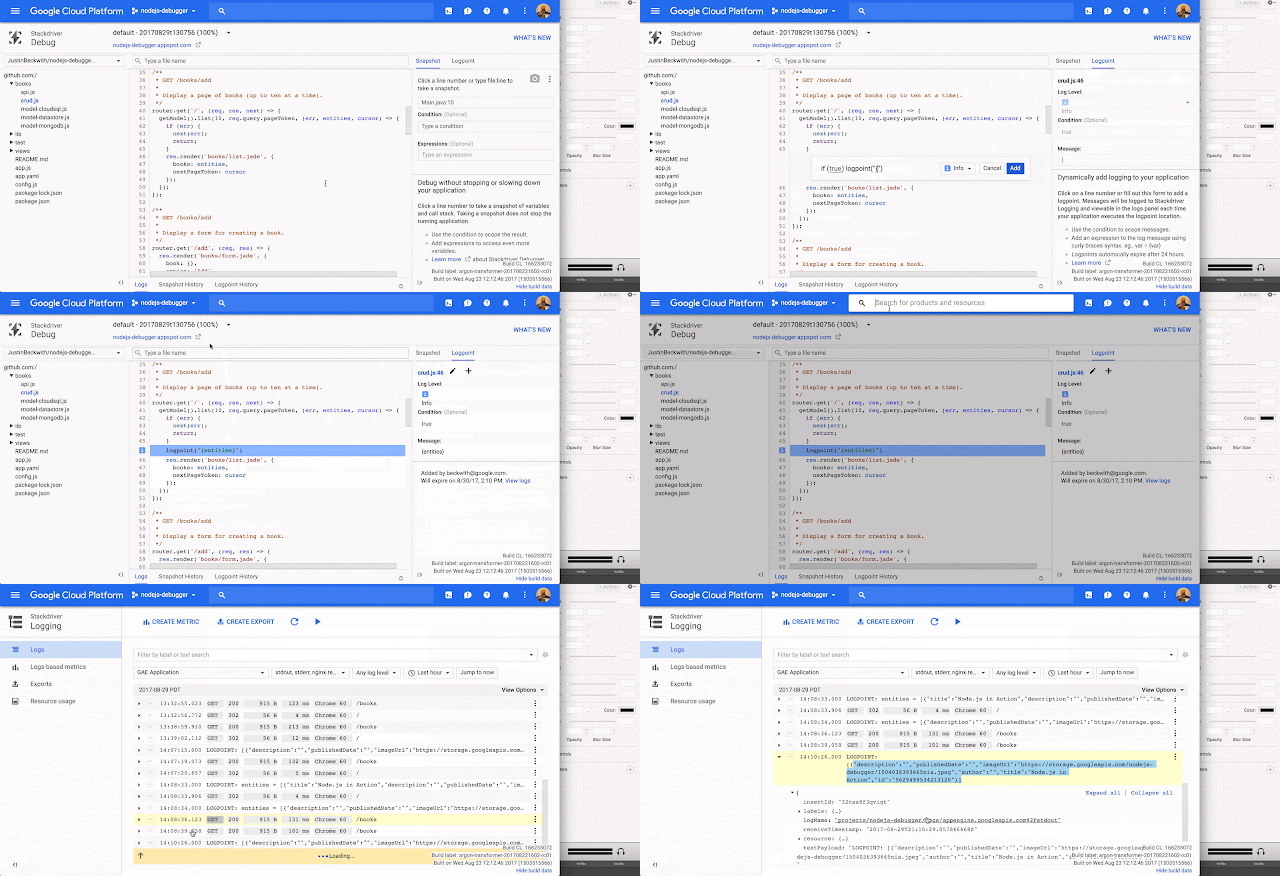
The passive debugger is just one of the ways you can diagnose issues with your app. You can also add log statements in real time — without needing to re-deploy your application. These are called Stackdriver Debugger Logpoints.

Logpoints let you inject log statements in real time, in your production application, without redeploying your application.
These are just a few of ways you can use Stackdriver Debugger for Node.js in your application. To get started, check out the full setup guide.

We can’t wait to hear what you think. Feel free to reach out to us on Twitter @googlecloud, or request an invite to the Google Cloud Slack community and join the #nodejs channel.

Announcing new Stackdriver Logging features and expanded free logs limits


When we announced the general availability of Google Stackdriver, our integrated monitoring, logging and diagnostics suite for applications running on cloud, we heard lots of enthusiasm from our user community as well as some insightful feedback:
  • Analysis - Logs based metrics are great, but you’d like to be able to extract labels and values from logs, too. 
  • Exports - Love being able to easily export logs, but it’s hard to manage them across dozens or hundreds of projects. 
  • Controls - Aggregating all logs in a single location and exporting them various places is fantastic, but you want control over which logs go into Stackdriver Logging. 
  • Pricing - You want room to grow with Stackdriver without worrying too much about the cost of logging all that data. 
We heard you, which is why today we’re announcing a variety of new updates to Stackdriver, as well as updated pricing to give you the flexibility to scale and grow.

Here’s a little more on what’s new.

Easier analysis with logs-based metrics 

Stackdriver was created with the belief that bringing together multiple signals from logs, metrics, traces and errors can provide greater insight than any single signal. Logs-based metrics are a great example. That’s why the new and improved logs-based metrics are:
  • Faster - We’ve decreased the time from when a log entry arrives until it’s reflected in a logs-based metric from five minutes to under a minute. 
  • Easier to manage - Now you can extract user-defined labels from text in the logs. Instead of creating a new logs based metric for each possible value, you can use a field in the log entry as a label. 
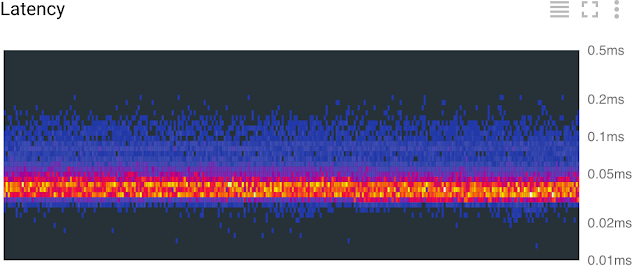
  • More powerful - Extract values from logs and turn them into distribution metrics. This allows you to efficiently represent many data points at each point in time. Stackdriver Monitoring can then visualize these metrics as a heat map or by percentile. 
The example above shows a heat map produced from a distribution metric extracted from a text field in log entries.

Tony Li, Site Reliability Engineer at the New York Times, explains how they use the new user defined labels applied to proxies help them improve reliability and performance from logs.
“With LBMs [Logs based metrics], we can monitor errors that occur across multiple proxies and visualize the frequency based on when they occur to determine regressions or misconfigurations."
The faster pipeline applies to all logs-based metrics, including the already generally available count-based metrics. Distribution metrics and user labels are now available in beta.


Manage logs across your organization with aggregated exports 


Stackdriver Logging gives you the ability to export logs to GCS, PubSub or BigQuery using log sinks. We heard your feedback that managing exports across hundreds or thousands of projects in an organization can sometimes be tedious and error prone. For example, if a security administrator in an organization wanted to export all audit logs to a central project in BigQuery, she would have to set up a log sink at every project and validate that the sink was in place for each new project.

With aggregated exports, administrators of an organization or folder can set up sinks once to be inherited by all the child projects and subfolders. This makes it possible for the security administrator to export all audit logs in her organization to BigQuery with a single command:

gcloud beta logging sinks create my-bq-sink 
bigquery.googleapis.com/projects/my-project/datasets/my_dataset 
--log-filter='logName= "logs/cloudaudit.googleapis.com%2Factivity"' 
--organization=1234 --include-children

Aggregated exports help ensure that logs in future projects will be exported correctly. Since the sink is set at the organization or folder level, it also prevents an individual project owner from turning off a sink.

Control your Stackdriver Logging pipeline with exclusion filters 

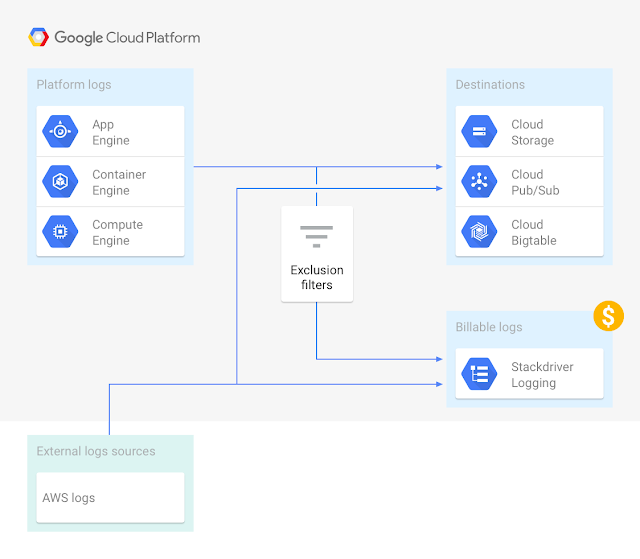
All logs sent to the Logging API, whether sent by you or by Google Cloud services, have always gone into Stackdriver Logging where they're searchable in the Logs Viewer. But we heard feedback that users wanted more control over which logs get ingested into Stackdriver Logging, and we listened. To address this, exclusion filters are now in beta. Exclusion filters allow you to reduce costs, improve the signal to noise ratio by reducing chatty logs and manage compliance by blocking logs from a source or matching a pattern from being available in Stackdriver Logging. The new Resource Usage page provides visibility into which resources are sending logs and which are excluded from Stackdriver Logging.


This makes it easy to exclude some or all future logs from a specific resource. In the example above, we’re excluding 99% of successful load balancer logs. We know the choice and freedom to choose any solution is important, which is why all GCP logs are available to you irrespective of the logging exclusion filters, to export to BigQuery, Google Cloud Storage or any third party tool via PubSub. Furthermore, Stackdriver will not charge for this export, although BigQuery, GCS and PubSub charges will apply.

Starting Dec 1, Stackdriver Logging offers 50GB of logs per project per month for free 


You told us you wanted room to grow with Stackdriver without worrying about the cost of logging all that data, which is why on December 1 we’re increasing the free logs allocation to an industry-leading 50GB per project per month. This increase aims to bring the power of Stackdriver Logging search, storage, analysis and alerting capabilities to all our customers.

Want to keep logs beyond the free 50GB/month allocation? You can sign up for the Stackdriver Premium Tier or the logs overage in the Basic Tier. After Dec 1, any additional logs will be charged at a flat rate of $0.50/GB.


Audit logs, still free and now available for 13 months 

We’re also exempting admin activity audit logs from the limits and overage. They’ll be available in Stackdriver in full without any charges. You’ll now be able to keep them for 13 months instead of 30 days.

Continuing the conversation 


We hope this brings the power of Stackdriver Logging search, storage, analysis and alerting capabilities to all our customers. We have many more exciting new features planned, including a time range selector coming in September to make it easier to get visibility into the timespan of search results. We’re always looking for more feedback and suggestions on how to improve Stackdriver Logging. Please keep sending us your requests and feedback.

Interested in more information on these new features?

Preventing log waste with Stackdriver Logging


If you work with web applications, you probably know they can generate a lot of log messages. There are often multiple log messages for each request, log messages for database queries, and log messages from a monitoring system. Analyzing and understanding all that data can take up precious time and energy, especially if your logs are full of "normal" noise that's not relevant to the the issue you're currently facing.

A few years ago, I gave a talk about how we, as a community, need to do a better job managing our data collection and retention. Even with sophisticated tools, searching several terabytes of data takes longer than searching a few gigabytes. Luckily, the solution is simple: stop logging everything. Instead, selectively log what is likely to be important and don't log the noise.

Stackdriver Logging has recently released a new feature, Log Exclusion Filtering, that helps you be more selective about what is included in your log aggregation. Exclusion filters let you completely exclude log messages from a specific product or messages that match a certain query. You can also choose to sample certain messages so that only a percentage of the messages appear in Stackdriver Logs Viewer. You can learn more about getting started with Log Exclusions here.

Deciding what should always be logged and what you can safely sample or exclude depends on the details of your application. However, we thought we’d share some types of messages you can consider filtering out.


Logs from monitoring systems 

Most web applications have some kind of uptime monitoring in place, and I use Stackdriver Monitoring to monitor mine. It verifies that my application is up every minute from more than five locations. My application logs every request, and so my logs grow by five messages a minute. These messages do not have much value for me; if the uptime check fails, I can already see that in Stackdriver Monitoring. So I created a filter to exclude all messages from Stackdriver Uptime checks.
If your application is running on App Engine, or you’re using host health checking with Container Engine or Compute Engine, you might consider excluding those messages as well. If you run into an issue with your health check, you can choose to re-enable those log messages while you debug the issue.


Logs that indicate success

Logs that indicate everything is fine are another category of messages that are often safe to exclude. HTTP requests with status codes in the 200 range are one example. Log messages for redirects can also be safely excluded in most situations. You may also be able to exclude, or at least only sample, log messages from successful database queries.

These are just a few examples. Looking over your application logs will likely reveal several other messages that are basically "success spam." Since success messages are some of the most common messages in our logs, reducing them can result in significantly fewer logs overall. This can reduce both actual and cognitive costs associated with log waste.


Logs from non-production systems 


Most folks know that staging and production logs should be clearly separated. But sometimes you’re only occasionally using a tool in production, or perhaps trying out a new product and the logs aren't yet critical. In cases like these, you can turn off logs for an entire resource type. For example, if you only use BigQuery for ad-hoc analysis, turning off Stackdriver ingestion of BigQuery logs can help reduce the amount of logs that you need to sort through.


Logs from high throughput endpoints 


Logs from high throughput endpoints is another category to consider reducing. One of the applications I worked on early in my career drove 80% of the traffic through a single endpoint. We were generating several gigabytes of data a day for just that URL. Because there was so much data, we could have safely reduced our logging of that traffic from 100% to 50%, or possibly lower. There were enough requests that we would likely get an example of any errors even if we only logged one out of every two messages. Static traffic is often high throughput, too. If your application is logging, each time someone downloads a stylesheet or favicon you may be able to reduce waste by only logging these messages occasionally.


The what ifs 

These are just a few examples of what can be reduced to help get your logging under control. Looking at your application logs and thinking about the types of errors you often see can yield even more ideas for reducing log volume.

So why don’t more of us reduce our logging? The most common reason I hear is: "What if we need it?" With Stackdriver Log Exclusions, you can always turn off an exclusion and see all the future traffic in the Logs Viewer. Once you’re aware of an issue, you can adjust your logging to help debug it. Additionally, you can export all the logs, even the excluded ones, to BigQuery or Google Cloud Storage if you need the full historical logs for debugging or other purposes.

Stackdriver Logging and Stackdriver Log Exclusions are powerful, and I encourage you to try them out to see if it can help you reduce costs and use resources more efficiently. To learn more, visit Cloud.google.com/logging/.

Using Stackdriver Logging for visual effects and animation pipelines: new tutorial


Capturing logs in a visual effects (VFX), animation or games pipeline is useful for troubleshooting automated tools, keeping track of process runtimes and machine load and capturing historical data that occurs during the life of a production.

But collecting and making sense of these logs can be tricky, especially if you're working on the same project from multiple locations, or have limited resources on which to collect the logs themselves. 

Collecting logs in the cloud enables you to understand this data by mining it with tools that deliver speed and power not possible from an on-premise logging server. Storage and data management is simple in the cloud and not bound by physical hardware. Additionally, you can access cloud logging resources globally; visual effects or animation facilities can access the same logging database regardless of physical location, making international productions far simpler to manage and understand.

We recently put together a tutorial that shows you how to integrate Stackdriver Logging, our hosted log management and analysis service for data running on Google Cloud Platform (GCP) and AWS, into your own visual effects or animation pipeline. It also shows some key storage strategies and how to migrate this data to BigQuery and other Google Cloud tools. Check it out, and let us know what other Google Cloud tools you’d like to learn how to use in your visual effects or animation pipeline. You can reach us on Twitter at @gcpjoe or @agrahamvfx.

ASP.NET Core developers, meet Stackdriver diagnostics


Being able to diagnose application logs, errors and latency is key to understanding failures, but it can be tricky and time-consuming to implement correctly. That’s why we're happy to announce general availability of Stackdriver Diagnostics integration for ASP.NET Core applications, providing libraries to easily integrate Stackdriver Logging, Error Reporting and Trace into your ASP.NET Core applications, with a minimum of effort and code. While on the road to GA, we’ve fixed bugs, listened to and applied customer feedback, and have done extensive testing to make sure it's ready for your production workloads.

The Google.Cloud.Diagnostics.AspNetCore package is available on NuGet. ASP.NET Classic is also supported with the Google.Cloud.Diagnostics.AspNet package.

Now, let’s look at the various Google Cloud Platform (GCP) components that we integrated into this release, and how to begin using them to troubleshoot your ASP.NET Core application.

Stackdriver Logging 

Stackdriver Logging allows you to store, search, analyze, monitor and alert on log data and events from GCP and AWS. Logging to Stackdriver is simple with Google.Cloud.Diagnostics.AspNetCore. The package uses ASP.NET Core’s built in logging API; simply add the Stackdriver provider and then create and use a logger as you normally would. Your logs will then show up in the Stackdriver Logging section of the Google Cloud Console. Initializing and sending logs to Stackdriver Logging only requires a few lines of code:

public void Configure(IApplicationBuilder app, ILoggerFactory loggerFactory)
{
    // Initialize Stackdriver Logging
    loggerFactory.AddGoogle("YOUR-GOOGLE-PROJECT-ID");
    ...
}

public void LogMessage(ILoggerFactory loggerFactory)
{
    // Send a log to Stackdriver Logging
    var logger = loggerFactory.CreateLogger("NetworkLog");
    logger.LogInformation("This is a log message.");
}
Here’s view of Stackdriver logs shown in Cloud Console:

This shows two different logs that were reported to Stackdriver. An expanded log shows its severity, timestamp, payload and many other useful pieces of information.

Stackdriver Error Reporting 

Adding the Stackdriver Error Reporting middleware to the beginning of your middleware flow reports all uncaught exceptions to Stackdriver Error Reporting. Exceptions are grouped and shown in the Stackdriver Error Reporting section of Cloud Console. Here’s how to initialize Stackdriver Error Reporting in your ASP.NET Core application:

public void ConfigureServices(IServiceCollection services)
{
    services.AddGoogleExceptionLogging(options =>
    {
        options.ProjectId = "YOUR-GOOGLE-PROJECT-ID";
        options.ServiceName = "ImageGenerator";
        options.Version = "1.0.2";
    });
    ...
}

public void Configure(IApplicationBuilder app)
{
    // Use before handling any requests to ensure all unhandled exceptions are reported.
    app.UseGoogleExceptionLogging();
    ...
}

You can also report caught and handled exceptions with the IExceptionLogger interface:
public void ReadFile(IExceptionLogger exceptionLogger)
{
    try
    {
        string scores = File.ReadAllText(@"C:\Scores.txt");
        Console.WriteLine(scores);
    }
    catch (IOException e)
    {
        exceptionLogger.Log(e);
    }
}
Here’s a view of Stackdriver Error Reports in Cloud Console:

This shows the occurrence of an error over time for a specific application and version. The exact error is shown on the bottom.

Stackdriver Trace 

Stackdriver Trace captures latency information on all of your applications. For example, you can diagnose if HTTP requests are taking too long by using a Stackdriver Trace integration point. Similar to Error Reporting, Trace hooks into your middleware flow and should be added at the beginning of your middleware flow. Initializing Stackdriver Trace is similar to setting up Stackdriver Error Reporting:

public void ConfigureServices(IServiceCollection services)
{
    string projectId = "YOUR-GOOGLE-PROJECT-ID";
    services.AddGoogleTrace(options =>
    {
        options.ProjectId = projectId;
    });
    ...
}

public void Configure(IApplicationBuilder app)
{
    // Use at the start of the request pipeline to ensure the entire request is traced.
    app.UseGoogleTrace();
    ...
}
You can also manually trace a section of code that will be associated with the current request:
public void TraceHelloWorld(IManagedTracer tracer)
{
    using (tracer.StartSpan(nameof(TraceHelloWorld)))
    {
        Console.Out.WriteLine("Hello, World!");
    }
}
Here’s a view of a trace across multiple servers in Cloud Console:
This shows the time spent for portions of an HTTP request. The timeline shows both time spent on the front-end and on the back-end.

Not using ASP.NET Core? 


If you are haven’t made the switch to ASP.NET Core but still want to use Stackdriver diagnostics tools, we also provide a package for ASP.NET accordingly named Google.Cloud.Diagnostics.AspNet. It provides simple Stackdriver diagnostics integration into ASP.NET applications. You can add Error Reporting and Tracing for MVC and Web API with a line of code to your ASP.NET application. And while ASP.NET does not have a logging API, we have also integrated Stackdriver Logging with log4net in our Google.Cloud.Logging.Log4Net package. 

Our goal is to make GCP a great place to build and run ASP.NET and ASP.NET Core applications, and troubleshooting performance and errors is a big part of that. Let us know what you think of this new functionality, and leave us your feedback on GitHub.

Add log statements to your application on the fly with Stackdriver Debugger Logpoints


In 2014 we launched Snapshots for Stackdriver Debugger, which gave developers the ability to examine their application’s call stack and variables in production with no impact to users. In the past year, developers have taken over three hundred thousand production snapshots across their services running on Google App Engine and on VMs and containers hosted anywhere.

Today we’re showing off Stackdriver Debugger Logpoints. With Logpoints, you can instantly add log statements to your production application without rebuilding or redeploying it. Like Snapshots, this is immensely useful when diagnosing tricky production issues that lack an obvious root cause. Even better, Logpoints fits into existing logs-based workflows.
(click to enlarge)
Adding a logpoint is as simple as clicking a line in the Debugger source viewer and typing in your new log message (just make sure that you open the Logpoints tab in the right hand pane first). If you haven’t synced your source code, you can add Logpoints by specifying the target file and line number in the right-hand pane or via the gcloud command line tools. Variables can be referenced by {variableName}. You can review the full documentation here.

Because Logpoints writes its output through your app’s existing logging mechanism, it's compatible with any logging aggregation and analysis system, including Splunk or Kibana, or you can read its output from locally stored logs. However, Stackdriver Logging customers benefit from being able to read their log output from within the Stackdriver Debugger UI.


Logpoints is already available for applications written in Java, Go, Node.js, Python and Ruby via the Stackdriver Debugger agents. As with Snapshots, this same set of languages is supported across VMs (including Google Compute Engine), containers (including Google Container Engine), and Google App Engine. Logpoints has been accessible through the gcloud command line interface for some time, and the process for using Logpoints in the CLI hasn’t changed.

Each logpoint lasts up to twenty-four hours or until it's deleted or when the application is redeployed. Adding a logpoint incurs a performance cost on par with adding an additional log statement to your code directly. However, the Stackdriver Debugger agents automatically throttle any logpoints that negatively impact your application’s performance and any logpoints or snapshots with conditions that take too long to evaluate.

At Google, we use technology like Snapshots and Logpoints to solve production problems every day to make our services more performant and reliable. We’ve heard from our customers how snapshots are the bread and butter of their problem-solving processes, and we’re excited to see how you use Logpoints to make your cloud applications better.

How to do serverless pixel tracking with GCP


Whether they’re opening a newsletter or visiting a shopping cart page, how users interact with web content is very interesting to publishers. One way to understand user behavior is by using pixels, small 1x1 transparent images embedded into the web property. When loaded, the pixel calls a web server that records the request parameters passed in the URL that can be processed later.

Adding a pixel is easy, but hosting it and processing the request can be challenging for various reasons:
  • You need to set up, manage and monitor your ad servers
  • Users are usually global, which means that you need ad servers around the world
  • User visits are spiky, so pixel servers must scale up to sustain the load and scale down to limit the spend.
Google Cloud Platform (GCP) services such as Container Engine and managed autoscaled instance groups can help with those challenges. But at Google Cloud, we think companies should avoid managing infrastructure whenever possible.

For example, we recently worked with GCP partner and professional services firm DoiT International to build a pixel tracking platform that relieves the administrator from setting up or managing any servers. Instead, this serverless pixel tracking solution leverages managed GCP services, including:
  • Google Cloud Storage: A global or regional object store that offers different options such as Standard, Nearline, Cold with various prices and SLAs depending on your needs. In our case, we used Standard, which offers low millisecond latency
  • Google HTTP(s) Load Balancer: A global anycast IP load balancer service that can scale to millions of QPS with integrated logging. It also can be leveraged by Cloud CDN to prevent useless access to Google Cloud Storage by caching pixels closer to the user in Google edges
  • BigQuery: Google's fully managed, petabyte-scale, low-cost enterprise data warehouse for analytics
  • Stackdriver Logging: A logging system that allows you to store, search, analyze, monitor and alert on log data and events from GCP and Amazon Web Services (AWS). It supports Google load balancers and can export data to Cloud Storage, BigQuery or Pub/Sub
Tracking pixels with these services works as follows:
  1. A client calls a pixel URL that's served directly by Cloud Storage.
  2. A Google Cloud Load Balancer in front of Cloud Storage records the request to Stackdriver Logging, whether there was a cache hit or not.
  3. Stackdriver Logging exports every request to BigQuery as they come in, which acts as a storage and querying engine for ad-hoc analytics that can help business analysts better understand their users.


All those services are fully managed and do not require you to set up any instances or VMs. You can learn more about this solution by:
Going forward, we look forward to building more serverless solutions on top of GCP managed offerings. Let us know in the comments if there’s a solution that you’d like us to build!

Distributed tracing for Go


The Go programming language has emerged as a popular choice for building distributed systems and microservices. But troubleshooting Go-based microservices can be tough if you don’t have the right tooling. Here at Google Cloud, we’re big fans of Go, and we recently added a native Go client library to Stackdriver Trace, our distributed tracing backend to help you unearth (and resolve) difficult performance problems for any Go application, whether it runs on Google Cloud Platform (GCP) or some other cloud.

The case for distributed tracing

Suppose you're trying to troubleshoot a latency problem for a specific page. Suppose your system is made of many independent services and the data on the page is generated through many downstream services. You have no idea which of those services are causing the slowdown. You have no clear understanding of whether it’s a bug, an integration issue, a bottleneck due to poor choice of architecture or poor networking performance.

Solving this problem becomes even more difficult if your services are running as separate processes in a distributed system. We cannot depend on the traditional approaches that help us diagnose monolithic systems. We need to have finer-grained visibility into what’s going on inside each service and how they interact with one another over the lifetime of a user request.

In monolithic systems, it's relatively easy to collect diagnostic data from the building blocks of a program. All modules live within one process and share common resources to report logs, errors and other diagnostics information. Once your system grows beyond a single process and starts to become distributed, it becomes harder to follow a call starting from the front-end web server to all of its back-ends until a response is returned back to the user.
To address this problem, Google developed the distributed tracing system Dapper to instrument and analyze its production services. The Dapper paper has inspired many open source projects, such as Zipkin, and Dapper-style tracing has emerged as an industry-wide standard.

Distributed tracing enabled us to:
  • Instrument and profile application latency in a large system.
  • Track all RPCs within the lifecycle of a user request and see integration issues that are only visible in production.
  • Figure out performance improvements that can be applied to our systems. Many bottlenecks are not obvious before the collection of tracing data.

Tracing concepts

Tracing works on the basic principle of propagating tracing data between services. Each service annotates the trace with additional data and passes the tracing header to other services until the user request is served. Services are responsible for uploading their traces to a tracing backend. Then, the tracing backend puts related latency data together like the pieces of a puzzle. Tracing backends also provide UIs to analyze and visualize traces.

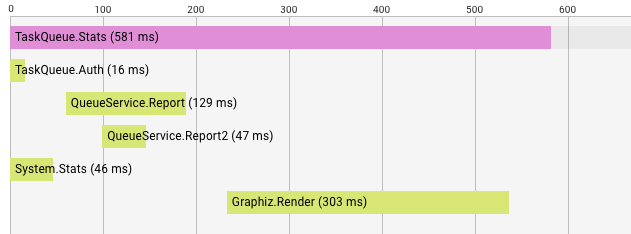
In Dapper-style tracing, each trace is a call tree, beginning with the entry point of a user request and ending with the server’s response, including all RPCs along the way. Each trace consists of small units called spans.
Above, you see a trace tree for a TaskQueue.Stats request. Each row is labelled with the span name. Before the system can serve TaskQueue.Stats, five other RPCs have been made to other services. First, TaskQueue.Auth checks if we're authorized for the request. Then, QueueService is queried for two reports. In the meantime, System.Stats is retrieved from another service. Once reports and system stats are retrieved, the Graphiz service renders a graph. In total, TaskQueue.Stats returns in 581 ms, and we have a good picture of what has happened internally to serve this call. By looking at this trace, maybe we'll learn that rendering is taking more time than we expect.

Each span name should be carefully chosen to represent the work it does. For example, TaskQueue.Stats is easily identified within the system and, as its name implies, reads stats from the TaskQueue service.

Spans can start new spans where a span depends on other spans to be completed. These spans are visualized as children spans of their starter span in a trace tree.

Spans can also be annotated with labels to convey more fine-grained information about a specific request. Request ID, user IDs and RPC parameters are good examples of labels commonly attached to traces. Choose labels by determining what else you want to see in a particular trace tree and what you would like to query from the collected data.

Working with Stackdriver Trace

One of the exciting things about GCP is that customers can use the same services and tools we use daily at Google-scale. We launched Stackdriver Trace to provide a distributing tracing backend for our customers. Stackdriver Trace collects latency data from your applications, lists and visualizes it on Cloud Console, and allows you to analyze your application’s latency profile. Your code doesn’t have to run on GCP to use Stackdriver Trace  we can upload your trace data to our backends even if your production environment doesn’t run on our cloud.

To collect latency data, we recently released the cloud.google.com/go/trace package for Go programmers to instrument their code with marking spans and annotations. Please note that the trace package is still in alpha and we're looking forward to improving it over time. At this stage, please feel free to file bugs and feature requests.

To run this sample, you’ll need Google Application Default Credentials. First, use the gcloud command line tool to get application default credentials if you haven’t already.

Then, import the trace package:
import "cloud.google.com/go/trace"

Create a new trace client with your project ID:
traceClient, err = trace.NewClient(ctx, "project-id")
if err != nil {
 log.Fatal(err)
}

We recommend you have a long-living trace.Client instance. You can create a client once and keep using it until your program terminates.

The sample program makes an outgoing HTTP request. In this example, we attach tracing information to the outgoing HTTP request so that the trace can be propagated to the destination server:
func fetchUsers() ([]*User, error) {
 span := traceClient.NewSpan("/users")
 defer span.Finish()

 // Create the outgoing request, a GET to the users endpoint.
 req, _ := http.NewRequest("GET", "https://userservice.corp/users", nil)

 // Create a new child span to identify the outgoing request,
 // and attach tracing information to the request.
 rspan := span.NewRemoteChild(req)
 defer rspan.Finish()

 res, err := http.DefaultClient.Do(req)
 if err != nil {
  return nil, err
 }

 // Read the body, unmarshal, and return a slice of users.
 // ...
}

The User service extracts the tracing information from the incoming request, and creates and annotates any additional child spans. In this way, the trace of a single request can be propagated between many different systems:

func usersHandler(w http.ResponseWriter, r *http.Request) {
 span := traceClient.SpanFromRequest(r)
 defer span.Finish()

 req, _ := http.NewRequest("GET", "https://meta.service/info", nil)
 child := span.NewRemoteChild(req)
 defer child.Finish()

 // Make the request…
}

Alternatively, you can also use the HTTP utilities to easily add tracing context to outgoing requests via HTTPClient, and extract the spans from incoming requests with HTTPHandler.

var tc *trace.Client // initiate the client
req, _ := http.NewRequest("GET", "https://userservice.corp/users", nil)

res, err := tc.NewHTTPClient(nil).Do(req)
if err != nil {
 // TODO: Handle error.
}

And on the receiving side, you can use our handler wrapper to access the span via the incoming request’s context:

handler := http.HandlerFunc(func(w http.ResponseWriter, r *http.Request) {
    span := trace.FromContext(r.Context())
    // TODO: Use the span.
})
http.Handle("/foo", tc.HTTPHandler(handler))

A similar utility to enable auto-tracing is also available for gRPC Go clients and servers.

Please note that not all services need to be written in Go  propagation works across all services written in other languages as long as they rely on the Stackdriver header format to propagate the tracing context. See the Stackdriver Trace docs to learn about the header format.


Future work

Even though we currently provide a solution for GCP, our goal is to contribute to the Go ecosystem beyond GCP. There are many groups working on tracing for Go, and there's a lot of work to do to ensure it's aligned. We look forward to working with these groups to make tracing accessible and easy for Go programmers.

One particular problem we want to solve is enabling third-party library authors to provide out-of-the-box tracing without depending on a particular tracing backend. Then, open-source library developers can instrument their code by marking spans and annotating them to be traced by the user's choice of tracing backend. We also want to work on reusable utilities to automatically enable tracing anywhere without requiring Go programmers to significantly modify their code.

We're currently working with a large group of industry experts and examining already-established solutions to understand their requirements and provide a solution that will foster our integrations with tracing backends. With these first-class building blocks and utilities, we believe distributed tracing can be a core and accessible tool to diagnose Go production systems.

Google Cloud Audit Logging now available across the GCP stack


Google Cloud Audit Logging helps you to determine who did what, where and when on Google Cloud Platform (GCP). This fall, Cloud Audit Logging became generally available for a number of products. Today, we’re significantly expanding the set of products integrated with Cloud Audit Logging:
The above integrations are all currently in beta.

We’re also pleased to announce that audit logging for Google Cloud Dataflow, Stackdriver Debugger and Stackdriver Logging is now generally available.

Cloud Audit Logging provides log streams for each integrated product. The primary log stream is the admin activity log that contains entries for actions that modify the service, individual resources or associated metadata. Some services also generate a data access log that contains entries for actions that read metadata as well as API calls that access or modify user-provided data managed by the service. Right now only Google BigQuery generates a data access log, but that will change soon.

Interacting with audit logs in Cloud Console

You can see a high-level overview of all your audit logs on the Cloud Console Activity page. Click on any entry to display a detailed view of that event, as shown below.

By default, data access logs are not displayed in this feed. To enable them from the Filter configuration panel, select the “Data Access” field under Categories. (Please note, you also need to have the Private Logs Viewer IAM permission in order to see data access logs). You can also filter the results displayed in the feed by user, resource type and date/time.

Interacting with audit logs in Stackdriver

You can also interact with the audit logs just like any other log in the Stackdriver Logs Viewer. With Logs Viewer, you can filter or perform free text search on the logs, as well as select logs by resource type and log name (“activity” for the admin activity logs and “data_access” for the data access logs).

Here are some log entries in their JSON format, with a few important fields highlighted.
In addition to viewing your logs, you can also export them to Cloud Storage for long-term archival, to BigQuery for analysis, and/or Google Cloud Pub/Sub for integration with other tools. Check out this tutorial on how to export your BigQuery audit logs back into BigQuery to analyze your BigQuery spending over a specified period of time.
"Google Cloud Audit Logs couldn't be simpler to use; exported to BigQuery it provides us with a powerful way to monitor all our applications from one place.Darren Cibis, Shine Solutions

Partner integrations

We understand that there are many tools for log analysis out there. For that reason, we’ve partnered with companies like Splunk, Netskope, and Tenable Network Security. If you don’t see your preferred provider on our partners page, let us know and we can try to make it happen.

Alerting using Stackdriver logs-based metrics

Stackdriver Logging provides the ability to create logs-based metrics that can be monitored and used to trigger Stackdriver alerting policies. Here’s an example of how to set up your metrics and policies to generate an alert every time an IAM policy is changed.

The first step is to go to the Logs Viewer and create a filter that describes the logs for which you want to be alerted. Be sure that the scope of the filter is set correctly to search the logs corresponding to the resource in which you are interested. In this case, let’s generate an alert whenever a call to SetIamPolicy is made.

Once you're satisfied that the filter captures the correct events, create a logs-based metric by clicking on the "Create Metric" option at the top of the screen.

Now, choose a name and description for the metric and click "Create Metric." You should then receive a confirmation that the metric was saved.
Next, select “Logs-based Metrics” from the side panel. You should see your new metric listed there under “User Defined Metrics.” Click on the dots to the right of your metric and choose "Create alert from metric."

Now, create a condition to trigger an alert if any log entries match the previously specified filter. To do that, set the threshold to "above 0" in order to catch this occurrence. Logs-based metrics count the number of entries seen per minute. With that in mind, set the duration to one minute as the duration specifies how long this per-minute rate needs to be sustained in order to trigger an alert. For example, if the duration were set to five minutes, there would have to be at least one alert per minute for a five-minute period in order to trigger the alert.

Finally, choose “Save Condition” and specify the desired notification mechanisms (e.g., email, SMS, PagerDuty, etc.). You can test the alerting policy by giving yourself a new permission via the IAM console.

Responding to audit logs using Cloud Functions


Cloud Functions is a lightweight, event-based, asynchronous compute solution that allows you to execute small, single-purpose functions in response to events such as specific log entries. Cloud functions are written in JavaScript and execute in a standard Node.js environment. Cloud functions can be triggered by events from Cloud Storage or Cloud Pub/Sub. In this case, we'll trigger cloud functions when logs are exported to a Cloud Pub/Sub topic. Cloud Functions is currently in alpha, please sign up to request enablement for your project.

Let’s look at firewall rules as an example. Whenever a firewall rule is created, modified or deleted, a Compute Engine audit log entry is written. The firewall configuration information is captured in the request field of the audit log entry. The following function inspects the configuration of a new firewall rule and deletes it if that configuration is of concern (in this case, if it opens up any port besides port 22). This function could easily be extended to look at update operations as well.

Copyright 2017 Google Inc.

Licensed under the Apache License, Version 2.0 (the "License");
you may not use this file except in compliance with the License.
You may obtain a copy of the License at

http://www.apache.org/licenses/LICENSE-2.0

Unless required by applicable law or agreed to in writing, software
distributed under the License is distributed on an "AS IS" BASIS,
WITHOUT WARRANTIES OR CONDITIONS OF ANY KIND, either express or implied.
See the License for the specific language governing permissions and
limitations under the License.

'use strict';

exports.processFirewallAuditLogs = (event) => {
  const msg = JSON.parse(Buffer.from(event.data.data, 'base64').toString());
  const logEntry = msg.protoPayload;
  if (logEntry &&
      logEntry.request &&
      logEntry.methodName === 'v1.compute.firewalls.insert') {
    let cancelFirewall = false;
    const allowed = logEntry.request.alloweds;
    if (allowed) {
      for (let key in allowed) {
        const entry = allowed[key];
        for (let port in entry.ports) {
          if (parseInt(entry.ports[port], 10) !== 22) {
            cancelFirewall = true;
            break;
          }
        }
      }
    }
    if (cancelFirewall) {
      const resourceArray = logEntry.resourceName.split('/');
      const resourceName = resourceArray[resourceArray.length - 1];
      const compute = require('@google-cloud/compute')();
      return compute.firewall(resourceName).delete();
    }
  }
  return true;
};

As the function above uses the gcloud Node.js module, be sure to include that as a dependency in the package.json file that accompanies the index.js file specifying your source code:
{
  "name" : "audit-log-monitoring",
  "version" : "1.0.0",
  "description" : "monitor my audit logs",
  "main" : "index.js",
  "dependencies" : {
    "@google-cloud/compute" : "^0.4.1"
  }
}

In the image below, you can see what happened to a new firewall rule (“bad-idea-firewall”) that did not meet the acceptable criteria as determined by the cloud function. It's important to note, that this cloud function is not applied retroactively, so existing firewall rules that allow traffic on ports 80 and 443 are preserved.

This is just one example of many showing how you can leverage the power of Cloud Functions to respond to changes on GCP.


Conclusion


Cloud Audit Logging offers enterprises a simple way to track activity in applications built on top of GCP, and integrate logs with monitoring and logs analysis tools. To learn more and get trained on audit logging as well as the latest in GCP security, sign up for a Google Cloud Next ‘17 technical bootcamp in San Francisco this March.