By Mary Koes, JD Velasquez and Jay Judkowitz, Product Managers
Today we're introducing simplified pricing for Stackdriver Monitoring and Logging, and bringing advanced functionality that was limited to a premium pricing tier to all Stackdriver users.
Starting June 30, 2018, you get the advanced alerting and notification options you need to monitor your cloud applications, as well as the flexibility to create monitoring dashboards and alerting policies—without having to opt-in to premium pricing.
Stackdriver Monitoring
Stackdriver Monitoring provides visibility into the performance, uptime and overall health of cloud-powered applications. A hybrid service, Stackdriver Monitoring integrates with GCP, AWS and a variety of common application components.
Highlights of the new Stackdriver Monitoring pricing model include:
Flexible pay-as-you-go pricing model that optimizes your spend—pay only for the monitoring data you send, not by the number of resources you have in your projects.
Permanent free allocation replaces free trials — all GCP metrics and the first 150 MB of non-GCP metrics per month are available at no cost.
Automatic volume-based discounts — for non-GCP metrics including agent metrics, AWS metrics, logs based metrics, and custom metrics, this volume-based pricing of $.258 down to $.061 per MB ingested represents an up to 80% discount over previously announced prices.
Stackdriver Logging
The key to a well-managed application is to retain meaningful quantities of logging data. Stackdriver Logging allows you to store, search, analyze, monitor and alert on log data and events from GCP, AWS, or ingest custom log data from any source. Beginning today, we’re increasing the retention of logs from seven days to 30 days for all users regardless of tier. In addition, we’re delaying enforcement of log pricing until June 30 from our previously announced date of March 31.
Logs over the free allocation are billed based on volume ingested at $.50 per GB
Stackdriver Monitoring and Logging are priced independently
In order to help you control costs, we also provide exclusion filters that enable you to pay only for the logs you want to keep—or even to turn off log ingestion to Stackdriver completely while still allowing logs to be exported to GCS, PubSub or BigQuery.
Here at Google Cloud, we believe that monitoring, logging and performance management are the foundation of any well-managed application—in our cloud, on another cloud, or on-premises. We hope that this new pricing model will enable you to use the Stackdriver family of tools widely and freely. Thank you for your continued feedback—it helps us make our products better. To learn more about Stackdriver, check out our documentation or join in the conversation in our discussion group.
Even if you use managed instance groups in your Compute Engine environment, you know that scaling worker VM instances efficiently on a queue of jobs is not a trivial exercise. Sometimes the queue is empty and you want zero workers so that you’re not wasting money and resources. Other times the queue fills up quickly, is bursting at the seams, and you need all the workers you can get. Still other times, there’s a steady flow of work that you want to process at a consistent pace.
To help with these challenges, we're announcing per-group metrics scaling for managed instance groups, which lets you create a simple queue-based scaling system to address all of these scenarios. The feature relies on allowing managed instance groups to scale on previously unsupported Stackdriver monitoring metrics, such as the amount of work in a Pub/Sub queue.
This is a big improvement over the prior state of affairs. Before per-group metrics scaling, your best options were either to have a statically sized worker pool waiting around for work, or to write custom code to monitor the jobs in a queue, then manually scale worker pools up and down based on the current amount of work.
Using per-group metrics scaling
Let’s work through an example of how you can use per-group scaling in managed instance groups. Consider this simple setup. You receive data jobs that you want to process as they come in. Once started, a job can be processed in a couple of minutes, but the jobs arrive in unpredictable bursts. When a new data job appears, a Cloud Pub/Sub message is created and sent, and as these messages build up, the number of unprocessed messages in the Pub/Sub queue is exported as a Stackdriver monitoring metric. We’ll use this metric to drive the number of workers, which in turn pulls the Pub/Sub messages, processes the data and reduces the length of the Pub/Sub queue.
To do this, start by creating a managed instance group with autoscaling enabled. For this example, we assume that you’ve already configured the Pub/Sub queue and that you have an instance template with your worker image ready to go.
Set “Autoscale on” to “Stackdriver monitoring metric” and “Metric export scope” to “Single time series per group.” This is the setting that configures the managed instance group to scale on a metric that's independent of individual instances. Unlike typical autoscaling metrics such as average CPU utilization, the length of a queue is independent from the instances in the managed instance group.
Set the metric identifier to be the number of undelivered Pub/Sub messages, filtered by your specific subscription name. This allows the autoscaler to find the correct Pub/Sub queue to scale on.
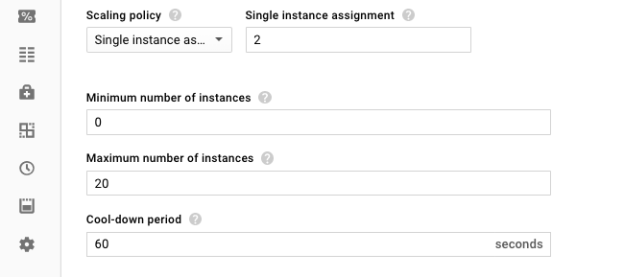
Now the managed instance group is connected to the correct metrics, and it’s time to set up how quickly the group scales up and down. Set the scaling policy to “Single instance assignment” of ‘2’ to indicate that for every two unprocessed messages in the queue, the managed instance group should have one worker instance. Finally, set the maximum and minimum size of the group. We want the group to scale to zero when there's no work, so set the minimum to "0" and the maximum to whatever makes sense for your workload. For this example, we’ll go with 20.
You can also configure per-group metric scaling programmatically. Here’s the same command written using the Google Cloud SDK CLI tool
That’s it! Now, when messages arrive in the Pub/Sub queue, the managed instance group scales up, and as messages get processed, scales back down. When all the messages have been processed and the queue is empty, the managed instance group shuts down all machines in the group so that you don’t pay for resources that you aren’t using.
The diagram below shows how the number of instances in the managed instance group changes over 10 time-steps in response to the length of the Pub/Sub queue.
As work starts accumulating in the queue, the managed instance group scales up at an average rate of one instance per two messages sitting in the queue. Once the amount of queued-up work starts to decrease at time-step 6, the managed instance group scales down to match. Finally, as the queue empties around time-step 9, the managed instance group scales down to zero in time-step 10. It will stay at size zero until more work shows up.
Queue unto others
It’s never been easier to set up automatic scaling for queued jobs using managed instance groups. With a single metric to measure the amount of work and a simple assignment of work per worker, you can set up a responsive scaling system in a couple of clicks.
Of course, this also works for queueing systems other than Pub/Sub queues. Anytime you can express the amount of work as a Stackdriver metric, and assign work per node, you can use per group metrics scaling for managed instance groups to optimize costs.
To get started, check out the documentation for more details.
By Rachna Vargiya, Product Manager, Google Cloud Platform Billing
As your organization uses more cloud resources, effective pricing and cost management are critical. We are delighted to announce the general availability of the Cloud Billing Catalog API, which helps you gain programmatic, real-time access to authoritative Google Cloud Platform (GCP) list pricing.
The Cloud Billing Catalog API joins the Google Cloud Billing API to help you manage your billing experience. The Cloud Billing API allows programmatic management of billing accounts, and allows you to get, list and manage permissions on billing accounts. The Cloud Billing Catalog API builds on that functionality with programmatic access to the rich information you see for GCP SKUs on our website.
Now, with the Cloud Billing Catalog API, you can predict bills, estimate costs and reconcile rates when you're using list GCP pricing. It provides you with a list of all GCP services. In addition, it contains a list of all SKUs within a service including:
A human-readable description of the SKU
List pricing for the SKU
Regions where the SKU is available for purchase
Categorization data about the SKU
You can use the Cloud Billing Catalog API with your existing cost management tools, as well as to reconcile list pricing rates when you export billing data to Google BigQuery.
Both the Cloud Billing and Cloud Billing Catalog APIs are available via REST and RPC. To find out more and get started, visits the Cloud Billing Catalog API documentation.
Hi there! I’m Merry, Santa’s CIE (Chief Information Elf), responsible for making sure computers help us deliver joy to the world each Christmas. My elf colleagues are really busy getting ready for the big day (or should I say night?), but this year, my team has things under control, thanks to our fully cloud-native architecture running on Google Cloud Platform (GCP)! What’s that? You didn’t know that the North Pole was running in the cloud? How else did you think that we could scale to meet the demands of bringing all those gifts to all those children around the world?
You see, North Pole Operations have evolved quite a lot since my parents were young elves. The world population increased from around 1.6 billion in the early 20th century to 7.5 billion today. The elf population couldn’t keep up with that growth and the increased production of all these new toys using our old methods, so we needed to improve efficiency.
Of course, our toy list has changed a lot too. It used to be relatively simple — rocking horses, stuffed animals, dolls and toy trucks, mostly. The most complicated things we made when I was a young elf were Teddy Ruxpins (remember those?). Now toy cars and even trading card games come with their own apps and use machine learning.
This is where I come in. We build lots of computer programs to help us. My team is responsible for running hundreds of microservices. I explain microservices to Santa as a computer program that performs a single service. We have a microservice for processing incoming letters from kids, another microservice for calculating kids’ niceness scores, even a microservice for tracking reindeer games rankings.
Here's an example of the Letter Processing Microservice, which takes handwritten letter in all languages (often including spelling and grammatical errors) and turns each one into text.
Each microservice runs on one or more computers (also called virtual machines or VMs). We tried to run it all from some computers we built here at the North Pole but we had trouble getting enough electricity for all these VMs (solar isn’t really an option here in December). So we decided to go with GCP. Santa had some reservations about “the Cloud” since he thought it meant our data would be damaged every time it rained (Santa really hates rain). But we managed to get him a tour of a data center (not even Santa can get in a Google data center without proper clearances), and he realized that cloud computing is really just a bunch of computers that Google manages for us.
Google lets us use projects, folders and orgs to group different VMs together. Multiple microservices can make up an application and everything together makes up our system. Our most important and most complicated application is our Christmas Planner application. Let’s talk about a few services in this application and how we make sure we have a successful Christmas Eve.
Our Christmas Planner application includes microservices for a variety of tasks: microservices generate lists of kids that are naughty or nice, as well as a final list of which child receives which gift based on preferences and inventory. Microservices plan the route, taking into consideration inclement weather and finally, generate a plan for how to pack the sleigh.
Small elves, big data
Our work starts months in advance, tracking naughty and nice kids by relying on parent reports, teacher reports, police reports and our mobile elves. Keeping track of almost 2 billion kids each year is no easy feat. Things really heat up around the beginning of December, when our army of Elves-on-the-Shelves are mobilized, reporting in nightly.
We send all this data to a system called BigQuery where we can easily analyze the billions of reports to determine who's naughty and who's nice in just seconds.
Deck the halls with SLO dashboards
Our most important service level indicator or SLI is “child delight”. We target “5 nines” or 99.999% delightment level meaning 99,999/100,000 nice children are delighted. This limit is our service level objective or SLO and one of the few things everyone here in the North Pole takes very seriously. Each individual service has SLOs we track as well.
We use Stackdriver for dashboards, which we show in our control center. We set up alerting policies to easily track when a service level indicator is below expected and notify us. Santa was a little grumpy since he wanted red and green to be represented equally and we explained that the red warning meant that there were alerts and incidents on a service, but we put candy canes on all our monitors and he was much happier.
Merry monitoring for all
We have a team of elite SREs (Site Reliability Elves, though they might be called Site Reliability Engineers by all you folks south of the North Pole) to make sure each and every microservice is working correctly, particularly around this most wonderful time of the year. One of the most important things to get right is the monitoring.
For example, we built our own “internet of things” or IoT where each toy production station has sensors and computers so we know the number of toys made, what their quota was and how many of them passed inspection. Last Tuesday, there was an alert that the number of failed toys had shot up. Our SREs sprang into action. They quickly pulled up the dashboards for the inspection stations and saw that the spike in failures was caused almost entirely by our baby doll line. They checked the logs and found that on Monday, a creative elf had come up with the idea of taping on arms and legs rather than sewing them to save time. They rolled back this change immediately. Crisis averted. Without the proper monitoring and logging, it would be very difficult to find and fix the issue, which is why our SREs consider it the base of their gift reliability pyramid.
All I want for Christmas is machine learning
Running things in Google Cloud has another benefit: we can use technology they’ve developed at Google. One of our most important services is our gift matching service, which takes 50 factors as input including the child’s wish list, niceness score, local regulations, existing toys, etc., and comes up with the final list of which gifts should be delivered to this child. Last year, we added machine learning or ML, where we gave the Cloud ML engine the last 10 years of inputs, gifts and child and parent delight levels. It automatically learned a new model to use in gift matching based on this data.
Using this new ML model, we reduced live animal gifts by 90%, ball pits by 50% and saw a 5% increase in child delight and a 250% increase in parent delight.
Tis the season for sharing
Know someone who loves technology that might enjoy this article or someone who reminds you of Santa — someone with many amazing skills but whose eyes get that “reindeer-in-the-headlights look” when you talk about cloud computing? Share this article with him or her and hopefully you’ll soon be chatting about all the cool things you can do with cloud computing over Christmas cookies and eggnog... And be sure to tell them to sign up for a free trial — Google Cloud’s gift to them!
Whether you're looking to build your next big application, learn some really cool technology concepts or gain some hands-on development experience, Google Cloud Platform (GCP) is a great development platform. But where do you start?
Lots of customers talk to us about their varying application development needs — for example, what are the best tools to use for web and mobile app development, how do I scale my application back-end and how do I add data processing and intelligence to my application? In this blog, we’ll share some resources to help you identify which products are best suited to your development goals.
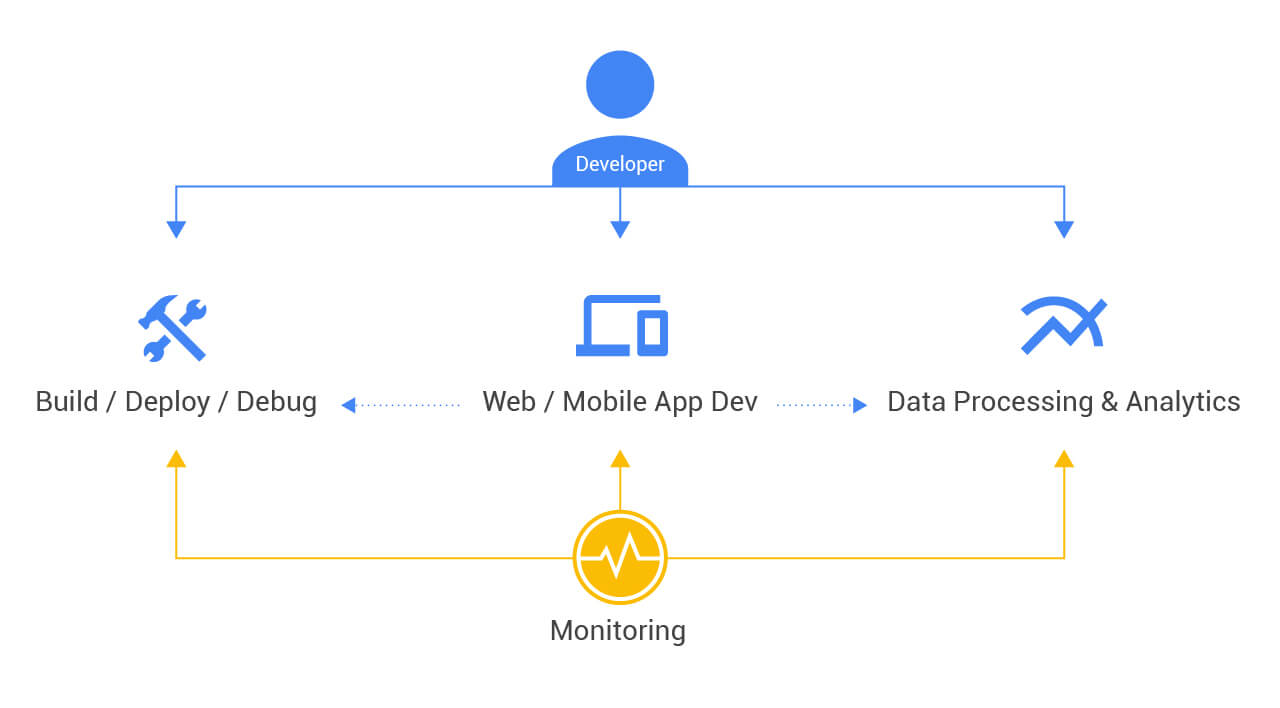
To help you get started, here are a few resources such as quick start guides, videos and codelabs for services across web and mobile app development, developer tools, data processing and analytics and monitoring:
Web and mobile app development:
Google App Engine offers a fully managed serverless platform that allows you to build highly scalable web and mobile applications. If you're looking for a zero-config application hosting service that will let you auto-scale from zero to infinite-size without having to manage any infrastructure, look no further than App Engine
Cloud Functions is another great event-driven serverless compute platform you can use to build microservices at the functions level, scale to infinite size and pay only for what you use. If you're looking for a lightweight compute platform to run your code in response to user actions, analytics, authentication events or for telemetry data collection, real-time processing and analysis, Cloud Functions has everything you need to be agile and productive.
Developer tools provide plugins to build, deploy and debug code using your favorite IDEs, such as IntelliJ, Eclipse, Gradle and Maven. You can use either cloud SDK or a browser-based command line to build your apps. Cloud Source Repositories that come as a part of developer tools let you host private Git repos and organize the associated code. Below are a sampling of resources, check out the developer tools section for more.
BigQuery offers a fast, highly scalable, low cost and fully managed data warehouse on which you can perform analytics. Cloud Pub/Sub allows you to ingest event streams from anywhere, at any scale, for simple, reliable, real-time stream analytics. BigQuery and Pub/Sub work seamlessly with services like Cloud Machine Learning Engine to help you add an intelligence layer to your application.
Google Stackdriver provides powerful monitoring, logging and diagnostics. It equips you with insight into the health, performance and availability of cloud-powered applications, enabling you to find and fix issues faster. It's natively integrated with GCP, other cloud providers and popular open source packages.
I hope this gives you enough content to keep you engaged and provide great learning experiences of the different application development services on GCP. Looking for tips and tricks as you're building your applications? Check out this link for details. Sign up for your free trial today and get a $300 GCP credit!
Most developers know that logs are important for debugging purposes but struggle in extracting value from the massive volume of logs generated across their system. This is where the right tools to extract insights from logs can really make a difference. Stackdriver Logging’s improved analytics tools became available in beta earlier this year and are now generally available, and being used by our customers.
Logs-based metrics are the cornerstone of Stackdriver Logging’s analytics platform and allow you to identify trends and extract numeric values out of the logs. Here are a few examples of how we’ve seen customers use logs-based metrics.
Filter on labels
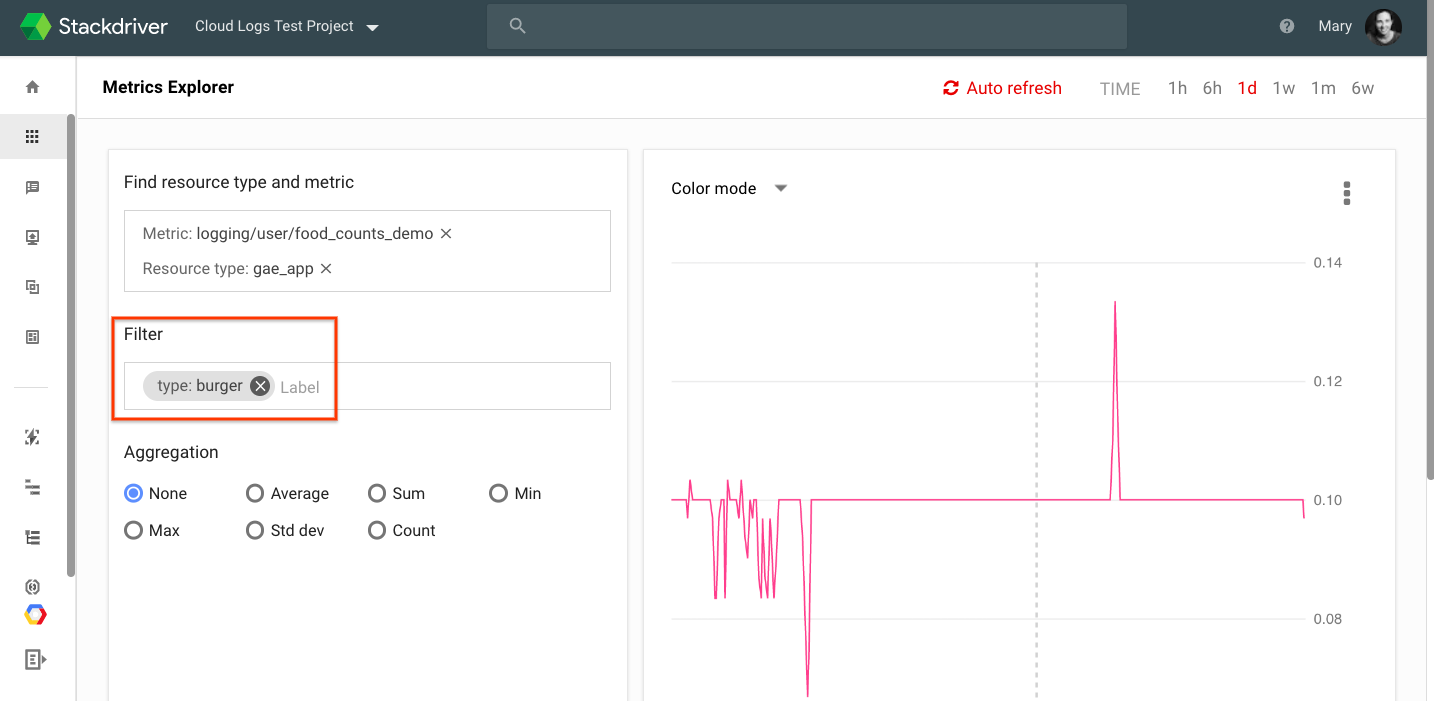
As a simple example, we have a sample App Engine restaurant application that includes a parameter that includes food ordered in the URL. We want to be able to count the number of each menu item ordered. Logs-based metric labels allow you to use a regular expression to extract the desired field.
You can then view the logs-based metric, filter on the labels or create alerts in Stackdriver Monitoring. In the example below, we use Metric Explorer to filter down to just “burgers” and can see the rate of orders placed over the last day.
Google Cloud Apigee needed to take their terabytes of rich log data and understand errors and latency for each service they run across each region. They used logs based metric labels to extract the service and region directly from the log entry. As Madhurranjan Mohaan, software engineer at Apigee explains, “Parameterizing log searches based on labels have really helped us visualize errors and latency across multiple charts. It’s great because it’s parameterized across all regions.”
Extract values from log entries with distribution metrics
Waze uses distribution metrics to extract fields such as latency from their log entries. They can then view the distributions coming from logs as a heat map in Stackdriver Monitoring.
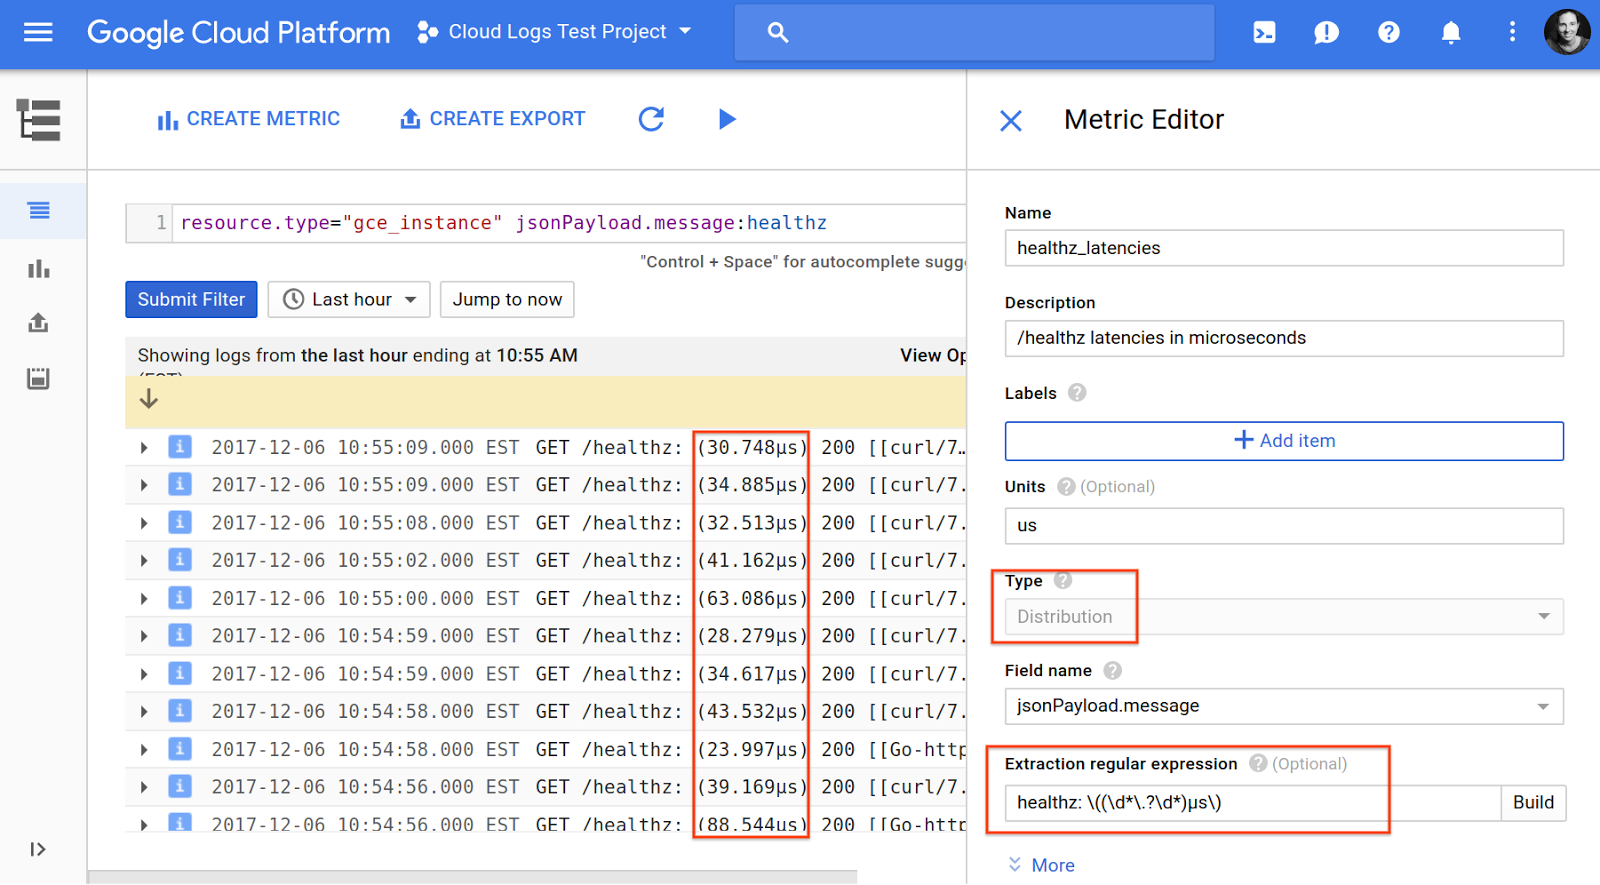
As a simple example, we have an application running on Compute Engine VMs, emitting logs with a latency value in the payload. We first filter down to the relevant log entries that include the “healthz” text in the payload and then use a regular expression to extract the value for the distribution logs-based metric.
In Stackdriver Monitoring, we can visualize the data. In the example below, we add the chart as a heatmap to a custom dashboard. We could also instead choose to visualize it as a line chart of the 99th percentile, for example, by changing the aggregation and visualization.
Alert on matching log entries
Another common use case is to get notified whenever a matching log entry occurs. For example, to get an email whenever a new VM is created in your system, you can create a logs-based metric on log entries for new VMs and then create a metric threshold based alerting policy. To see how to do this, watch this short video.
You can also use logs-based metrics to gain insight into the performance of Google Cloud Platform (GCP) services. For example, recently, our BigQuery team did an analysis of easily fixed errors that BigQuery users commonly encounter. We discovered that many users received rateLimitExceeded and quotaExceeded. We found that using logs-based metrics can improve the user experience by adding visibility to BigQuery administrators. You can read more about this analysis here.
We hope these examples help you to leverage the power of Stackdriver Logging analytics. If you have questions, feedback or want to share how you’ve made logs based metrics work for you, we’d love to hear from you.
Most developers know that logs are important for debugging purposes but struggle in extracting value from the massive volume of logs generated across their system. This is where the right tools to extract insights from logs can really make a difference. Stackdriver Logging’s improved analytics tools became available in beta earlier this year and are now generally available, and being used by our customers.
Logs-based metrics are the cornerstone of Stackdriver Logging’s analytics platform and allow you to identify trends and extract numeric values out of the logs. Here are a few examples of how we’ve seen customers use logs-based metrics.
Filter on labels
As a simple example, we have a sample App Engine restaurant application that includes a parameter that includes food ordered in the URL. We want to be able to count the number of each menu item ordered. Logs-based metric labels allow you to use a regular expression to extract the desired field.
You can then view the logs-based metric, filter on the labels or create alerts in Stackdriver Monitoring. In the example below, we use Metric Explorer to filter down to just “burgers” and can see the rate of orders placed over the last day.
Google Cloud Apigee needed to take their terabytes of rich log data and understand errors and latency for each service they run across each region. They used logs based metric labels to extract the service and region directly from the log entry. As Madhurranjan Mohaan, software engineer at Apigee explains, “Parameterizing log searches based on labels have really helped us visualize errors and latency across multiple charts. It’s great because it’s parameterized across all regions.”
Extract values from log entries with distribution metrics
Waze uses distribution metrics to extract fields such as latency from their log entries. They can then view the distributions coming from logs as a heat map in Stackdriver Monitoring.
As a simple example, we have an application running on Compute Engine VMs, emitting logs with a latency value in the payload. We first filter down to the relevant log entries that include the “healthz” text in the payload and then use a regular expression to extract the value for the distribution logs-based metric.
In Stackdriver Monitoring, we can visualize the data. In the example below, we add the chart as a heatmap to a custom dashboard. We could also instead choose to visualize it as a line chart of the 99th percentile, for example, by changing the aggregation and visualization.
Alert on matching log entries
Another common use case is to get notified whenever a matching log entry occurs. For example, to get an email whenever a new VM is created in your system, you can create a logs-based metric on log entries for new VMs and then create a metric threshold based alerting policy. To see how to do this, watch this short video.
You can also use logs-based metrics to gain insight into the performance of Google Cloud Platform (GCP) services. For example, recently, our BigQuery team did an analysis of easily fixed errors that BigQuery users commonly encounter. We discovered that many users received rateLimitExceeded and quotaExceeded. We found that using logs-based metrics can improve the user experience by adding visibility to BigQuery administrators. You can read more about this analysis here.
We hope these examples help you to leverage the power of Stackdriver Logging analytics. If you have questions, feedback or want to share how you’ve made logs based metrics work for you, we’d love to hear from you.
The Google Cloud Ruby team continues to expand our support for Ruby apps running on Google Cloud Platform (GCP). Case in point, we’ve released beta gems for Stackdriver, our monitoring, logging and diagnostics suite. Now you can use Stackdriver in your Ruby projects not only on GCP but also on AWS and in your own data center. You can read more about the libraries on GitHub.
Like with all our Ruby libraries, we’re focused on ensuring the Stackdriver libraries make sense to Rubyists and helps them do their jobs more easily. Installation is easy. With Rails, simply add the "stackdriver" gem to your Gemfile and the entire suite is automatically loaded for you. With other Rack-based web frameworks like Sinatra, you require the gem and use the provided middleware.
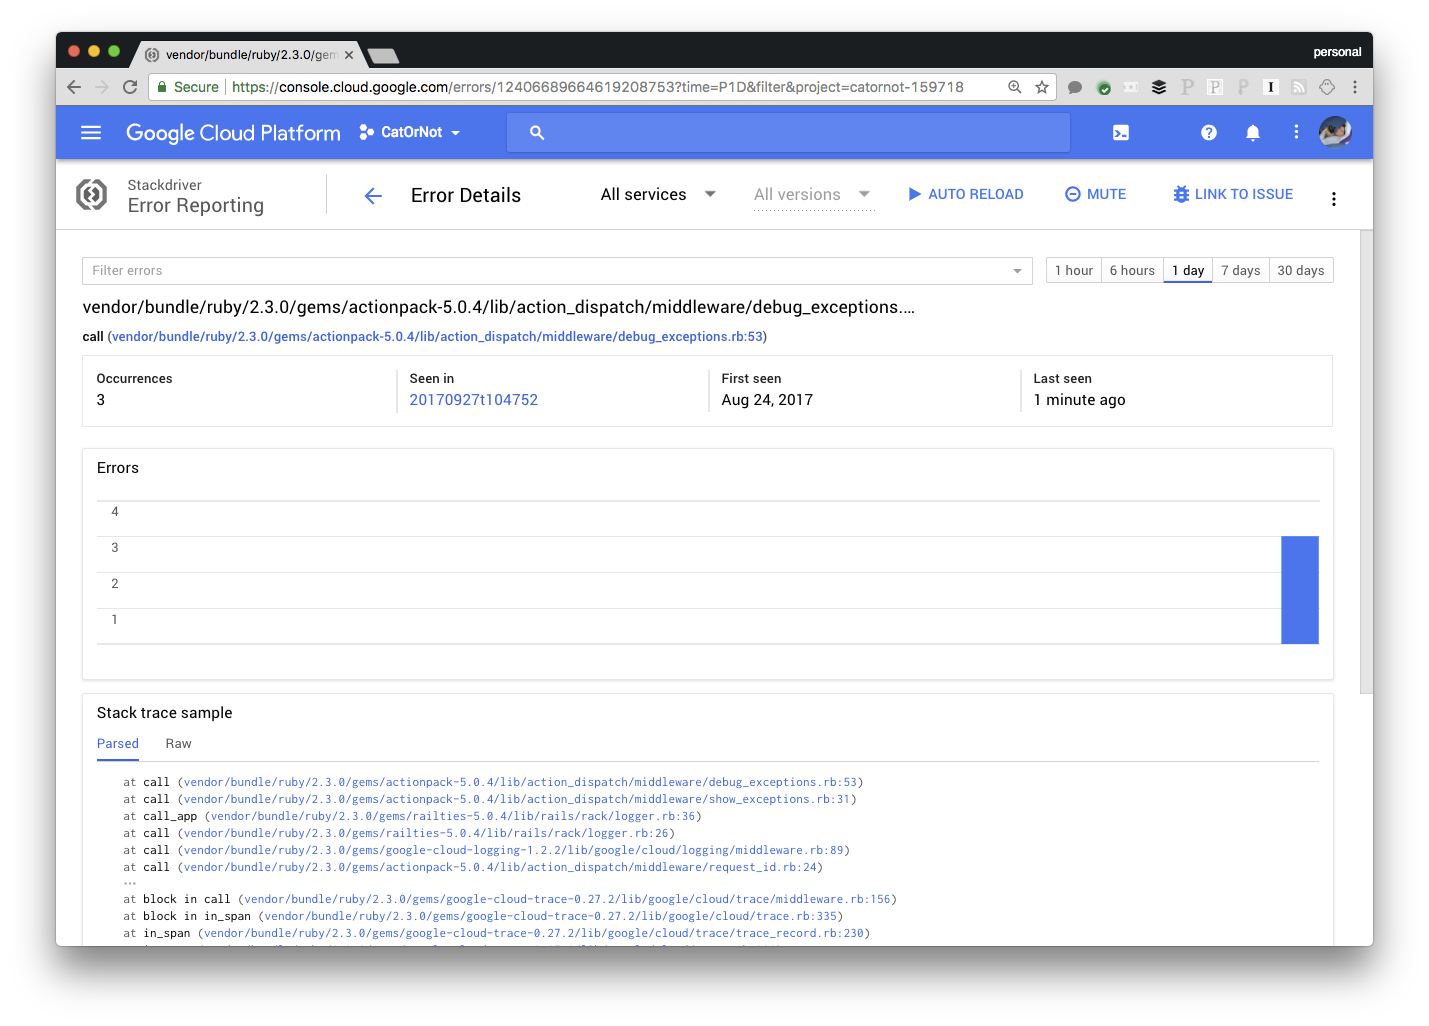
Stackdriver Debugger is my favorite Stackdriver product. It provides live, production debugging without needing to redeploy. Once you’ve included the gem in your application, go to Cloud Console, upload your code (or point the debugger at a repository) and you’ll get snapshots of your running application including variable values and stacktraces. You can even add arbitrary log lines to your running application without having to redeploy it. Better yet, Debugger captures all this information in just one request to minimize the impact on your running application. Stackdriver Error Reporting is Google Cloud's exception detection and reporting tool. It catches crashes in your application, groups them logically, alerts you to them (with appropriate alerting back-off), and displays them for you neatly in the UI. The UI shows you stacktraces of the errors and links to logs and distributed traces for each crash, and lets you acknowledge errors and link a group of errors to a bug in your bug database so you can keep better track of what is going on. In addition to automatically detecting errors, Stackdriver Error Reporting lets you send errors from your code in just a single line.
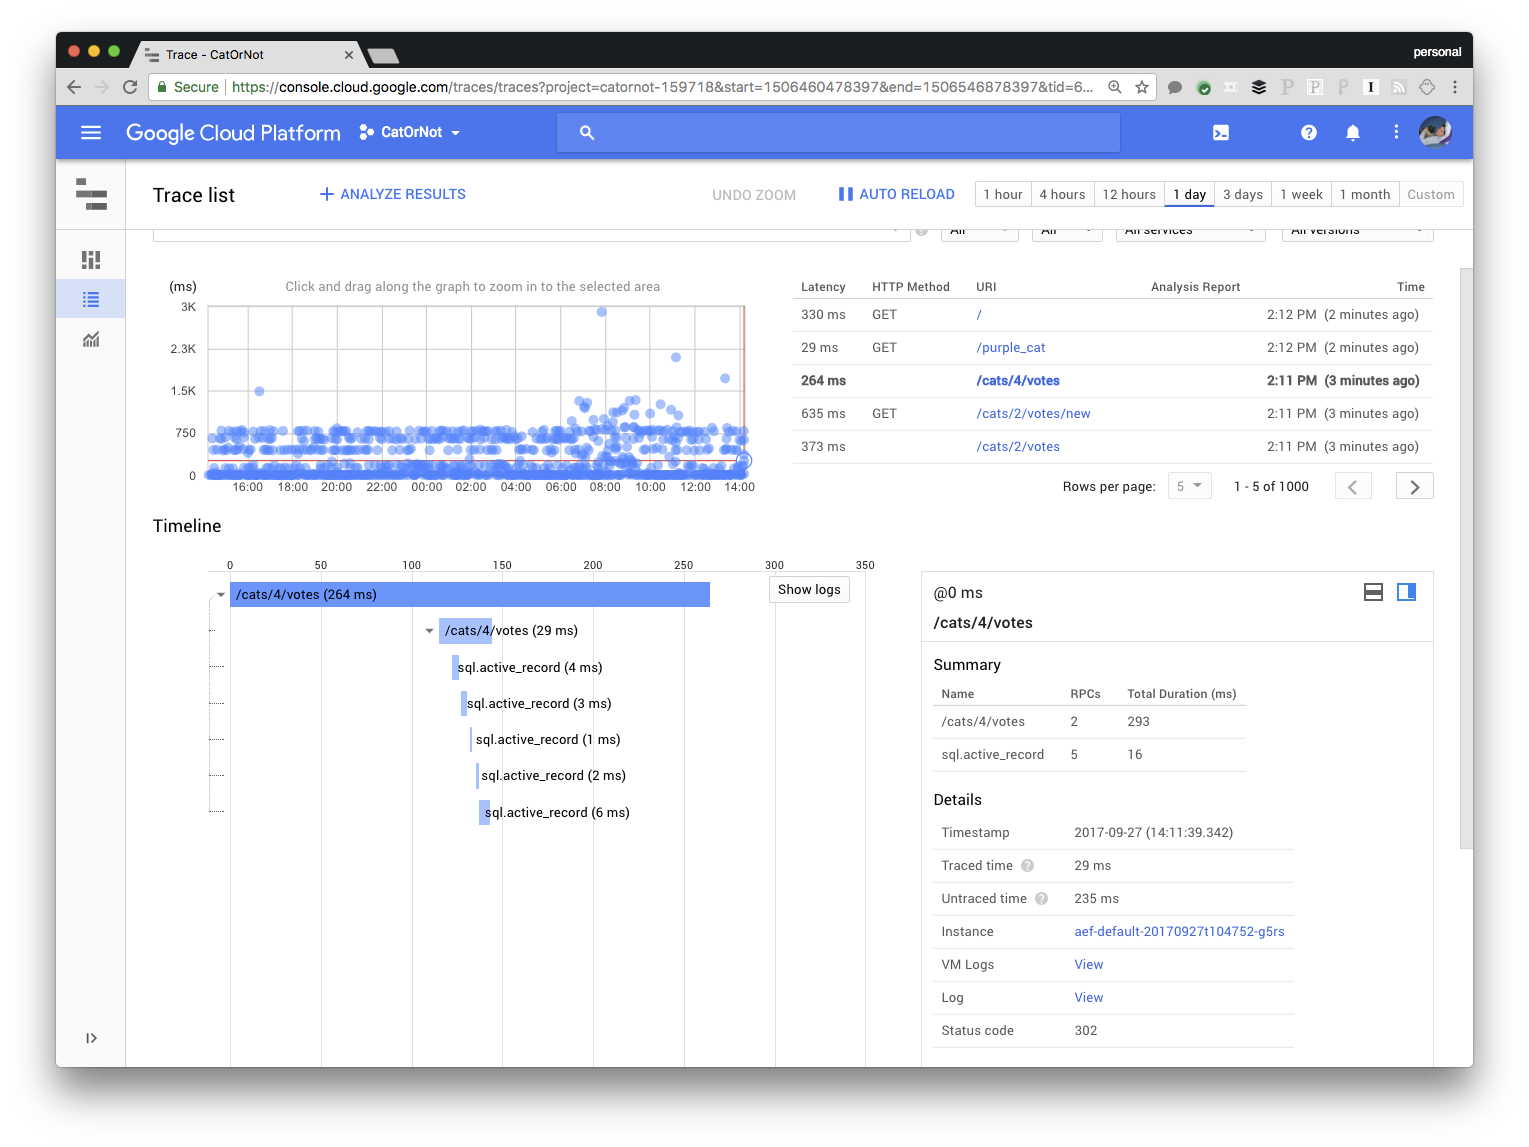
Stackdriver Trace is Google's application performance monitoring and distributed tracing tool. In Rails it automatically shows you the amount of time a request spends hitting the database, rendering the views, and in application logic. It can also show you how a request moves through a microservices architecture and give you detailed reports on latency trends over time. This way, you can answer once and for all "Did the application get slower after the most recent release?"
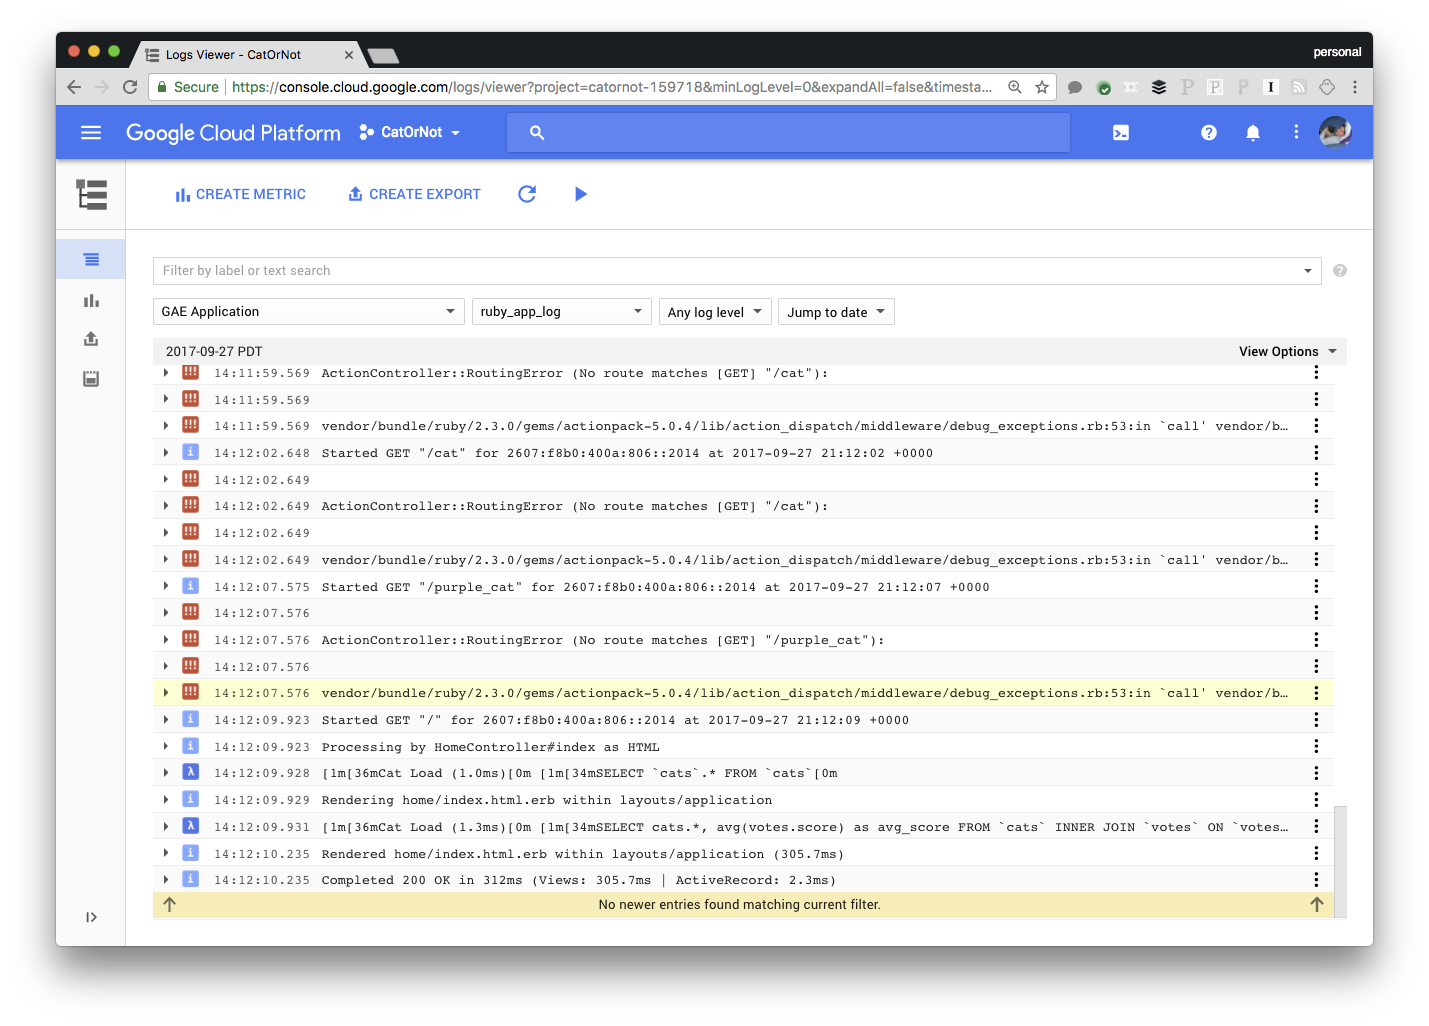
Stackdriver Logging’s Ruby library was already generally available, and is currently being used by many of Container Engine customers in conjunction with the fluentd logging agent. You can use the logging library even if you don't use Container Engine, since it’s a drop-in replacement for the Ruby and Rails Logger. And when the Stackdriver gem is included in a Rails application, information like request latency is automatically pushed to Stackdriver Logging as well.
You can find instructions for getting started with the Stackdriver gems on GitHub. The Stackdriver gems are currently in beta, and we’re eager for folks to try them out and give us feedback either in the Ruby channel on the GCP Slack or on GitHub, so we can make the libraries as useful and helpful as possible to the Ruby community.
By John La Barge, Cloud Solutions Architect
Many Google Cloud Platform (GCP) users are now migrating production workloads to Container Engine, our managed Kubernetes environment. Container Engine supports Stackdriver logging on GCP by default, which uses Fluentd under the hood to send your logs to Stackdriver.
You may also want to fully customize your Container Engine cluster’s Stackdriver logs with additional logging filters. If that describes you, check out this tutorial where you’ll learn how you can configure Fluentd in Container Engine to apply additional logging filters prior to sending your logs to Stackdriver.
Joseph Holley, Cloud Solutions Architect
Capturing logs from dedicated game server instances in a central location can be useful for troubleshooting, keeping track of instance runtimes and machine load, and capturing historical data that occurs during the lifetime of a game.
But collecting and making sense of these logs can be tricky, especially if you are launching the same game in multiple regions, or have limited resources on which to collect the logs themselves.
One possible solution to these problems is to collect your logs in the cloud. Doing this enables you to mine your data with tools that deliver speed and power not possible from an on-premise logging server. Storage and data management is simple in the cloud and not bound by physical hardware. Additionally, you can access cloud logging resources globally. Studios and BI departments across the globe can access the same logging database regardless of physical location, making collaboration for distributed teams significantly easier.
We recently put together a tutorial that shows you how to integrate Stackdriver Logging, our hosted log management and analysis service for data running on Google Cloud Platform (GCP) and AWS, into your own dedicated game server environment. It also offers some key storage strategies, including how to migrate this data to BigQuery and other Google Cloud tools. Check it out, and let us know what other Google Cloud tools you’d like to learn how to use in your game operations. You can reach me on Twitter at @gcpjoe.