Tag Archives: Health

Expanding the Application of Deep Learning to Electronic Health Records


In 2018 we published a paper that showed how machine learning, when applied to medical records, can predict what might happen to patients who are hospitalized: for example, how long they would need to be in the hospital and, if discharged, how likely they would be to come back unexpectedly. Predictive models of various kinds have already been deployed in hospital settings by others, and our work aims to further improve potential clinical benefit by using new models that can make predictions faster, more accurate, and more adaptable for a broader range of clinical contexts.

Any endeavor to demonstrate the promise of machine learning requires intense collaboration between engineers, doctors, and medical researchers to make sure the work benefits patients, physicians, and health systems, and that it is equitable. Google is already fortunate to partner with some of the best academic medical centers in the world and we are now expanding this work to include Intermountain Healthcare, based in Utah.
The initial collaboration will focus on understanding how Google might adapt machine learning predictions to the various Intermountain care settings, from primary care clinics to the TeleHealth critical care unit, which remotely monitors critically ill patients in surrounding hospitals. We see potential in exploring how scalable computing platforms that include predictions might assist clinical teams in providing the best possible care.

As with our previous research, we will begin with jointly testing the performance of machine learning models on historical records, following strict policies to ensure that all data privacy and security measures are followed.

We are excited to explore how scalable computing platforms that include predictions might assist clinical teams in providing the best possible care in these settings. We additionally hope to further validate that our approach to predictions can work across health systems and improve care for patients.

Source: Google AI Blog


Improving the Effectiveness of Diabetic Retinopathy Models


Two years ago, we announced our inaugural work in training deep learning models for diabetic retinopathy (DR), a complication of diabetes that is one of the fasting growing causes of vision loss. Based on this research, we set out to apply our technology to improve health outcomes in the world. At the same time, we’ve continued our efforts to improve the model’s performance, explainability, and applicability in clinical settings. Today, we are sharing our research progress toward these goals, as well as announcing a new partner in Thailand.

Improving Model Performance with High-quality Labels
The performance of DR deep learning models is critically important, especially when subtle errors have the potential to generate a misdiagnosis. Earlier this year we published a paper in the journal Ophthalmology that looked at how we could improve our model by 1) moving toward a more granular 5-point grading scale (versus the previous 2-class system) and 2) incorporating adjudication by a panel of retinal specialists. During the adjudication process, a group of retinal specialists debated any case with disagreement until everyone agreed on the final grade. Compared to simply taking a majority vote, this method of resolving disagreements was more accurate and allowed for the identification of subtle findings, such as microaneurysms.

To increase the efficiency of the adjudication process, we carefully selected a small subset (0.22%) of images to use as a tuning set, substantially improving model performance by optimizing model hyperparameters on this more accurate reference standard. When we subsequently measured the rate of agreement against a test set of images with an adjudicated reference standard, the kappa scores (a measurement of agreement that ranges from 0 [random] to 1 [perfect agreement]) for individual retinal specialists, ophthalmologists, and the algorithm ranged from 0.82-0.91, 0.80-0.84, and 0.84, respectively.
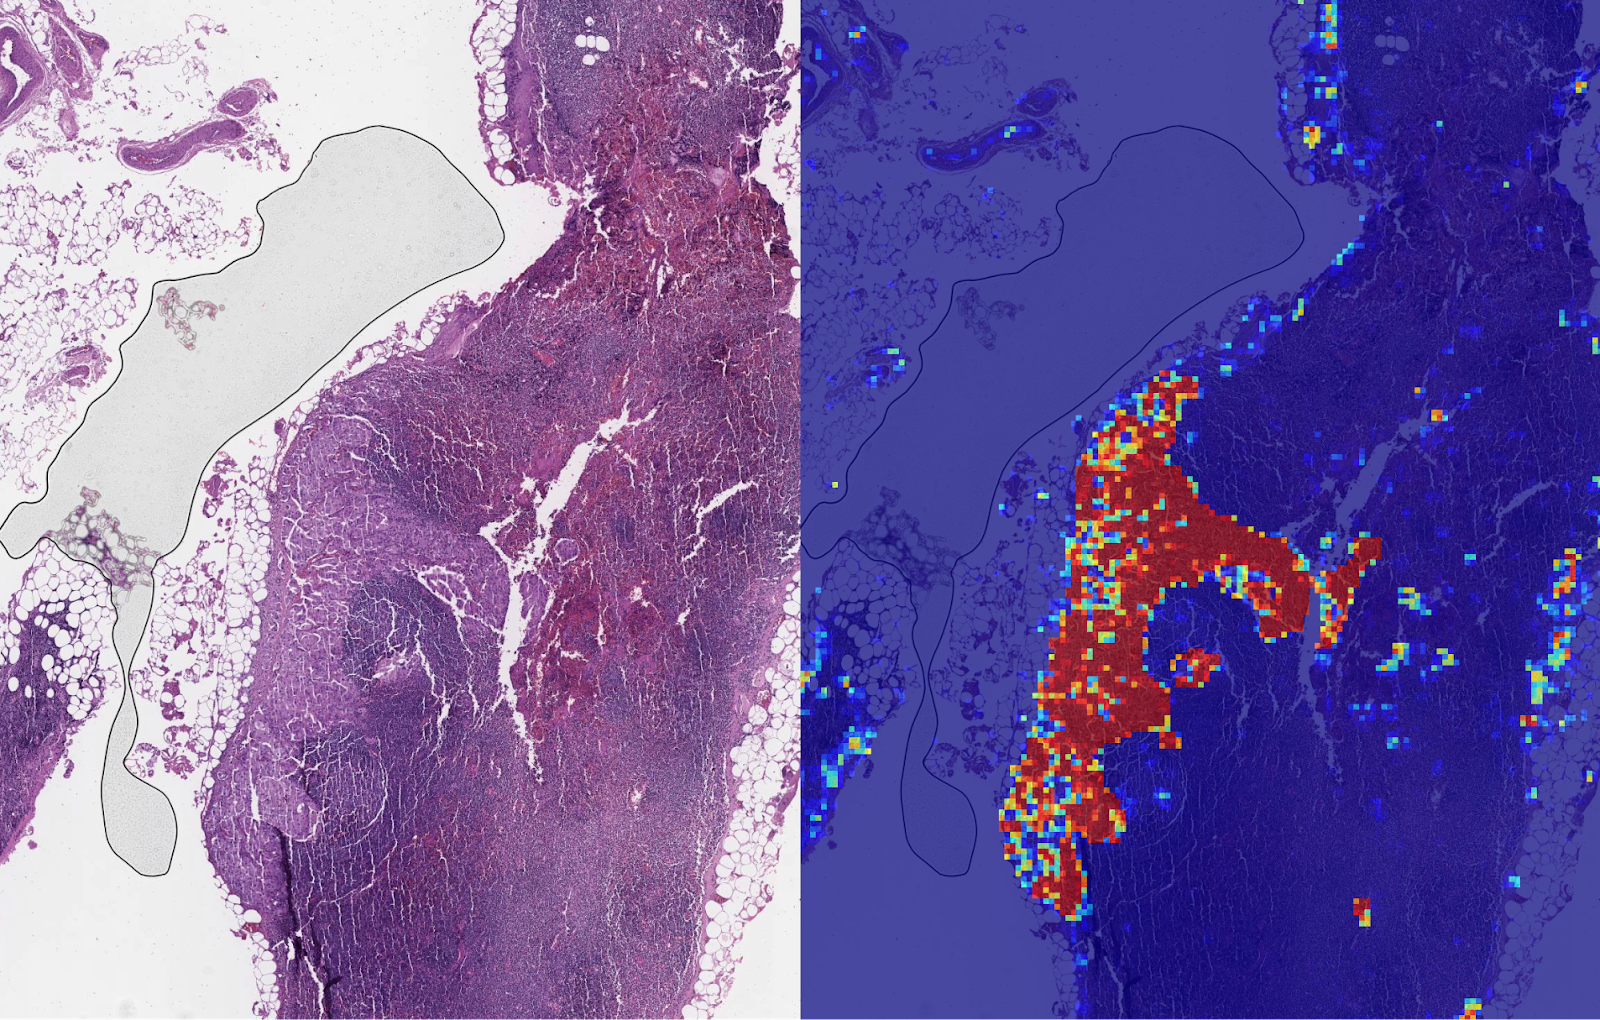
Making our Models More Transparent
As we deploy this technology, it is important that we take the proper steps to ensure that it is transparent and trusted. To that end, we have been exploring ways to explain how the model is making its predictions, with the goal of making the DR model a better diagnostic tool and aid for doctors.

In our latest study, to be published today in Ophthalmology, we demonstrate methods by which explanations of deep learning algorithms can be shown to ophthalmologists to increase both the accuracy and confidence of their grading for diabetic eye disease. Using the results of the model trained and validated on high quality labels from our earlier study, we generated different forms of potential assistance for general ophthalmologists. We presented to the physicians the algorithm’s predicted scores for different DR severity levels as well as heatmaps highlighting image regions that most strongly drove its predictions. Using this assistance, we saw a significant increase in physicians’ diagnostic accuracy, as well as improved confidence in their diagnosis.

We saw clear evidence that showing model predictions could help physicians catch pathology they otherwise might have missed. In the retinal image below, our adjudication panel found signs of vision-threatening DR. This was missed by 2 of 3 doctors who graded it without assistance; but caught by all 3 doctors who graded it when they saw the model predictions (which accurately detected the pathology).
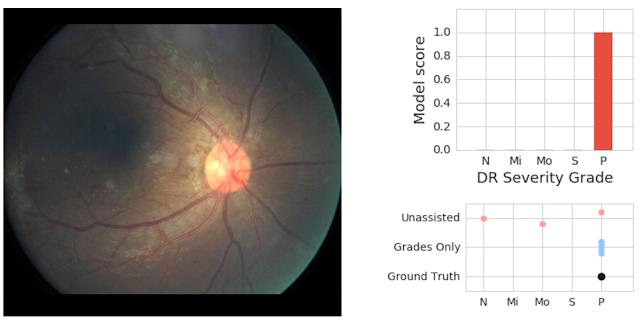
On the left is a fundus image graded as having proliferative (vision-threatening) DR by an adjudication panel of ophthalmologists (ground truth). On the top right is an illustration of our deep learning model’s predicted scores (“P” = proliferative, the most severe form of DR). On the bottom right is the set of grades given by physicians without assistance (“Unassisted”) and those who saw the model’s predictions (“Grades Only”).
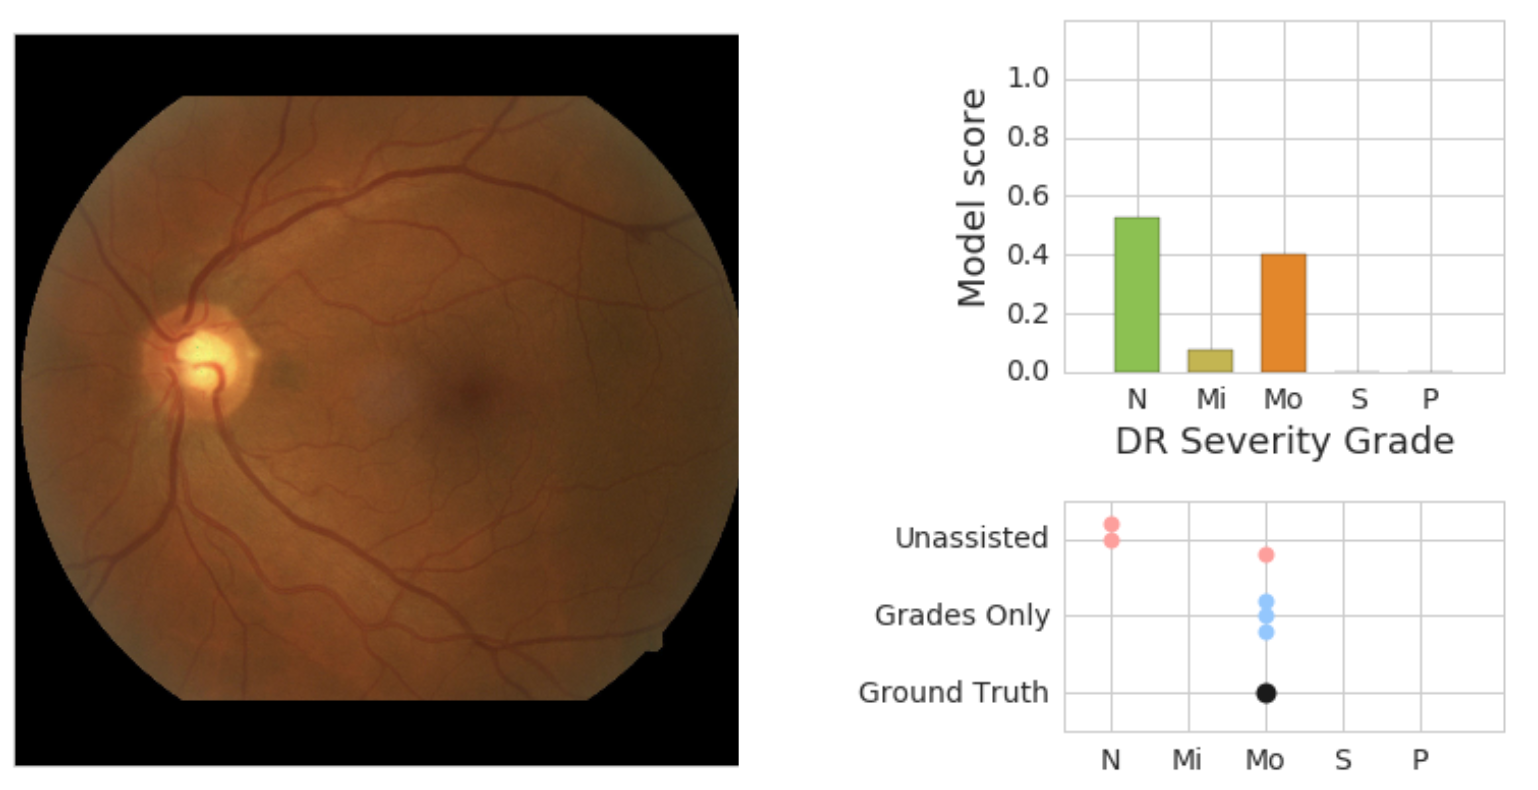
We also saw evidence that physicians and the model can work together in a way that provides more accuracy than either individually. In the retinal image below, our adjudication panel of retina specialists considered it to have moderate DR. Without assistance, two out of three ophthalmologists grading the image marked it as no DR. In real-world settings, this situation could result in a patient missing a needed referral to a specialist.
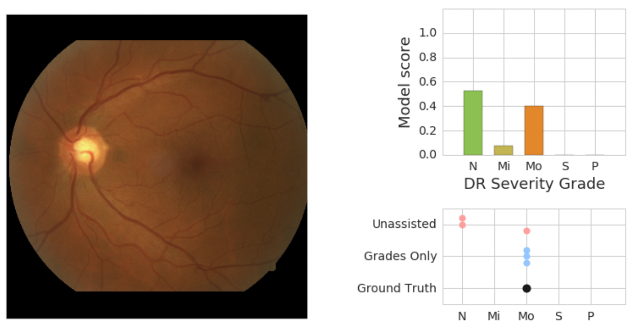
On the left is a retinal fundus image graded as having moderate DR (“Mo”) by an adjudication panel of ophthalmologists (ground truth). On the top right is an illustration of the predicted scores (“N” = no DR, “Mi” = Mild DR, “Mo” = Moderate DR) from the model. On the bottom right is the set of scores given by physicians without assistance (“Unassisted”) and those who saw the model’s predictions (“Grades Only”).
In this particular case, our model also indicated evidence for no DR. However, when ophthalmologists saw the model’s predictions, all three gave the correct answer. Seeing that the model saw some evidence for Moderate -- even if it wasn’t the highest score -- may prompt doctors to examine particular cases more carefully for pathology they may otherwise miss. We are excited to develop assistance that works like this, where human and machine learning abilities complement each other.

A New Partner in our Global Efforts
With the help of screening programs and in collaboration with Verily, we have laid a robust foundation for the implementation of these highly accurate systems in real world clinical settings. Working with doctors at Aravind Eye Hospitals and Sankara Nethralaya in India, and now, through our new partnership with the Rajavithi Hospital, affiliated with the Department of Medical Services, Ministry of Public Health in Thailand, we are validating the model performance with patients from broad screening programs. Given the positive results of our model on their real patient population, we are now beginning to pilot the model in their screening programs. We’re looking forward to a very busy 2019!

Source: Google AI Blog


Improved Grading of Prostate Cancer Using Deep Learning


Approximately 1 in 9 men in the United States will develop prostate cancer in their lifetime, making it the most common cancer in males. Despite being common, prostate cancers are frequently non-aggressive, making it challenging to determine if the cancer poses a significant enough risk to the patient to warrant treatment such as surgical removal of the prostate (prostatectomy) or radiation therapy. A key factor that helps in the “risk stratification” of prostate cancer patients is the Gleason grade, which classifies the cancer cells based on how closely they resemble normal prostate glands when viewed on a slide under a microscope.

However, despite its widely recognized clinical importance, Gleason grading of prostate cancer is complex and subjective, as evidenced by studies reporting inter-pathologist disagreements ranging from 30-53% [1][2]. Furthermore, there are not enough speciality trained pathologists to meet the global demand for prostate cancer pathology, especially outside the United States. Recent guidelines also recommend that pathologists report the percentage of tumor of different Gleason patterns in their final report, which adds to the workload and is yet another subjective challenge for the pathologist [3]. Overall, these issues suggest an opportunity to improve the diagnosis and clinical management of prostate cancer using deep learning–based models, similar to how Google and others used such techniques to demonstrate the potential to improve metastatic breast cancer detection.

In “Development and Validation of a Deep Learning Algorithm for Improving Gleason Scoring of Prostate Cancer”, we explore whether deep learning could improve the accuracy and objectivity of Gleason grading of prostate cancer in prostatectomy specimens. We developed a deep learning system (DLS) that mirrors a pathologist’s workflow by first categorizing each region in a slide into a Gleason pattern, with lower patterns corresponding to tumors that more closely resemble normal prostate glands. The DLS then summarizes an overall Gleason grade group based on the two most common Gleason patterns present. The higher the grade group, the greater the risk of further cancer progression and the more likely the patient is to benefit from treatment.
Visual examples of Gleason patterns, which are used in the Gleason system for grading prostate cancer. Individual cancer patches are assigned a Gleason pattern based on how closely the cancer resembles normal prostate tissue, with lower numbers corresponding to more well differentiated tumors. Image Source: National Institutes of Health.
To develop and validate the DLS, we collected de-identified images of prostatectomy samples which contain a greater amount and diversity of prostate cancer than needle core biopsies, even though the latter is the more common clinical procedure. On the training data, a cohort of 32 pathologists provided detailed annotations of Gleason patterns (resulting in over 112 million annotated image patches) and an overall Gleason grade group for each image. To overcome the previously referenced variability in Gleason grading, each slide in the validation set was independently graded by 3 to 5 general pathologists (selected from a cohort of 29 pathologists) and had a final Gleason grade assigned by a genitourinary-specialist pathologist to obtain the ground-truth label for that slide.

In the paper, we show that our DLS achieved an overall accuracy of 70%, compared to an average accuracy of 61% achieved by US board-certified general pathologists in our study. Of 10 high-performing individual general pathologists who graded every slide in the validation set, the DLS was more accurate than 8. The DLS was also more accurate than the average pathologist at Gleason pattern quantitation. These improvements in Gleason grading translated into better clinical risk stratification: the DLS better identified patients at higher risk for disease recurrence after surgery than the average general pathologist, potentially enabling doctors to use this information to better match patients to therapy.
Comparison of scoring performance of the DLS with pathologists. a: Accuracy of the DLS (in red) compared with the mean accuracy among a cohort-of-29 pathologists (in green). Error bars indicate 95% confidence intervals. b: Comparison of risk stratification provided by the DLS, the cohort-of-29 pathologists, and the genitourinary specialist pathologists. Patients are divided into low and high risk groups based on their Gleason grade group, where a larger separation between the Kaplan-Meier curves of these risk groups indicates better stratification.
We also found that the DLS was able to characterize tissue morphology that appeared to lie at the cusp of two Gleason patterns, which is one reason for the disagreements in Gleason grading observed between pathologists, suggesting the possibility of creating finer grained “precision grading” of prostate cancer. While the clinical significance of these intermediate patterns (e.g. Gleason pattern 3.3 or 3.7) is not known, the increased precision of the DLS will enable further research into this interesting question.
Assessing the region-level classification of the DLS. a: Annotations from 3 pathologists compared to DLS predictions. The pathologists show general concordance on the location and the extent of tumor areas, but poor agreement in classifying Gleason patterns. The DLS’s precision Gleason pattern for each region is represented by interpolating between the DLS’s prediction patterns for Gleason patterns 3 (green), 4 (yellow), and 5 (red). b: DLS prediction
patterns compared to the distribution of pathologists’ Gleason pattern classifications on 41 million annotated image patches from the test dataset. On patches where pathologists are discordant, where the tissue is more likely to be on the cusp of two patterns, the DLS reflects this ambiguity in it's prediction scores.
While these initial results are encouraging, there is much more work to be done before systems like our DLS can be used to improve the care of prostate cancer patients. First, the accuracy of the model can be further improved with additional training data and should be validated on independent cohorts containing a larger number and more diverse group of patients. In addition, we are actively working on refining our DLS system to work on diagnostic needle core biopsies, which occur prior to the decision to undergo surgery and where Gleason grading therefore has a significantly greater impact on clinical decision-making. Further work will be needed to assess how to best integrate our DLS into the pathologist’s diagnostic workflow and the impact of such artificial-intelligence based assistance on the overall efficiency, accuracy, and prognostic ability of Gleason grading in clinical practice. Nonetheless, we are excited about the potential of technologies like this to significantly improve cancer diagnostics and patient care.

Acknowledgements
This work involved the efforts of a multidisciplinary team of software engineers, researchers, clinicians and logistics support staff. Key contributors to this project include Kunal Nagpal, Davis Foote, Yun Liu, Po-Hsuan (Cameron) Chen, Ellery Wulczyn, Fraser Tan, Niels Olson, Jenny L. Smith, Arash Mohtashamian, James H. Wren, Greg S. Corrado, Robert MacDonald, Lily H. Peng, Mahul B. Amin, Andrew J. Evans, Ankur R. Sangoi, Craig H. Mermel, Jason D. Hipp and Martin C. Stumpe. We would also like to thank Tim Hesterberg, Michael Howell, David Miller, Alvin Rajkomar, Benny Ayalew, Robert Nagle, Melissa Moran, Krishna Gadepalli, Aleksey Boyko, and Christopher Gammage. Lastly, this work would not have been possible without the aid of the pathologists who annotated data for this study.

References
  1. Interobserver Variability in Histologic Evaluation of Radical Prostatectomy Between Central and Local Pathologists: Findings of TAX 3501 Multinational Clinical Trial, Netto, G. J., Eisenberger, M., Epstein, J. I. & TAX 3501 Trial Investigators, Urology 77, 1155–1160 (2011).
  2. Phase 3 Study of Adjuvant Radiotherapy Versus Wait and See in pT3 Prostate Cancer: Impact of Pathology Review on Analysis, Bottke, D., Golz, R., Störkel, S., Hinke, A., Siegmann, A., Hertle, L., Miller, K., Hinkelbein, W., Wiegel, T., Eur. Urol. 64, 193–198 (2013).
  3. Utility of Quantitative Gleason Grading in Prostate Biopsies and Prostatectomy Specimens, Sauter, G. Steurer, S., Clauditz, T. S., Krech, T., Wittmer, C., Lutz, F., Lennartz, M., Janssen, T., Hakimi, N., Simon, R., von Petersdorff-Campen, M., Jacobsen, F., von Loga, K., Wilczak, W., Minner, S., Tsourlakis, M. C., Chirico, V., Haese, A., Heinzer, H., Beyer, B., Graefen, M., Michl, U., Salomon, G., Steuber, T., Budäus, L. H., Hekeler, E., Malsy-Mink, J., Kutzera, S., Fraune, C., Göbel, C., Huland, H., Schlomm, T., Clinical Eur. Urol. 69, 592–598 (2016).

Source: Google AI Blog


Applying Deep Learning to Metastatic Breast Cancer Detection


A pathologist’s microscopic examination of a tumor in patients is considered the gold standard for cancer diagnosis, and has a profound impact on prognosis and treatment decisions. One important but laborious aspect of the pathologic review involves detecting cancer that has spread (metastasized) from the primary site to nearby lymph nodes. Detection of nodal metastasis is relevant for most cancers, and forms one of the foundations of the widely-used TNM cancer staging.

In breast cancer in particular, nodal metastasis influences treatment decisions regarding radiation therapy, chemotherapy, and the potential surgical removal of additional lymph nodes. As such, the accuracy and timeliness of identifying nodal metastases has a significant impact on clinical care. However, studies have shown that about 1 in 4 metastatic lymph node staging classifications would be changed upon second pathologic review, and detection sensitivity of small metastases on individual slides can be as low as 38% when reviewed under time constraints.

Last year, we described our deep learning–based approach to improve diagnostic accuracy (LYmph Node Assistant, or LYNA) to the 2016 ISBI Camelyon Challenge, which provided gigapixel-sized pathology slides of lymph nodes from breast cancer patients for researchers to develop computer algorithms to detect metastatic cancer. While LYNA achieved significantly higher cancer detection rates (Liu et al. 2017) than had been previously reported, an accurate algorithm alone is insufficient to improve pathologists’ workflow or improve outcomes for breast cancer patients. For patient safety, these algorithms must be tested in a variety of settings to understand their strengths and weaknesses. Furthermore, the actual benefits to pathologists using these algorithms had not been previously explored and must be assessed to determine whether or not an algorithm actually improves efficiency or diagnostic accuracy.

In “Artificial Intelligence Based Breast Cancer Nodal Metastasis Detection: Insights into the Black Box for Pathologists” (Liu et al. 2018), published in the Archives of Pathology and Laboratory Medicine and “Impact of Deep Learning Assistance on the Histopathologic Review of Lymph Nodes for Metastatic Breast Cancer” (Steiner, MacDonald, Liu et al. 2018) published in The American Journal of Surgical Pathology, we present a proof-of-concept pathologist assistance tool based on LYNA, and investigate these factors.

In the first paper, we applied our algorithm to de-identified pathology slides from both the Camelyon Challenge and an independent dataset provided by our co-authors at the Naval Medical Center San Diego. Because this additional dataset consisted of pathology samples from a different lab using different processes, it improved the representation of the diversity of slides and artifacts seen in routine clinical practice. LYNA proved robust to image variability and numerous histological artifacts, and achieved similar performance on both datasets without additional development.
Left: sample view of a slide containing lymph nodes, with multiple artifacts: the dark zone on the left is an air bubble, the white streaks are cutting artifacts, the red hue across some regions are hemorrhagic (containing blood), the tissue is necrotic (decaying), and the processing quality was poor. Right: LYNA identifies the tumor region in the center (red), and correctly classifies the surrounding artifact-laden regions as non-tumor (blue).
In both datasets, LYNA was able to correctly distinguish a slide with metastatic cancer from a slide without cancer 99% of the time. Further, LYNA was able to accurately pinpoint the location of both cancers and other suspicious regions within each slide, some of which were too small to be consistently detected by pathologists. As such, we reasoned that one potential benefit of LYNA could be to highlight these areas of concern for pathologists to review and determine the final diagnosis.

In our second paper, 6 board-certified pathologists completed a simulated diagnostic task in which they reviewed lymph nodes for metastatic breast cancer both with and without the assistance of LYNA. For the often laborious task of detecting small metastases (termed micrometastases), the use of LYNA made the task subjectively “easier” (according to pathologists’ self-reported diagnostic difficulty) and halved average slide review time, requiring about one minute instead of two minutes per slide.
Left: sample views of a slide containing lymph nodes with a small metastatic breast tumor at progressively higher magnifications. Right: the same views when shown with algorithmic “assistance” (LYmph Node Assistant, LYNA) outlining the tumor in cyan.
This suggests the intriguing potential for assistive technologies such as LYNA to reduce the burden of repetitive identification tasks and to allow more time and energy for pathologists to focus on other, more challenging clinical and diagnostic tasks. In terms of diagnostic accuracy, pathologists in this study were able to more reliably detect micrometastases with LYNA, reducing the rate of missed micrometastases by a factor of two. Encouragingly, pathologists with LYNA assistance were more accurate than either unassisted pathologists or the LYNA algorithm itself, suggesting that people and algorithms can work together effectively to perform better than either alone.

With these studies, we have made progress in demonstrating the robustness of our LYNA algorithm to support one component of breast cancer TNM staging, and assessing its impact in a proof-of-concept diagnostic setting. While encouraging, the bench-to-bedside journey to help doctors and patients with these types of technologies is a long one. These studies have important limitations, such as limited dataset sizes and a simulated diagnostic workflow which examined only a single lymph node slide for every patient instead of the multiple slides that are common for a complete clinical case. Further work will be needed to assess the impact of LYNA on real clinical workflows and patient outcomes. However, we remain optimistic that carefully validated deep learning technologies and well-designed clinical tools can help improve both the accuracy and availability of pathologic diagnosis around the world.

Source: Google AI Blog


Deep Learning for Electronic Health Records


When patients get admitted to a hospital, they have many questions about what will happen next. When will I be able to go home? Will I get better? Will I have to come back to the hospital? Having precise answers to those questions helps doctors and nurses make care better, safer, and faster — if a patient’s health is deteriorating, doctors could be sent proactively to act before things get worse.

Predicting what will happen next is a natural application of machine learning. We wondered if the same types of machine learning that predict traffic during your commute or the next word in a translation from English to Spanish could be used for clinical predictions. For predictions to be useful in practice they should be, at least:
  1. Scalable: Predictions should be straightforward to create for any important outcome and for different hospital systems. Since healthcare data is very complicated and requires much data wrangling, this requirement is not straightforward to satisfy.
  2. Accurate: Predictions should alert clinicians to problems but not distract them with false alarms. With the widespread adoption of electronic health records, we set out to use that data to create more accurate prediction models.
Together with colleagues at UC San Francisco, Stanford Medicine, and The University of Chicago Medicine, we published “Scalable and Accurate Deep Learning with Electronic Health Records” in Nature Partner Journals: Digital Medicine, which contributes to these two aims.
We used deep learning models to make a broad set of predictions relevant to hospitalized patients using de-identified electronic health records. Importantly, we were able to use the data as-is, without the laborious manual effort typically required to extract, clean, harmonize, and transform relevant variables in those records. Our partners had removed sensitive individual information before we received it, and on our side, we protected the data using state-of-the-art security including logical separation, strict access controls, and encryption of data at rest and in transit.

Scalability
Electronic health records (EHRs) are tremendously complicated. Even a temperature measurement has a different meaning depending on if it’s taken under the tongue, through your eardrum, or on your forehead. And that's just a simple vital sign. Moreover, each health system customizes their EHR system, making the data collected at one hospital look different than data on a similar patient receiving similar care at another hospital. Before we could even apply machine learning, we needed a consistent way to represent patient records, which we built on top of the open Fast Healthcare Interoperability Resources (FHIR) standard as described in an earlier blog post.

Once in a consistent format, we did not have to manually select or harmonize the variables to use. Instead, for each prediction, a deep learning model reads all the data-points from earliest to most recent and then learns which data helps predict the outcome. Since there are thousands of data points involved, we had to develop some new types of deep learning modeling approaches based on recurrent neural networks (RNNs) and feedforward networks.
Data in a patient's record is represented as a timeline. For illustrative purposes, we display various types of clinical data (e.g. encounters, lab tests) by row. Each piece of data, indicated as a little grey dot, is stored in FHIR, an open data standard that can be used by any healthcare institution. A deep learning model analyzed a patient's chart by reading the timeline from left to right, from the beginning of a chart to the current hospitalization, and used this data to make different types of predictions.
Thus we engineered a computer system to render predictions without hand-crafting a new dataset for each task, in a scalable manner. But setting up the data is only one part of the work; the predictions also need to be accurate.

Prediction Accuracy
The most common way to assess accuracy is by a measure called the area-under-the-receiver-operator curve, which measures how well a model distinguishes between a patient who will have a particular future outcome compared to one who will not. In this metric, 1.00 is perfect, and 0.50 is no better than random chance, so higher numbers mean the model is more accurate. By this measure, the models we reported in the paper scored 0.86 in predicting if patients will stay long in the hospital (traditional logistic regression scored 0.76); they scored 0.95 in predicting inpatient mortality (traditional methods were 0.86), and they scored 0.77 in predicting unexpected readmissions after patients are discharged (traditional methods were 0.70). These gains were statistically significant.

We also used these models to identify the conditions for which the patients were being treated. For example, if a doctor prescribed ceftriaxone and doxycycline for a patient with an elevated temperature, fever and cough, the model could identify these as signals that the patient was being treated for pneumonia. We emphasize that the model is not diagnosing patients — it picks up signals about the patient, their treatments and notes written by their clinicians, so the model is more like a good listener than a master diagnostician.

An important focus of our work includes the interpretability of the deep learning models used. An “attention map” of each prediction shows the important data points considered by the models as they make that prediction. We show an example as a proof-of-concept and see this as an important part of what makes predictions useful for clinicians.
A deep learning model was used to render a prediction 24 hours after a patient was admitted to the hospital. The timeline (top of figure) contains months of historical data and the most recent data is shown enlarged in the middle. The model "attended" to information highlighted in red that was in the patient's chart to "explain" its prediction. In this case-study, the model highlighted pieces of information that make sense clinically. Figure from our paper.
What does this mean for patients and clinicians?
The results of this work are early and on retrospective data only. Indeed, this paper represents just the beginning of the work that is needed to test the hypothesis that machine learning can be used to make healthcare better. Doctors are already inundated with alerts and demands on their attention — could models help physicians with tedious, administrative tasks so they can better focus on the patient in front of them or ones that need extra attention? Can we help patients get high-quality care no matter where they seek it? We look forward to collaborating with doctors and patients to figure out the answers to these questions and more.

Source: Google AI Blog


An Augmented Reality Microscope for Cancer Detection


Applications of deep learning to medical disciplines including ophthalmology, dermatology, radiology, and pathology have recently shown great promise to increase both the accuracy and availability of high-quality healthcare to patients around the world. At Google, we have also published results showing that a convolutional neural network is able to detect breast cancer metastases in lymph nodes at a level of accuracy comparable to a trained pathologist. However, because direct tissue visualization using a compound light microscope remains the predominant means by which a pathologist diagnoses illness, a critical barrier to the widespread adoption of deep learning in pathology is the dependence on having a digital representation of the microscopic tissue.

Today, in a talk delivered at the Annual Meeting of the American Association for Cancer Research (AACR), with an accompanying paper “An Augmented Reality Microscope for Real-time Automated Detection of Cancer” (under review), we describe a prototype Augmented Reality Microscope (ARM) platform that we believe can possibly help accelerate and democratize the adoption of deep learning tools for pathologists around the world. The platform consists of a modified light microscope that enables real-time image analysis and presentation of the results of machine learning algorithms directly into the field of view. Importantly, the ARM can be retrofitted into existing light microscopes found in hospitals and clinics around the world using low-cost, readily-available components, and without the need for whole slide digital versions of the tissue being analyzed.
Modern computational components and deep learning models, such as those built upon TensorFlow, will allow a wide range of pre-trained models to run on this platform. As in a traditional analog microscope, the user views the sample through the eyepiece. A machine learning algorithm projects its output back into the optical path in real-time. This digital projection is visually superimposed on the original (analog) image of the specimen to assist the viewer in localizing or quantifying features of interest. Importantly, the computation and visual feedback updates quickly — our present implementation runs at approximately 10 frames per second, so the model output updates seamlessly as the user scans the tissue by moving the slide and/or changing magnification.
Left: Schematic overview of the ARM. A digital camera captures the same field of view (FoV) as the user and passes the image to an attached compute unit capable of running real-time inference of a machine learning model. The results are fed back into a custom AR display which is inline with the ocular lens and projects the model output on the same plane as the slide. Right: A picture of our prototype which has been retrofitted into a typical clinical-grade light microscope.
In principle, the ARM can provide a wide variety of visual feedback, including text, arrows, contours, heatmaps, or animations, and is capable of running many types of machine learning algorithms aimed at solving different problems such as object detection, quantification, or classification.

As a demonstration of the potential utility of the ARM, we configured it to run two different cancer detection algorithms: one that detects breast cancer metastases in lymph node specimens, and another that detects prostate cancer in prostatectomy specimens. These models can run at magnifications between 4-40x, and the result of a given model is displayed by outlining detected tumor regions with a green contour. These contours help draw the pathologist’s attention to areas of interest without obscuring the underlying tumor cell appearance.
Example view through the lens of the ARM. These images show examples of the lymph node metastasis model with 4x, 10x, 20x, and 40x microscope objectives.
While both cancer models were originally trained on images from a whole slide scanner with a significantly different optical configuration, the models performed remarkably well on the ARM with no additional re-training. For example, the lymph node metastasis model had an area-under-the-curve (AUC) of 0.98 and our prostate cancer model had an AUC of 0.96 for cancer detection in the field of view (FoV) when run on the ARM, only slightly decreased performance than obtained on WSI. We believe it is likely that the performance of these models can be further improved by additional training on digital images captured directly from the ARM itself.

We believe that the ARM has potential for a large impact on global health, particularly for the diagnosis of infectious diseases, including tuberculosis and malaria, in developing countries. Furthermore, even in hospitals that will adopt a digital pathology workflow in the near future, ARM could be used in combination with the digital workflow where scanners still face major challenges or where rapid turnaround is required (e.g. cytology, fluorescent imaging, or intra-operative frozen sections). Of course, light microscopes have proven useful in many industries other than pathology, and we believe the ARM can be adapted for a broad range of applications across healthcare, life sciences research, and material science. We’re excited to continue to explore how the ARM can help accelerate the adoption of machine learning for positive impact around the world.


Source: Google AI Blog


Making Healthcare Data Work Better with Machine Learning


Over the past 10 years, healthcare data has moved from being largely on paper to being almost completely digitized in electronic health records. But making sense of this data involves a few key challenges. First, there is no common data representation across vendors; each uses a different way to structure their data. Second, even sites that use the same vendor may differ significantly, for example, they typically use different codes for the same medication. Third, data can be spread over many tables, some containing encounters, some containing lab results, and yet others containing vital signs.

The Fast Healthcare Interoperability Resources (FHIR) standard addresses most of these challenges: it has a solid yet extensible data-model, is built on established Web standards, and is rapidly becoming the de-facto standard for both individual records and bulk-data access. But to enable large-scale machine learning, we needed a few additions: implementations in various programming languages, an efficient way to serialize large amounts of data to disk, and a representation that allows analyses of large datasets.

Today, we are happy to open source a protocol buffer implementation of the FHIR standard, which addresses these issues. The current version supports Java, and support for C++, Go, and Python will follow soon. Support for profiles will follow shortly as well, plus tools to help convert legacy data into FHIR.

FHIR as the core data model
Over the past few years, as we’ve been partnering with academic medical centers to apply machine learning to de-identified medical records, it became clear that we needed to address the complexity of healthcare data head-on. Indeed, for machine learning to be effective on medical data, we need a holistic view of what happened to each patient over time. And as a bonus, we want a data representation that is directly applicable in a clinical setting.

While the FHIR standard addresses most of our needs, making healthcare data substantially easier to manage than “legacy” data structures and enabling large-scale machine-learning independent of vendors, we believe the introduction of protocol buffers can help both application developers and (machine-learning) researchers use FHIR.

Current release of protocol buffers
We’ve taken care to make our protocol buffer representation suitable for both programmatic access and database queries. One of the provided examples shows how to upload FHIR data into Google Cloud BigQuery and have it available for querying, and we are adding other examples that upload directly from bulk data export. Our protocol buffers adhere to the FHIR standard (they are in fact auto-generated from it) but make for more elegant queries.

The current release does not yet include support for training TensorFlow models, but keep an eye out for future updates. We aim to open-source as much as possible of our recent work, to help make our research more reproducible and applicable to real-world scenarios. Furthermore, we are working closely with our colleagues in Google Cloud on more tools for managing healthcare data at scale.

Acknowledgements
We enjoyed great discussions and helpful feedback from the FHIR community, including Grahame Grieve, Ewout Kramer, Josh Mandel and others. Thanks to our colleagues at DeepMind, the Google Brain team and our academic collaborators.

Assessing Cardiovascular Risk Factors with Computer Vision


Heart attacks, strokes and other cardiovascular (CV) diseases continue to be among the top public health issues. Assessing this risk is critical first step toward reducing the likelihood that a patient suffers a CV event in the future. To do this assessment, doctors take into account a variety of risk factors — some genetic (like age and sex), some with lifestyle components (like smoking and blood pressure). While most of these factors can be obtained by simply asking the patient, others factors, like cholesterol, require a blood draw. Doctors also take into account whether or not a patient has another disease, such as diabetes, which is associated with significantly increased risk of CV events.

Recently, we’ve seen many examples [1–4] of how deep learning techniques can help to increase the accuracy of diagnoses for medical imaging, especially for diabetic eye disease. In “Prediction of Cardiovascular Risk Factors from Retinal Fundus Photographs via Deep Learning,” published in Nature Biomedical Engineering, we show that in addition to detecting eye disease, images of the eye can very accurately predict other indicators of CV health. This discovery is particularly exciting because it suggests we might discover even more ways to diagnose health issues from retinal images.

Using deep learning algorithms trained on data from 284,335 patients, we were able to predict CV risk factors from retinal images with surprisingly high accuracy for patients from two independent datasets of 12,026 and 999 patients. For example, our algorithm could distinguish the retinal images of a smoker from that of a non-smoker 71% of the time. In addition, while doctors can typically distinguish between the retinal images of patients with severe high blood pressure and normal patients, our algorithm could go further to predict the systolic blood pressure within 11 mmHg on average for patients overall, including those with and without high blood pressure.
LEFT: image of the back of the eye showing the macula (dark spot in the middle), optic disc (bright spot at the right), and blood vessels (dark red lines arcing out from the bright spot on the right). RIGHT: retinal image in gray, with the pixels used by the deep learning algorithm to make predictions about the blood pressure highlighted in shades of green (heatmap). We found that each CV risk factor prediction uses a distinct pattern, such as blood vessels for blood pressure, and optic disc for other predictions.
In addition to predicting the various risk factors (age, gender, smoking, blood pressure, etc) from retinal images, our algorithm was fairly accurate at predicting the risk of a CV event directly. Our algorithm used the entire image to quantify the association between the image and the risk of heart attack or stroke. Given the retinal image of one patient who (up to 5 years) later experienced a major CV event (such as a heart attack) and the image of another patient who did not, our algorithm could pick out the patient who had the CV event 70% of the time. This performance approaches the accuracy of other CV risk calculators that require a blood draw to measure cholesterol.

More importantly, we opened the “black box” by using attention techniques to look at how the algorithm was making its prediction. These techniques allow us to generate a heatmap that shows which pixels were the most important for a predicting a specific CV risk factor. For example, the algorithm paid more attention to blood vessels for making predictions about blood pressure, as shown in the image above. Explaining how the algorithm is making its prediction gives doctor more confidence in the algorithm itself. In addition, this technique could help generate hypotheses for future scientific investigations into CV risk and the retina.

At the broadest level, we are excited about this work because it may represent a new method of scientific discovery. Traditionally, medical discoveries are often made through a sophisticated form of guess and test — making hypotheses from observations and then designing and running experiments to test the hypotheses. However, with medical images, observing and quantifying associations can be difficult because of the wide variety of features, patterns, colors, values and shapes that are present in real images. Our approach uses deep learning to draw connections between changes in the human anatomy and disease, akin to how doctors learn to associate signs and symptoms with the diagnosis of a new disease. This could help scientists generate more targeted hypotheses and drive a wide range of future research.

With these promising results, a lot of scientific work remains. Our dataset had many images labeled with smoking status, systolic blood pressure, age, gender and other variables, but it only had a few hundred examples of CV events. We look forward to developing and testing our algorithm on larger and more comprehensive datasets. To make this useful for patients, we will be seeking to understand the effects of interventions such as lifestyle changes or medications on our risk predictions and we will be generating new hypotheses and theories to test.


References

[1] Gulshan, V. et al. Development and Validation of a Deep Learning Algorithm for Detection of Diabetic Retinopathy in Retinal Fundus Photographs. JAMA 316, 2402–2410 (2016).

[2] Ting, D. S. W. et al. Development and Validation of a Deep Learning System for Diabetic Retinopathy and Related Eye Diseases Using Retinal Images From Multiethnic Populations With Diabetes. JAMA 318, 2211–2223 (2017).

[3] Esteva, A. et al. Dermatologist-level classification of skin cancer with deep neural networks. Nature (2017). doi:10.1038/nature21056

[4] Ehteshami Bejnordi, B. et al. Diagnostic Assessment of Deep Learning Algorithms for Detection of Lymph Node Metastases in Women With Breast Cancer. JAMA 318, 2199–2210 (2017).