Tag Archives: Announcements

Now, you can automatically document your API with Cloud Endpoints


With Cloud Endpoints, our service for building, deploying and managing APIs on Google Cloud Platform (GCP), you get to focus on your API’s logic and design, and our team handles everything else. Today, we’re expanding “everything else” and announcing new developer portals where developers can learn how to interact with your API.

Developer portals are the first thing your users see when they try to use your API, and are an opportunity to answer many of their questions: How do I evaluate the API? How do I get working code that calls the API? And for you, the API developer, how do you keep this documentation up-to-date as your API develops and changes over time?

Much like with auth, rate-limiting and monitoring, we know you prefer to focus on your API rather than on documentation. We think it should be easy to stand up a developer portal that’s customized with your branding and content, and that requires minimal effort to keep its contents fresh.

Here’s an example of a developer portal for the Swagger Petstore (YAML):

The portal includes, from left to right, the list of methods and resources, any custom pages that the API developer has added, details of the individual API method and an interactive tool to try out the API live!

If you’re already using Cloud Endpoints, you can start creating developer portals immediately by signing up for this alpha. The portal will always be up-to-date; any specification you push with gcloud also gets pushed to the developer portal. From the portal, you can browse the documentation, try the APIs interactively alongside the docs, and share the portal with your team. You can point your custom domain at it, for which we provision an SSL certificate, and add your own pages for content such as tutorials and guides. And perhaps the nicest thing is that this portal works out of the box for both gRPC and OpenAPI—so your docs are always up-to-date, regardless of which flavor of APIs you use.

Please reach out to our team if you’re interested in testing out Cloud Endpoints developer portals. Your feedback will help us shape the product and prioritize new features over the coming months.

Introducing Stackdriver APM and Stackdriver Profiler

Distributed tracing, debugging, and profiling for your performance-sensitive applications


Like all developers that care about their users, you’re probably obsessed with how your applications perform and how you can make them faster and more reliable. Monitoring and logging software like Stackdriver Monitoring and Logging provide a first line of defense, alerting you to potential infrastructure or security problems, but what if the performance problem lies deeper than that, in your code?

Here at Google, we’re developers too, and we know that tracking down performance problems in your code can be hard—particularly if the application is live. Today we’re announcing new products that offer the same Application Performance Management (APM) capabilities that we use internally to monitor and tune the performance of our own applications. These tools are powerful, can be used on applications running anywhere, and are priced so that virtually any developer can make use of them.

The foundation of our APM tooling is two existing products, Stackdriver Trace and Debugger, which give you the power to analyze and debug applications while they're running in production, without impacting user experience in any way.

On top of that, we’re introducing Stackdriver Profiler to our APM toolkit, which lets you profile and explore how your code actually executes in production, to optimize performance and reduce cost of computation.

We’re also announcing integrations between Stackdriver Debugger and GitHub Enterprise and GitLab, adding to our existing code mirroring functionality for GitHub, Bitbucket, Google Cloud Repositories, as well as locally-stored source code.

All of these tools work with code and applications that run on any cloud or even on-premises infrastructure, so no matter where you run your application, you now have a consistent, accessible APM toolkit to monitor and manage the performance of your applications.

Introducing Stackdriver Profiler


Production profiling is immensely powerful, and lets you gauge the impact of any function or line of code on your application’s overall performance. If you don’t analyze code execution in production, unexpectedly resource-intensive functions increase the latency and cost of web services every day, without anyone knowing or being able to do anything about it.

At Google, we continuously profile our applications to identify inefficiently written code, and these tools are used every day across the company. Outside of Google, however, these techniques haven’t been widely adopted by service developers, for a few reasons:
  1. While profiling client applications locally can yield useful results, inspecting service execution in development or test environments does not. 
  2. Profiling production service performance through traditional methods can be difficult and risks causing slowdowns for customers. 
  3. Existing production profiling tools can be expensive, and there’s always the option of simply scaling up a poorly performing service with more computing power (for a price).
Stackdriver Profiler addresses all of these concerns:
  1. It analyzes code execution across all environments. 
  2. It runs continually and uses statistical methods to minimize impact on targeted codebases.
  3. It makes it more cost-effective to identify and remediate your performance problems rather than scaling up and increasing your monthly bill. 
Stackdriver Profiler collects data via lightweight sampling-based instrumentation that runs across all of your application’s instances. It then displays this data on a flame chart, presenting the selected metric (CPU time, wall time, RAM used, contention, etc.) for each function on the horizontal axis, with the function call hierarchy on the vertical axis.
Early access customers have used Stackdriver Profiler to improve performance and reduce their costs.
"We used Stackdriver Profiler as part of an effort to improve the scalability of our services. It helped us to pinpoint areas we can optimize and reduce CPU time, which means a lot to us at our scale." 
 Evan Yin, Software Engineer, Snap Inc. 
 "Profiler helped us identify very slow parts of our code which were hidden in the middle of large and complex batch processes. We run hundreds of batches every day, each with different data sets and configurations, which makes it hard to track down performance issues related to client-specific configurations. Stackdriver Profiler was super helpful." 
Nicolas Fonrose, CEO, Teevity 

 Stackdriver Profiler is now in public beta, available for everyone. It supports:

Unearth tricky code problems with Stackdriver Debugger

Stackdriver Debugger provides a familiar breakpoint-style debugging process for production applications, with no negative customer impact.


Additionally, Stackdriver Debugger’s logpoints feature allows you to add log statements to production apps, instantly, without having to redeploy them.
Debugger simplifies root-cause analysis for hard-to-find production code issues. Without Debugger, finding these kinds of problems usually requires manually adding new log statements to application code, redeploying any affected services, analyzing logs to determine what is actually going wrong, and finally, either discovering and fixing the issue or adding additional log statements and starting the cycle all over again. Debugger reduces this iteration cycle to zero.

Stackdriver Debugger is generally available and supports the following languages and platforms:

Reduce latency with Stackdriver Trace


Stackdriver Trace allows you to analyze how customer requests propagate through your application, and is immensely useful for reducing latency and performing root cause analysis. Trace continuously samples requests, automatically captures their propagation and latency, presents the results for display, and finds any latency-related trends. You can also add custom metadata to your traces for deeper analysis.
Trace is based off of Google’s own Dapper, which pioneered the concept of distributed tracing and which we still used every day to make our services faster and more reliable.

We’re also adding multi-project support to Trace in the coming weeks, a long-requested feature that will let you view complete traces across multiple GCP projects at the same time. Expect to hear more about this very soon.

Stackdriver Trace is generally available and offers the following platform and language support:

Get started today with Stackdriver APM


Whether your application is just getting off the ground, or live and in production, using APM tools to monitor and tune its performance can be a game changer. To get started with Stackdriver APM, simply link the appropriate instrumentation library for each tool to your app and start gathering telemetry for analysis. Stackdriver Debugger is currently free, as is the beta of Stackdriver Profiler. Stackdriver Trace includes a large monthly quota of free trace submissions.

To learn more, see the Stackdriver Profiler, Debugger and Trace documentation

Introducing Cloud Text-to-Speech powered by DeepMind WaveNet technology


Many Google products (e.g., the Google Assistant, Search, Maps) come with built-in high-quality text-to-speech synthesis that produces natural sounding speech. Developers have been telling us they’d like to add text-to-speech to their own applications, so today we’re bringing this technology to Google Cloud Platform with Cloud Text-to-Speech.

You can use Cloud Text-to-Speech in a variety of ways, for example:
  • To power voice response systems for call centers (IVRs) and enabling real-time natural language conversations 
  • To enable IoT devices (e.g., TVs, cars, robots) to talk back to you 
  •  To convert text-based media (e.g., news articles, books) into spoken format (e.g., podcast or audiobook)
Cloud Text-to-Speech lets you choose from 32 different voices from 12 languages and variants. Cloud Text-to-Speech correctly pronounces complex text such as names, dates, times and addresses for authentic sounding speech right out of the gate. Cloud Text-to-Speech also allows you to customize pitch, speaking rate, and volume gain, and supports a variety of audio formats, including MP3 and WAV.

Rolling in the DeepMind


In addition, we're excited to announce that Cloud Text-to-Speech also includes a selection of high-fidelity voices built using WaveNet, a generative model for raw audio created by DeepMind. WaveNet synthesizes more natural-sounding speech and, on average, produces speech audio that people prefer over other text-to-speech technologies.

In late 2016, DeepMind introduced the first version of WaveNet  a neural network trained with a large volume of speech samples that's able to create raw audio waveforms from scratch. During training, the network extracts the underlying structure of the speech, for example which tones follow one another and what shape a realistic speech waveform should have. When given text input, the trained WaveNet model generates the corresponding speech waveforms, one sample at a time, achieving higher accuracy than alternative approaches.

Fast forward to today, and we're now using an updated version of WaveNet that runs on Google’s Cloud TPU infrastructure.The new, improved WaveNet model generates raw waveforms 1,000 times faster than the original model, and can generate one second of speech in just 50 milliseconds. In fact, the model is not just quicker, but also higher-fidelity, capable of creating waveforms with 24,000 samples a second. We’ve also increased the resolution of each sample from 8 bits to 16 bits, producing higher quality audio for a more human sound.
With these adjustments, the new WaveNet model produces more natural sounding speech. In tests, people gave the new US English WaveNet voices an average mean-opinion-score (MOS) of 4.1 on a scale of 1-5 — over 20% better than for standard voices and reducing the gap with human speech by over 70%. As WaveNet voices also require less recorded audio input to produce high quality models, we expect to continue to improve both the variety as well as quality of the WaveNet voices available to Cloud customers in the coming months.
Cloud Text-to-Speech is already helping multiple customers deliver a better experience to their end users. Customers include Cisco and Dolphin ONE.
“As the leading provider of collaboration solutions, Cisco has a long history of bringing the latest technology advances into the enterprise. Google’s Cloud Text-to-Speech has enabled us to achieve the natural sound quality that our customers desire."  
 Tim Tuttle, CTO of Cognitive Collaboration, Cisco
“Dolphin ONE’s Calll.io telephony platform offers connectivity from a multitude of devices, at practically any location. We’ve integrated Cloud Text-to-Speech into our products and allow our users to create natural call center experiences. By using Google Cloud’s machine learning tools, we’re instantly delivering cutting-edge technology to our users.” 
Jason Berryman, Dolphin ONE

Get started today


With Cloud Text-to-Speech, you’re now a few clicks away from one of the most advanced speech technologies in the world. To learn more, please visit the documentation or our pricing page. To get started with our public beta or try out the new voices, visit the Cloud Text-to-Speech website.

Kubernetes 1.10: an insider take on what’s new


The Kubernetes community today announced the release of Kubernetes 1.10, just a few weeks since it graduated from CNCF incubation. As a founding member of the CNCF and the primary authors of Kubernetes, Google continues to be the largest contributor to the project in this release, as well as reviewer of contributions and mentor to community members. At Google we believe growing a vibrant community helps deliver a platform that's open and portable, so users benefit by being able to run their workloads consistently anywhere they want.

In this post, we highlight a few elements of the 1.10 release that we helped contribute to.

Container storage plugins


The Kubernetes implementation of the Container Storage Interface (CSI) has moved to beta in Kubernetes 1.10. CSI enables third-party storage providers to develop solutions outside of the core Kubernetes codebase. Because these plugins are decoupled from the core codebase, installing them is as easy as deploying a Pod to your cluster.

Saad Ali (chair of SIG-Storage) is a primary author of both the CSI specification and Kubernetes' implementation of the specification. "Kubernetes provides a powerful volume plugin system that makes it easy to consume different types of block and file storage,” he explains. “However, adding support for new volume plugins has been challenging. With the adoption of the Container Storage Interface, the Kubernetes volume layer is finally becoming truly extensible. Third-parties can now write and deploy plugins exposing new storage systems in Kubernetes without ever having to touch the core Kubernetes code. Ultimately this will give Kubernetes and Kubernetes Engine users more options for the storage that backs their stateful containerized workloads."

Custom resolver configuration


A key feature of Kubernetes is being able to refer to your Services by a simple DNS name, rather than deal with the complexities of an external discovery service. While this works great for internal names, some Kubernetes Engine customers reported that it caused an overload on the internal DNS server for workloads that primarily look up external names.

Zihong Zheng implemented a feature to allow you to customize the resolver on a per-pod basis. "Kubernetes users can now avoid this trade-off if they want to, so that neither ease of use nor flexibility are compromised," he says. Building this upstream means that the feature is available to Kubernetes users wherever they run.


Device plugins and GPU support


Also moving to beta in 1.10 are Device Plugins, an extension mechanism that lets device vendors advertise their resources to the kubelet without changing Kubernetes core code. A primary use case for device plugins is connecting GPUs to Kubernetes.

Jiaying Zhang is Google's feature lead for device plugins. She worked closely with device vendors to understand their needs, identify common requirements, come up with an execution plan, and work with the OSS community to build a production-ready system. Kubernetes Engine support for GPUs is built on the Device Plugins framework, and our early access customers influenced the feature as it moved to production readiness in Kubernetes 1.10.

API extensions


Googler Daniel Smith (co-chair of SIG API Machinery) first proposed the idea of API extension just a couple months after Kubernetes was open-sourced. We now have two methods for extending the Kubernetes API: Custom Resource Definitions (formerly Third-Party Resources), and API Aggregation, which moves to GA in Kubernetes 1.10. Aggregation, which is used to power ecosystem extensions like the Service Catalog and Metrics Server, allows independently built API server binaries to be hosted through the Kubernetes master, with the same authorization, authentication and security configurations on both. “We’ve been running the aggregation layer in every Google Kubernetes Engine cluster since 1.7 without difficulties, so it’s clearly time to promote this mechanism to GA,” says Daniel. "We’re working to provide a complete extensibility solution, which involves getting both CRDs and admission control webhooks to GA by the end of the year.”

Use Kubernetes to run your Spark workloads


Google's contributions to the open Kubernetes ecosystem extend farther than the Kubernetes project itself. Anirudh Ramanathan (chair of SIG-Big Data) led the upstream implementation of native Kubernetes support in Apache Spark 2.3, a headline feature in that release. Along with Yinan Li, we are hard at work on a Spark Operator, which lets you run Spark workloads in an idiomatic Kubernetes fashion.

Paired with the priority and preemption feature implemented by Bobby Salamat (chair of SIG-Scheduling) and David Oppenheimer (co-author of the Borg paper) you'll soon be able to increase the efficiency of your cluster by using Spark to schedule batch work to run only when the cluster has free resources.

Growing the community


We’re also heavily invested in mentoring for the Kubernetes project. Outreachy is an internship program that helps traditionally underrepresented groups learn and grow tech skills by contributing to open-source projects. Kubernetes' SIG-CLI participated in Outreachy over the 1.10 timeframe with Google's Antoine Pelisse as mentor. With his help, Yolande Amate from Cameroon and Ellen Korbes from Brazil took on the challenge of making improvements to the "kubectl create" and "kubectl set" commands.

With the internship over, Ellen is now a proud Kubernetes project member (and has written a series of blog posts about her path to contribution), and Yolande continues to submit PRs and is working toward her membership.


1.10 available soon on Kubernetes Engine


This latest version of Kubernetes will start rolling out to alpha clusters on Kubernetes Engine in early April. If you want to be among the first to access it on your production clusters, join our early access program today.

If you haven’t tried GCP and Kubernetes Engine before, you can quickly get started with our $300 free credits.

Kubernetes Engine Private Clusters now available in beta


Google Cloud Platform (GCP) employs several security measures to help ensure authenticity, privacy and integrity of your data in transit. As enterprise users turn to Google Kubernetes Engine (GKE) as their preferred deployment model, they too require the same levels of privacy for their data.

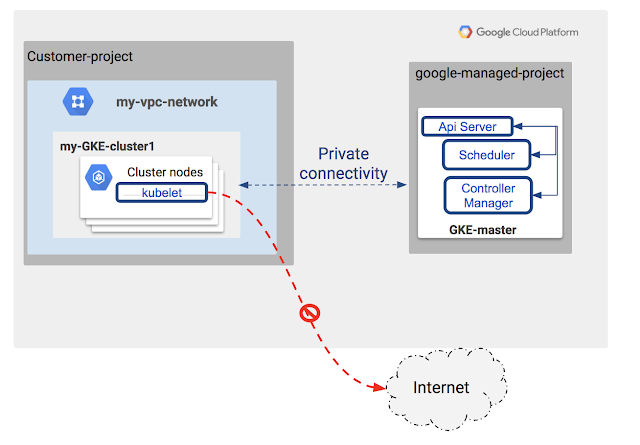
Today, we're excited to announce the beta launch of Kubernetes Engine Private Clusters. Now, Kubernetes Engine allows you to deploy clusters privately as part of the Google Virtual Private Cloud (VPC), which provides an isolated boundary where you can securely deploy your applications. With Kubernetes Engine Private Clusters, your cluster’s nodes can only be accessed from within the trusted VPC. In addition, private clusters protect the master node from unwanted access, as the master is completely blocked from access from the internet by default.

In the Kubernetes Engine Private Cluster model, your nodes have access to the rest of your VPC private deployments, including private access to Google managed services such as gcr.io, Google Cloud Storage and Google BigQuery. Access to the internet isn’t possible unless you set up additional mechanisms such as a NAT gateway.

Kubernetes Engine Private Clusters greatly simplify PCI-DSS compliance of your deployments, by limiting how a cluster can be reached from outside of a private network.

Let's take a closer look at how Kubernetes Engine Private Clusters fit into GCP’s private VPC model.

Get started with Private Clusters on Kubernetes Engine


The following tutorial highlights how you can enable Private Clusters for your deployments. In this private cluster model, the Kubernetes Engine cluster nodes are allocated private IP addresses and the master is protected from internet access. As you can see in the example below, you enable a Kubernetes Engine Private Cluster at cluster creation time, selecting the private IP range within your RFC 1918 IP space to use for your master, nodes, pods and services.

Note that you must deploy Kubernetes Engine Private Clusters with IP Aliases enabled. It also requires cluster version 1.8.5 or later.

The following diagram displays the internals of private clusters:

The fastest way to get started is to use the UI during cluster creation:
Alternatively, you can also create your private cluster with the GCP gcloud CLI:

# Create a Private Cluster with IP Alias auto-subnetwork)
gcloud beta container clusters create  --project=<project_id>>
--zone= --private-cluster --master-ipv4-cidr= 
--enable-ip-alias --create-subnetwork=""</master_cidr_block></zone></project_id></cluster></code>

The Master Authorized Network firewall protects access to the Kubernetes Engine master. When Kubernetes Engine Private Clusters is enabled, it's set to “default deny,” making your master inaccessible from the public internet at creation time.


Try it out today!

Create a Kubernetes Engine Private Cluster today. Stay tuned for more updates in this space as we continue to invest in Kubernetes Engine to ensure customers get defense-in-depth security features.

Interested in optimal load balancing?


Do you want to get access to a more container-native load balancing approach in Kubernetes Engine? Sign up here!

Building trust through Access Transparency


Auditability ranks at the top of cloud adopters’ security requirements. According to an MIT Sloan Management Review survey of more than 500 IT and business executives, 87% of respondents cited auditability as an important factor in evaluating cloud security—second only to a provider’s ability to prevent data compromises. While Google’s Cloud Audit Logging and similar products help answer the question of which of your administrators did what, where, when and why on your cloud objects, you’ve traditionally lost this audit trail once support is engaged. This is why we’re pleased to introduce Access Transparency, a new logs product unique to Google Cloud Platform (GCP) that provides an audit trail of actions taken by Google Support and Engineering when they interact with your data and system configurations on Google Cloud.

Access Transparency logs are available in beta for Compute Engine, App Engine, Cloud Identity and Access Management, Cloud Key Management Service, Cloud Storage and Persistent Disks— with more services becoming available throughout the year. Together, Cloud Audit Logs and Access Transparency Logs provide a more comprehensive view of admin activity in your cloud deployment.

Expanding your visibility with Access Transparency 


In the limited situations that access by Google employees does occur, Access Transparency logs are generated in near-real time and delivered to your Stackdriver Logging console in the same manner as Cloud Audit Logs. The logs not only show what resources were accessed and the operations performed, they also show the justification for that action. For example, they may include the ticket number you filed with support asking for help.
click to enlarge

You can also choose to export your Access Transparency logs into BigQuery and Cloud Storage, or to other tools in your existing audit pipeline through Cloud Pub/Sub. This allows you to integrate with your existing audit pipeline, where you may already be exporting your Cloud Audit Logs. You can then audit your Access Transparency logs with a combination of automated and manual review, in the same way you would with audit logs of your own internal activity.

Enabled by industry-leading data protection controls 


At Google Cloud, our philosophy is that our customers own their data, and we do not access that data for any reason other than those necessary to fulfill our contractual obligations to you. Technical controls require valid business justifications for any access to your content by support or engineering personnel. These structured justifications are used to generate your Access Transparency logs. Google also performs regular audits of accesses by administrators as a check on the effectiveness of our controls.

This system is built around limiting what employees can do, with multi-step processes to minimize the likelihood of misjudgment, and transparency to allow review of actions. Feedback loops also exist between Google’s audits and customer feedback to continue improving our processes and further limit the need to access your data in order to solve your problems.

Getting started with Access Transparency 


Access Transparency is available at no additional charge to customers with Platinum or Gold Support coverage, however spaces in our beta are limited. To apply for access, use our signup form. To find out more about Access Transparency, read the Access Transparency Documentation, or contact your dedicated support representative.

Access Transparency also continues to be available through SAP’s Data Custodian solution, which uses Access Transparency and other logs to support a managed GRC solution for your GCP deployments. For more information on Data Custodian, visit the SAP website.

Introducing new ways to protect and control your GCP services and data


They say security is a process, not a destination, and that certainly rang true as we prepared for today’s CEO Security Forum in New York, where we’re making more than 20 security announcements across the Google Cloud portfolio.

When it comes to Google Cloud Platform (GCP), our goal is to continuously improve on the strong foundation that we’ve built over the years, and help you build out a secure, scalable environment. Here’s an overview of our GCP-related news. Stay tuned over the coming days for deeper dives into some of these new products.

1. Keep sensitive data private with VPC Service Controls Alpha


If your organization is looking to take advantage of the fully managed GCP technologies for big data analytics, data processing and storage, but has hesitated to put sensitive data in the cloud outside your secured network, our new VPC Service Controls provide an additional layer of protection to help keep your data private.

Currently in alpha, VPC Service Controls create a security perimeter around data stored in API-based GCP services such as Google Cloud Storage, BigQuery and Bigtable. This helps mitigate data exfiltration risks stemming from stolen identities, IAM policy misconfigurations, malicious insiders and compromised virtual machines.

With this managed service, enterprises can configure private communication between cloud resources and hybrid VPC networks using Cloud VPN or Cloud Dedicated Interconnect. By expanding perimeter security from on-premise networks to data stored in GCP services, enterprises can feel confident about storing their data in the cloud and accessing it from an on-prem environment or cloud-based VMs.

VPC Service Controls also take security a step further with context-aware access control for your cloud resources using the Access Context Manager feature. Enterprises can create granular access control policies in Access Context Manager based on attributes like user location and IP address. These policies help ensure the appropriate security controls are in place when granting access to cloud resources from the internet.

Google Cloud is the first cloud provider to offer virtual security perimeters for API-based services with simplicity, speed and flexibility that far exceed what most organizations can achieve in a physical, on-premises environment.

Get started by signing up for the upcoming VPC Service Controls beta.

2. Get insight into data and application risk with Cloud Security Command Center Alpha


As organizations entrust more applications to the cloud, it can be tough to understand the extent of your cloud assets and the risks against them. The new Cloud Security Command Center (Cloud SCC), currently in alpha, lets you view and monitor an inventory of your cloud assets, scan storage systems for sensitive data, detect common web vulnerabilities and review access rights to your critical resources—all from a single, centralized dashboard.

Cloud SCC provides deep views into the security status and health of GCP services such as App Engine, Compute Engine, Cloud Storage, and Cloud Datastore. It integrates with the DLP API to help identify sensitive information, and with Google Cloud Security Scanner to uncover vulnerabilities such as cross-site-scripting (XSS) and Flash injection. Use it to manage access control policies, receive alerts about unexpected changes through an integration with Forseti, the open-source GCP security toolkit, and detect threats and suspicious activity with Google anomaly detection as well as security partners such as Cloudflare, CrowdStrike, Dome9, Palo Alto Networks, Qualys and RedLock.

Get started by signing up for the Cloud SCC alpha program.

3. Expand Your visibility with Access Transparency


Trust is paramount when choosing a cloud provider. We want to be as open and transparent as possible, allowing customers to see what happens to their data. Now, with Access Transparency, we’ll provide you with an audit log of authorized administrative accesses by Google Support and Engineering, as well as justifications for those accesses, for many GCP services, and we’ll be adding more throughout the year. With Access Transparency, we can continue to maintain high performance and reliability for your environment while remaining accountable to the trust you place in our service.

Access Transparency logs are generated in near-real time, and appear in your Stackdriver Logging console in the same way that your Cloud Audit Logs do, with the same protections you would expect from audit-grade logs. You can export Access Transparency logs into BigQuery or Cloud Storage for storage and archiving, or via PubSub into your existing audit pipeline or SIEM tooling for further investigation and review.

The combination of Google Cloud Audit Logs and Access Transparency logs gives you a more comprehensive view into administrative activity in your GCP environment.

To learn more about Access Transparency, visit the product page, where you can find out more and sign up for the beta program.

4. Avoid Denial of Service with Cloud Armor


If you run internet-facing services or apps, you have a tough job: quickly and responsively serving traffic to your end users, while simultaneously protecting against malicious attacks trying to take your services down. Here at Google, we’re no stranger to this phenomenon, and so today, we’re announcing Cloud Armor, a Distributed Denial of Service (DDoS) and application defense service that’s based on the same technologies and global infrastructure that we use to protect services like Search, Gmail and YouTube.

Global HTTP(S) Load Balancing provides built-in defense against Infrastructure DDoS attacks. No additional configuration, other than to configure load balancing, is required to activate this DDoS defense. Cloud Armor works with Cloud HTTP(S) Load Balancing, provides IPv4 and IPv6 whitelisting/blacklisting, defends against application-aware attacks such as cross-site scripting (XSS) and SQL injection (SQLi), and delivers geography-based access control.

A sophisticated rules language and global enforcement engine underpin Cloud Armor, enabling you to create custom defenses, with any combination of Layer 3 to Layer 7 parameters, against multivector attacks (combination of two or more attack types). Cloud Armor gives you visibility into your blocked and allowed traffic by sending information to Stackdriver Logging about each incoming request and the action taken on that request by the Cloud Armor rule.

Learn more by visiting the Cloud Armor product page.

5. Discover, classify and redact sensitive data with the DLP API


Sensitive information is a fact of life. The question is—how do you identify it and help ensure it’s protected? Enter the Cloud Data Loss Prevention (DLP) API, a managed service that lets you discover, classify and redact sensitive information stored in your organization’s digital assets.

First announced last year, the DLP API is now generally available. And because the DLP API is, well, an API, you can use it on virtually any data source or business application, whether it’s on GCP services like Cloud Storage or BigQuery, a third-party cloud, or in your on-premises data center. Furthermore, you can use the DLP API to detect (and, just as importantly, redact) sensitive information in real-time, as well as in batch-mode against static datasets.

Our goal is to make the DLP API an extensible part of your security arsenal. Since it was first announced, we’ve added several new detectors, including one to identify service account credentials, as well as the ability to build your own detectors based on custom dictionaries, patterns and context rules.

Learn more by visiting the DLP API product page.

6. Provide simple, secure access for any user to cloud applications from any device with Cloud Identity


Last summer we announced Cloud Identity, a built-in service that allows organizations to easily manage users and groups who need access to GCP resources. Our new, standalone Cloud Identity product is a full Identity as a Service (IDaaS) solution that adds premium features such as enterprise security, application management and device management to provide enterprises with simple, secure access for any user to cloud applications from any device.

Cloud Identity enables and accelerates the use of cloud-centric applications and services, while offering capabilities to meet customer organizations where they are with their on-premise IAM systems and apps.

Learn more by visiting the Cloud Identity product page.

7. Extending the benefits of GCP security to U.S. federal, state and local government customers through FedRamp authorization


While Google Cloud goes to great lengths to document the security capabilities of our infrastructure and platforms, third-party validation always helps. We’re pleased to announce that GCP, and Google’s underlying common infrastructure, have received the FedRAMP Rev. 4 Provisional Authorization to Operate (P-ATO) at the Moderate Impact level from the FedRAMP Joint Authorization Board (JAB). GCP’s certification encompasses data centers in many countries, so customers can take advantage of this certification from multiple Google Cloud regions.

Agencies and federal contractors can request access to our FedRAMP package by submitting a FedRAMP Package Access Request Form.

8. Take advantage of new security partnerships

In addition to today’s security announcements, we’ve also been working with several security companies to offer additional solutions that complement GCP’s capabilities. You can read about these partnerships in more detail in our partnerships blog post.

Today we’re announcing new GCP partner solutions, including:
  • Dome9 has developed a compliance test suite for the Payment Card Industry Data Security Standard (PCI DSS) in the Dome9 Compliance Engine. 
  • Rackspace Managed Security provides businesses with fully managed security on top of GCP. 
  • RedLock’s Cloud 360 Platform is a cloud threat defense security and compliance solution that provides additional visibility and control for Google Cloud environments.
As always, we’re thrilled to be able to share with you the fruits of our experience running and protecting some of the world’s most popular web applications. And we’re honored that you’ve chosen to make GCP your home in the cloud. For more on today’s security announcements read our posts on the Google Cloud blog, the G Suite blog and the Connected Workspaces blog.

Expanding our Google Cloud security partnerships


As we discussed in today’s blog post, security is top of mind for many businesses as they move to the cloud. To help more businesses take advantage of the cloud’s security benefits, we’re working with several leading security providers to offer solutions that complement Google Cloud Platform’s capabilities, and enable customers to leverage their existing tools from these vendors in the cloud. These partner solutions cover a broad set of enterprise security needs, such as advanced threat prevention, compliance, container security, managed security services and more.

Today, we’re announcing new partnerships, new solutions by existing partners and new partner integrations in our Cloud Security Command Center (Cloud SCC), currently in alpha. Here’s a little more on what each of these partnerships will offer:

Auth0 offers the ability to secure cloud endpoints and seamlessly implement secure identity management into customer products and services. Whether the goal is to add additional authentication sources like social login, migrate users without requiring password resets or add multi-factor authentication, Auth0 provides a range of services to accomplish many identity-related tasks. Auth0’s platform supports multiple use cases (B2B, B2C, B2E, IoT, API) and integrates into existing tech stacks.

Check Point  can now secure multiple VPCs using a single CloudGuard security gateway to protect customer applications. A single CloudGuard gateway can monitor traffic in and out of more than one VPC network at any given time, providing a more efficient and scalable solution for running and securing workloads.

Cloudflare Web Application Firewall helps prevents attackers from compromising sensitive customer data, and helps protect customers from common vulnerabilities like SQL injection attacks, cross-site scripting and cross-site forgery. Additionally, integration with the Cloud Security Command CenterAlpha combines their intelligence with Google security and data risk insights to give customers a holistic view of their security posture.

Dome9 has developed a compliance test suite for the Payment Card Industry Data Security Standard (PCI DSS) in the Dome9 Compliance Engine. Using the Compliance Engine, Google Cloud customers can assess the compliance posture of their projects, identify risks and gaps, fix issues such as overly permissive firewall rules, enforce compliance requirements and demonstrate compliance in audits. The integration between the Dome9 Arc platform and the Cloud Security Command Center allows customers to consume and explore the results of assessments of the Dome9 Compliance Engine directly from Cloud SCC.

Fortinet provides scalable network protection for workloads in Google Cloud Platform (GCP). Its FortiGate provides next-generation firewall and advanced security, and its Fortinet Security Fabric integration enables single pane-of-glass visibility and policy across on-premises workloads and GCP for consistent hybrid cloud security.

Palo Alto Networks VM-Series Next Generation Firewall helps customers to securely migrate their applications and data to GCP, protecting them through application whitelisting and threat prevention policies. Native automation features allow developers and cloud architects to create “touchless” deployments and policy updates, effectively embedding the VM-Series into the application development workflow. The VM-Series on GCP can be configured to forward threat prevention, URL Filtering and WildFire logs of high severity to the Cloud Security Command Center to provide a consolidated view of a customer’s GCP security posture.

Qualys provides vulnerability assessments for Google Compute Engine instances. Users can get their vulnerability posture at a glance and drill down for details and actionable intelligence for the vulnerabilities identified. Customers can get this visibility within the Cloud Security Command Center by deploying the lightweight Qualys agents on the instances, baking them into images or deploying them directly into Compute Engine instances.

Rackspace Managed Security and Compliance Assistance provides additional active security on GCP to detect and respond to advanced cyber threats. Rackspace utilizes pre-approved actions to promptly remediate security incidents. It also complements the strategic planning, architectural guidance and 24x7x365 operational support available through Managed Services for GCP.

RedLock Cloud 360 Platform is a cloud threat defense security and compliance solution that provides additional visibility and control for GCP. RedLock collects and correlates disparate data sets from Google Cloud to determine the risk posture of a customer’s environment, then employs risk scoring algorithms to help prioritize and remediate the highest risks. Redlock’s integration with the Cloud Security Command Center provides customers with centralized visibility into security and compliance risks. As part of the integration, RedLock periodically scans a customer's Google Cloud environments and sends results pertaining to resource misconfigurations, compliance violations, network security risks and anomalous user activities.

StackRox augments Google Kubernetes Engine’s built-in security functions with a deep focus on securing the container runtime environment. StackRox’s core capabilities and functionality include network discovery and visualization of the application, detection of adversarial actions and detection of new attacks via machine-learning capabilities.

Sumo Logic Machine Data Analytics Platform offers enterprise-class monitoring, troubleshooting and security for mission-critical cloud applications. Sumo Logic platform integrates directly with GCP services through Google Stackdriver to collect audit and operational data in real-time so that customers can monitor and troubleshoot Google VPC, Cloud IAM, Cloud Audit, App Engine, Compute Engine, Cloud SQL, BigQuery, Cloud Storage, Kubernetes Engine and Cloud Functions, with more coming soon.

To learn more about our partner program, or to find a partner, visit our partner page.

Network policies for Kubernetes are generally available


We're pleased to announce the GA of network policies for Kubernetes, which we originally announced into beta last September. Network policies are fully tested and supported for production workloads on Google Kubernetes Engine, and, as a community, we recommend users enable them.

Network policies are sets of constraints that allow Kubernetes admins to designate how groups of Pods can communicate with each other, allowing the creation of a hierarchy of network controls. For example, if you have a multi-tier application, you can create a network policy that ensures a compromised front-end service doesn’t communicate with a back-end service such as billing.

Network policies for Kubernetes Engine was implemented in close collaboration with our partner Tigera, the company that’s driving Project Calico.

With GA, the community has added the following additional features:

  • Test support for up to 2,000 Kubernetes Engine nodes 
  • Support for the latest network policies API, currently at Kubernetes 1.9 
  • Calico version 2.6.7, which implements the network policies feature 
  • Calico Kubernetes Engine images on Google Container Registry 
What’s next for Kubernetes network policies?

  • Upgrading to Calico 3.0. For the purposes of this release, we adopted Calico 2.6, but will move to Calico 3.0 soon, giving you the ability to apply Calico network policies and extend base Kubernetes policies with advanced capabilities.
  • Application Layer Policy, which integrates with Istio to enable enforcement of security rules at multiple layers in the stack, and extend the existing network policies definition with layer 5-7 rules, for fine-grained control of application connectivity. Tigera recently shared a tech preview of this Calico feature, and we’re excited to see how Kubernetes Engine users will adopt this additional capability.

The pace of Kubernetes development comes fast and furious, particularly in the area of network security. To learn how to get started with and make the most of network policies in Kubernetes, check out this recent blog post by Google developer experience engineer Ahmet Alp Balkan, then try out network policies for yourself.

If you haven’t tried GCP and Kubernetes Engine before, you can quickly get started with our $300 free credits.

Introducing Skaffold: Easy and repeatable Kubernetes development


As companies on-board to Kubernetes, one of their goals is to provide developers with an iteration and deployment experience that closely mirrors production. To help companies achieve this goal, we recently announced Skaffold, a command line tool that facilitates continuous development for Kubernetes applications. With Skaffold, developers can iterate on application source code locally while having it continually updated and ready for validation or testing in their local or remote Kubernetes clusters. Having the development workflow automated saves time in development and increases the quality of the application through its journey to production.

Kubernetes provides operators with APIs and methodologies that increase their agility and facilitates reliable deployment of their software. Kubernetes takes bespoke deployment methodologies and provides programmatic ways to achieve similar if not more robust procedures. Kubernetes’ functionality helps operations teams apply common best practices like infrastructure as code, unified logging, immutable infrastructure and safer API-driven deployment strategies like canary and blue/green. Operators can now focus on the parts of infrastructure management that are most critical to their organizations, supporting high release velocity with a minimum of risk to their services.

But in some cases, developers are the last people in an organization to be introduced to Kubernetes, even as operations teams are well versed in the benefits of its deployment methodologies. Developers may have already taken steps to create reproducible packaging for their applications with Linux containers, like Docker. Docker allows them to produce repeatable runtime environments where they can define the dependencies and configuration of their applications in a simple and repeatable way. This allows developers to stay in sync with their development runtimes across the team, however, it doesn’t introduce a common deployment and validation methodology. For that, developers will want to use the Kubernetes APIs and methodologies that are used in production to create a similar integration and manual testing environment.

Once developers have figured out how Kubernetes works, they need to actuate Kubernetes APIs to accomplish their tasks. In this process they'll need to:
  1. Find or deploy a Kubernetes cluster 
  2. Build and upload their Docker images to a registry that's enabled in their cluster 
  3. Use the reference documentation and examples to create their first Kubernetes manifest definitions 
  4. Use the kubectl CLI or Kubernetes Dashboard to deploy their application definitions 
  5. Repeat steps 2-4 until their feature, bug fix or changeset is complete 
  6. Check in their changes and run them through a CI process that includes:
    • Unit testing
    • Integration testing
    • Deployment to a test or staging environment

Steps 2 through 5 require developers to use many tools via multiple interfaces to update their applications. Most of these steps are undifferentiated for developers and can be automated, or at the very least guided by a set of tools that are tailored to a developer’s experience.

Enter Skaffold, which automates the workflow for building, pushing and deploying applications. Developers can start Skaffold in the background while they're developing their code, and have it continually update their application without any input or additional commands. It can also be used in an automated context such as a CI/CD pipeline to leverage the same workflow and tooling when moving applications to production.

Skaffold features


Skaffold is an early phase open-source project that includes the following design considerations and capabilities:
  • No server-side components mean no overhead to your cluster. 
  • Allows you to detect changes in your source code and automatically build/push/deploy. 
  • Image tag management. Stop worrying about updating the image tags in Kubernetes manifests to push out changes during development. 
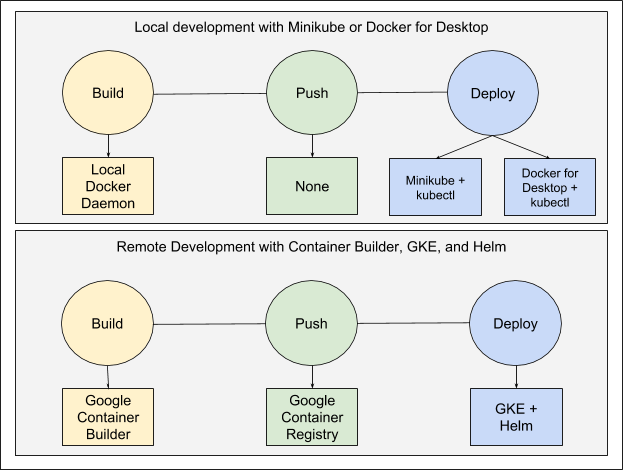
  • Supports existing tooling and workflows. Build and deploy APIs make each implementation composable to support many different workflows. 
  • Support for multiple application components. Build and deploy only the pieces of your stack that have changed. 
  • Deploy regularly when saving files or run one off deployments using the same configuration.

Pluggability


Skaffold has a pluggable architecture that allows you to choose the tools in the developer workflow that work best for you.
Get started with Skaffold on Kubernetes Engine by following the Getting Started guide or use Minikube by following the instructions in the README. For discussion and feedback join the mailing list or open an issue on GitHub.

If you haven’t tried GCP and Kubernetes Engine before, you can quickly get started with our $300 free credits.

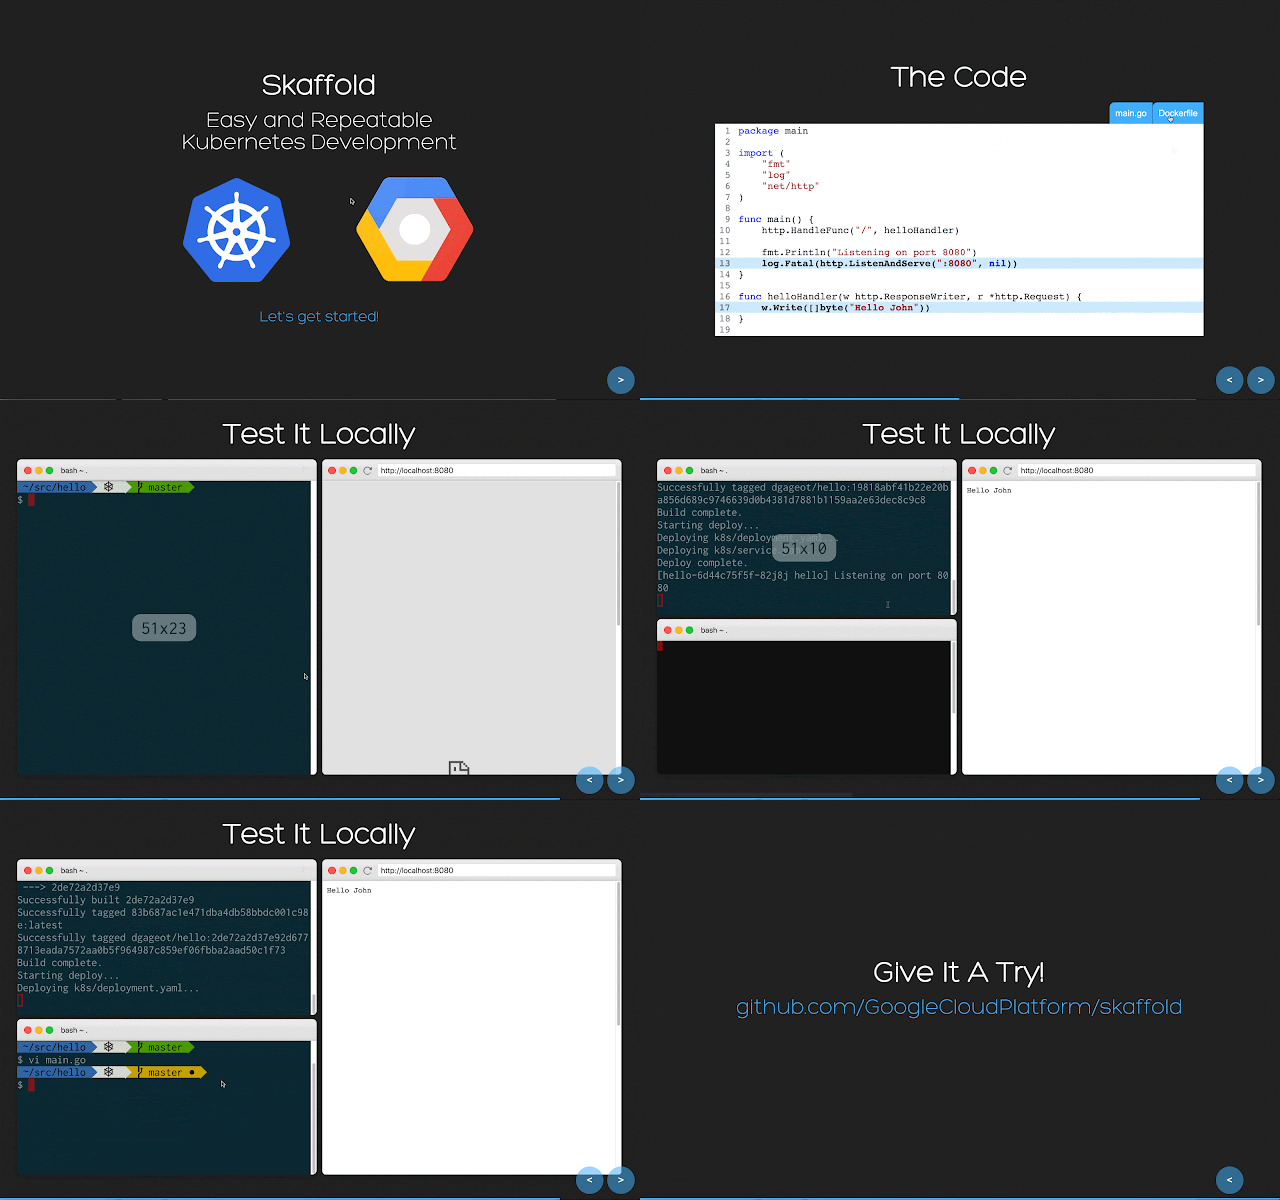
Demo