Author Archives: Simon Rogers

Then and now: a decade in Search

A new decade is right around the corner. As 2020 rapidly approaches, we’ve started reminiscing about the people, movies, songs and more that captivated us during the past 10 years. We took a look at 2010 data to explore what people were searching for at the beginning of the decade compared to the search trends topping the charts in 2019. Here are some 2010 trends that will give you all the feels.

People 

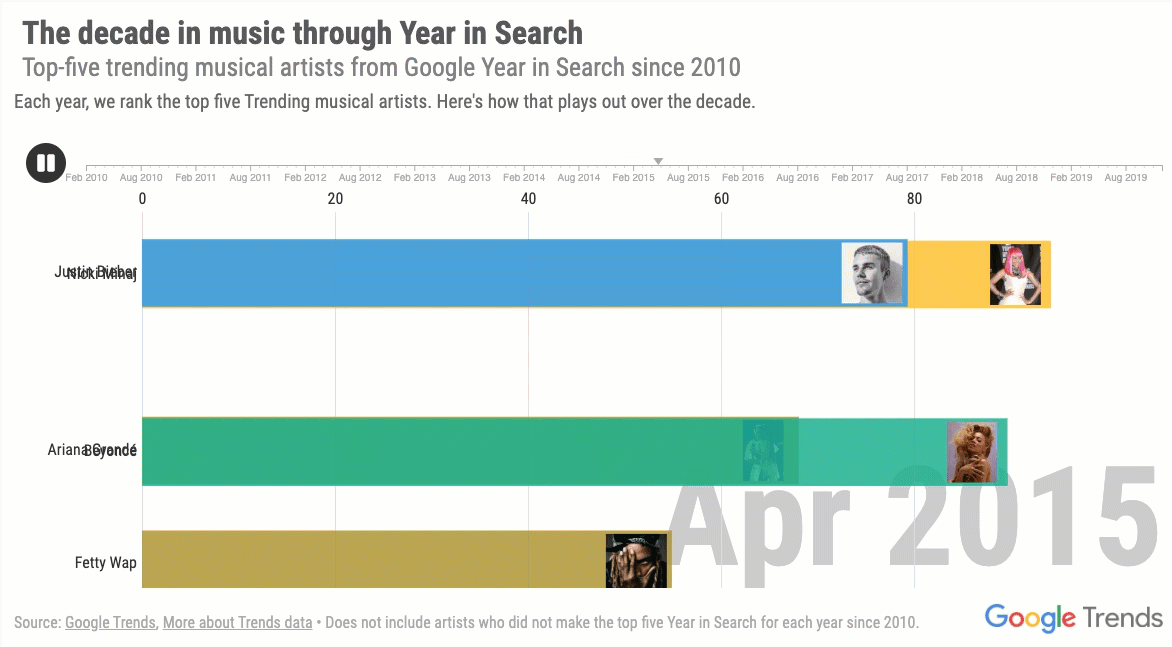
Justin Bieber’s first studio album, “My World 2.0,” debuted in March 19, 2010, and he became  the top trending musician that year. Bieber is trending again a decade later, but not for his music: This time he’s trending in the “weddings” category following his marriage to Hailey Baldwin.

Betty White was the oldest person to host “Saturday Night Live” in 2010. This year, Betty returned to top trends thanks to a movie role. She joined the cast of “Toy Story 4” as Bitey White, a friendly, hilarious toy tiger. 

Lebron James became a free agent in 2010 and announced on live television he would sign with the Miami Heat. He continues to make headlines, on and off the court, throughout the decade.

Musicians and songs

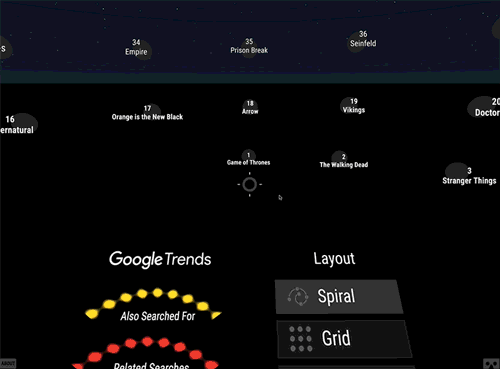
We took a look at the five top trending musicians or bands from each year since 2010. Here’s a glimpse at how we’ve seen searching for these artists change over the decade. (This does not include artists who didn’t make the top five Year in Search for each year.)

And if visualizing these musical journeys isn’t making you nostalgic, remembering the top trending songs from 2010 will. We took a trip down memory lane and looked at the jams we were busy belting out (and searching for). 

  1. Pants on the Ground by Larry Platt

  2. Love the Way You Lie by Rhianna 

  3. Like a G6 by Far East Movement

  4. We Are The World by Artists for Haiti

  5. Bedrock by Young Money

  6. Bottoms Up by Brantley Gilbert

  7. Teenage Dream by Katy Perry

  8. Rude Boy by Rhianna 

  9. Hey Soul Sister by Train 

  10. Right Above It by Lil’ Wayne ft. Drake 

Movies and TV 

“Toy Story 3” premiered in 2010 nearly 11 years after its previous sequel, sending it to the top trending movies category that year in the U.S. The cast of familiar faces (and some new ones!) return in “Toy Story 4.” The fourth movie in the saga made the top trending list for movies in 2019. 

Tony Stark saved the day in “Iron Man 2” at the beginning of the decade. This year, he joined the cast of superheroes in “Avengers: Endgame,” which was the top trending movie globally.

“The Walking Dead” walked into the top trending TV shows list in 2010 with its  series premiere. The show didn’t make the top trending list this year, but searches for “the walking dead” spiked twice in the U.S. for the season nine finale and the season 10 premiere.

Source: Search


We need a hero: 2019 in Search

In 2019, the world found heroes. 

We found heroes at the box office, where Avengers: Endgame was the top-trending movie around the world (in fact, “hero” was searched three times more than “villain” globally this year). We turned to real-life heroes in times of crisis, when searches for “how to become a first responder” hit an all-time high in the U.S. We cheered for them on the field, where Megan Rapinoe was one of the top trending athletes globally. And she was joined by other leading ladies: searches for “sheroes” increased by 150 percent and the “first female spacewalk” became a breakout trend worldwide. 

Thanks to all of our heroes for helping us soar into 2020. Explore more trending lists from the year at Google.com/2019

Source: Search


Creepy clowns and cute couples: 2019’s Top Halloween Costumes

It’s October, which means it’s officially the most spook-i-ful time of the year. We don’t want to wait until the 31st to start having some fun, so we’re back with this year’s Frightgeist, Google Trends’ collection of Halloween’s most-searched costumes. People looking to (trick or) treat themselves to the perfect Halloween look started the costume hunt last month. Here’s what people in the United States were searching for in September 2019.


Most-searched Halloween costumes in September 2019

Fortnite returned as one of the most searched Halloween costumes, but “IT” is scaring ITs way up to the top of the most searched Halloween costumes in the U.S. last month. Several Halloween favorites also return to the most searched list, like Spider-Man, clowns and unicorns. Check out the rest of your top 10.

  1. IT

  2. Witch

  3. Spider-Man

  4. Dinosaur

  5. Descendants

  6. Clown 

  7. Fortnite

  8. Chucky

  9. 1980s

  10. Unicorn

Halloween costume searches in the U.S. 

While many states are searching for Halloween go-tos like witches or dinosaurs, people in Casper, Wyoming, are stepping into Wonderland with “The Mad Hatter” attire and those in Idaho are testing out tails with mermaid costumes. Explore the costume map on Frightgeist to find out what other costumes are being searched for in your state.

Frightgeist States

Most searched costumes for couples 

Couples that costume together, stay together. And it looks like they are keeping things classic with “couple costume” searches like Bonnie and Clyde and Adam and Eve. Disney favorite, Lilo and Stitch, also top the most searched couples costumes last month.  

  1. Lilo and Stitch

  2. Bonnie and Clyde

  3. Cosmo and Wanda

  4. Adam and Eve

  5. Cheech and Chong

  6. Mario and Luigi

  7. Chucky and Tiffany

  8. Sonny and Cher

  9. Rick and Morty

  10. Phineas and Ferb

Most-searched “good-for-groups” costume searches 

Grab your group, dress up as your favorite characters and take first prize at your local costume contest. The Descendants' group of teens take the award for most-searched “good for groups” award, but the 1980s are making a comeback and may be the perfect fit for your groovy group.

If you’re a “Toy Story” fan looking to step out in a group or family costume, the biggest breakout costume search of this year is Forky. “Bo Peep costume” is also up by 300 percent.

  1. Descendants

  2. Fortnite

  3. Stranger Things

  4. 1980s

  5. Toy Story

  6. Power Rangers

  7. Star Wars

  8. The Wizard of Oz

  9. Minecraft

  10. The Powerpuff Girls

Most-searched pet costumes 

Dogs really are a ghoul’s best friend! People across the U.S. have been searching for the paw-fect costume for their furry friends. We can expect to see some strangely adorable pets this Halloween, with the “Stranger Things” monster Demogorgon making the most searched dog costume list. And with “Demogorgon costume” searches overall up 300 percent this year, expect to see some truly terrifying (and cute) costumes on Halloween night.

  1. Chucky dog costume

  2. Ewok dog costume

  3. Spider dog costume

  4. Pennywise dog costume

  5. Dinosaur dog costume

  6. UPS dog costume

  7. Demogorgon dog costume

  8. Shark dog costume

  9. Batman dog costume

  10. Ghost dog costume

Currently trending costumes for babies

We took a look at currently trending “baby costumes” from the past month and they are way too cute to spook, even if they are dressed up as Pennywise! For your baby with a sweet side, there are plenty of delicious treats, like concha and Starbucks, also trending. 

  1. Banana

  2. Dalmatian

  3. Grinch

  4. Pennywise

  5. Stay Puft

  6. Starbucks

  7. Concha

  8. Pumpkin

  9. Deer

  10. Olaf

Halloween costumes may be a little (candy) corny, but there is no shortage of scary good ideas on our most searched lists. To find even more costume inspiration, take a look behind the mask with Frightgeist. Witching you a very haunted Halloween!

Source: Search


Find out how journalists across the world use technology today

How do journalists use technology around the world? A new interactive explorer produced by the International Center for Journalists (ICFJ) and Google News Lab makes it easy to dig into a wealth of new survey data from hundreds of newsrooms worldwide.

Aimed at gauging how well journalists are keeping pace with the tech revolution, the  survey report garnered responses from more than 1,800 newsroom managers and journalists across 130 countries.

The data explorer allows you sift through this unprecedented dataset and surface new findings that shed light on trends in your region and around the world. You can filter by variables such as job position and newsroom type, as well as download the aggregated, anonymized survey data for further analysis.

Screen Shot 2018-03-02 at 3.30.41 PM.png

With the explorer, you can get the answers to general questions around technology usage across the globe and even really specific questions, such as:

  • Which tools are reporters in Sub-Saharan Africa using to reach and interact with their audiences?
  • What types of training are most valued by news editors in Latin America and the Caribbean?
  • How are newsroom employees in Eurasia/the former USSR securing their data - and how does that compare to those in North America?

ICFJ partnered with Google News Lab, design studio Polygraph and University of Miami’s Knight Chair Alberto Cairo to build the data visualization tool using findings from its State of Technology in Global Newsrooms study, the first-ever global survey of the adoption of technology by the news media.

Check out the data explorer, and see highlights from the survey on Medium.

Flourish helps journalists create easy data visualizations

Data visualization brings more eyes, attention and understanding to complex stories. When it works well, it can make a story crystal-clear. But it takes effort, coding and time—and is sometimes out of reach for all but the biggest newsrooms.


One easy way to make data visualizations is through Flourish, a tool that helps you design and create graphics to embed on a website or export as a SVG file. We’re making Flourish free for journalists, so that it’ll be easier for newsrooms of all sizes and budgets to create their own data visualizations.

vr.gif

We’re also working with design studio Pitch Interactive to make free virtual reality templates for newsrooms in Flourish. Here’s an example: The visual above shows related Google searches for TV shows. Any journalist in a newsroom could use that template, but with different data. For example, the visual below shows searches for U.S. Senators before this year’s midterm elections. (And here’s the visual code on GitHub).

vrsenators.gif

Traditionally, creating the same visual with different data is a tricky job involving developers. Flourish makes that easy—visuals can just be reused as they are, or you can create “stories” to narrate the visual by adding captions and leading the user on a visual journey.

th Flourish, journalists with no coding experience can make high-end interactive graphics  and stories with no tech support—check out these tutorial videos for extra help. Crucially for the data journalism community, Flourish lets newsrooms share templates with each other. Though newsrooms can create some private templates, they can open-source others.

Flourish was soft-launched last year, and since then, the development team worked with designers and data journalists to build the launch version that has just been released. In that time, hundreds of journalists and newsrooms have signed up to use Flourish.

Newsroom Collage.jpg
Examples of how newsrooms have used data visualizations in their reporting.

Flourish is just one of a series of tools and resources in our News Lab data journalism toolkit. Other tools include Tilegrams, Data Gif Maker and the Data Journalism Handbook. Look for more this year as we work to make it easier for data journalists to investigate, process, visualize and surface their data across the news industry.

The Year in Search: the questions we asked in 2017

As 2017 draws to a close, it’s time to look back on the year that was with our annual Year in Search. As we do every year, we analyzed Google Trends data to see what the world was searching for.

2017 was the year we asked “how…?” How do wildfires start? How to calm a dog during a storm? How to make a protest sign? In fact, all of the “how” searches you see in the video were searched at least 10 times more this year than ever before. These questions show our shared desire to understand our experiences, to come to each other’s aid, and, ultimately, to move our world forward. 

growth of how searches over time

Many of our trending questions centered around the tragedies and disasters that touched every corner of the world. Hurricanes devastated the Caribbean, Houston and Florida. An earthquake struck Mexico City. Famine struck Somalia, and Rohingya refugees fled for safety. In these moments and others, our collective humanity shined as we asked “how to help” more than ever before.

We also searched for ways to serve our communities. People asked Google how to become police officers, paramedics, firefighters, social workers, activists, and other kinds of civil servants. Because we didn’t just want to help once, we wanted to give back year round.

Searches weren’t only related to current events—they were also a window into the things that delighted the world. “Despacito” had us dancing—and searching for its meaning. When it came to cyberslang like “tfw” and “ofc,” we were all ¯\_(ツ)_/¯. And, finally, there was slime. We searched how to make fluffy, stretchy, jiggly, sticky, and so many more kinds of slime….then we searched for how to clean slime out of carpet, and hair, and clothes.

From “how to watch the eclipse” and “how to shoot like Curry,” to “how to move forward” and “how to make a difference,” here’s to this Year in Search. To see the top trending lists from around the world, visit google.com/2017.

Search on.

Source: Search


All the data you need to cover 500 local elections

Next year, nearly 500 local elections for Senate and House seats are taking place across the United States. As part of our mission to help journalists report on the stories that matter, we  worked with ProPublica to build the Election Databot: a tool that provides data about all of those elections, from campaign spending to Google Search Trends for candidates.


We launched the Databot for the 2016 general election, but this new version shows complete information for all the House and Senate races through November 8, 2018. It also includes this year’s special election on December 12 between Republican Roy Moore and Democrat Doug Jones, who are vying for one of Alabama’s Senate seats.
z

The new version of the Databot includes key data for national and local reporters writing about the hundreds of local races taking place across America, including:

  • Google Search Trends for each candidate and incumbent with real-time search data
  • YouTube videos from candidates and incumbents
  • Candidate spending data from the FEC
  • Voting records and Congressional data
  • Articles from Google News, including local news sources about each candidate
  • Press statements from each incumbent candidate
  • Cook report race ratings for each election
  • Deleted Tweets from Politwoops

You can explore either national or local data, and can set up notifications for a particular race. 2018 will be a big year for politics, and the Databot can help journalists report on election stories in new and exciting ways.

Data Journalism Awards 2018: call for entries

Data Journalism—the skill of combining reporting with data—is becoming an increasingly important part of every journalist’s toolkit. That’s not just anecdotal: a recent study commissioned by the Google News Lab found that half of all news outlets have at least one dedicated data journalist.


So, for the seventh consecutive year, we’re proud to support the 2018 Data Journalism Awards.

These are the only global awards recognizing work that brings together data, visualization and storytelling. It’s a part of our commitment to supporting innovative journalism around the world.


Data journalists, editors and publishers are encouraged to submit their work for consideration using this form by March 29, 2018. But don’t get too comfortable with that deadline, early applications are encouraged.


Last year there were 573 entries from 51 countries across five continents. Past winners of the $1,801 prizes include include BuzzFeed, The Wall Street Journal, The New York Times, FiveThirtyEight, ProPublica, and La Nación, as well as smaller organizations such as Rutas Del Conflicto, Civio Foundation and Convoca. And if you’re wondering why the prize is $1,801, It’s because William Playfair invented the pie chart in 1801.


Aimed at newsrooms and journalists in organizations of all sizes, the 2018 awards will recognize the best work in key categories, including:

  • Data visualization of the year
  • Investigation of the year
  • News data app of the year
  • Data journalism website of the year
  • Best use of data in a breaking news story, within first 36 hours
  • Innovation in data journalism
  • Open data award
  • Small newsrooms (one or more winners)
  • Student and young data journalist of the year
  • Best individual and team portfolio

The competition is organized by the Global Editors Network: a cross-platform community of editors-in-chief and media professionals committed to high-quality journalism, with the support of Google and the Knight Foundation.


The Data Journalism Awards offer another way to foster innovation by partnering with the news industry, in addition to our efforts with the Digital News Initiative. A jury of peers from the publishing community will decide on the winners.


Winners will be announced in May 2018 at a ceremony in Lisbon. Good luck!