Author Archives: Adam Singer

How to Turn Your Team’s Data Curiosity into Results


As a data expert, you know that most great ideas don’t strike like a bolt of lightning. They start with something slower: simple curiosity. They grow from “what if” to the seeds of an idea and, if you’re lucky, into some big next steps.

Many people on your team might also have these “what if” ideas too. For example, maybe they’ve got an insight about how to optimize your marketing plans and drive better results. But they might need a little nudge to turn those ideas into something bigger. For your organization to consistently get from insight to action, it’s important to give people at all levels the skills and training they need to explore their hunches using data. After all, you never know where your company’s next great idea might come from.

Here are three ways you can spread your data expertise to others, helping people beyond just a small team of go-to analytics experts.

1. Make training a priority

By analyzing the data that drives your business, anyone on your team can uncover how, when, and where consumers interact with your brand. That helps spread a deeper understanding of the customer journey throughout your organization. But to get there, you’ll need support to make data and analytics a priority — from the top down. In a recent study conducted by Google and Econsultancy, nearly two-thirds of leading organizations said that their executives treat data-driven insights as more valuable than gut instinct.1

One way to have an impact? Help executives create a training plan by determining what your team needs to know in order to analyze the data they’ve collected. By identifying the gaps between what they already know and what they still need to learn, you’ll have the insights you need to provide your team with the right level of training. Once you run a training session, record it and keep it online for later use, and share it with anyone who couldn’t make the meeting.

2. Share your success

If you’re a go-to data expert on your team, sharing your success is one of the most powerful tools you have to spread data literacy. Look for time to recap the results of a recent A/B test and show your team members how you achieved results. That will get them excited about what they can do with data. Also, don’t be shy — at every opportunity, recognize and reward others you see using data effectively. This helps build enthusiasm. Finally, use your knowledge and demonstrate proven business results to communicate what data can do.

As an analyst, you may even want to start thinking of your role in a new light. Analysts don’t just pull reports — they weave data narratives and interpret how data influences business results. That brings data to life and shows its value to the whole team. By sharing openly, you’ll give colleagues the tools they need to answer burning questions or dig deeper into their own hypotheses.

Looking for more ways to turn everyone one your team into a data-savvy marketer? We put together an infographic with 5 key steps to help get you there.

3. Work together across teams

While it might be tempting to use your data powers to make your own team shine, data is actually better when it’s used across teams. In fact, marketing leaders are 1.6X as likely as their mainstream counterparts to strongly agree that open access to data leads to higher business performance.2

You can take it one step further. Use your expertise to create and share easy-to-understand data reports outside your team. It’s a great way to help beginners make sense of recommendations and insights, and to get an idea for productive ways to use them.

When sharing your data, make sure it’s organized and easy for all teams to access and understand. Include clear definitions and common metrics so that everyone is on the same page. To go above and beyond, tailor insights specifically for different teams. That way they can get a deeper understanding of the report’s value. And don’t forget to consider the ways in which you deliver the data — every team has its own preferred channels for communicating.

Finally, don’t stop reaching out once you’ve worked to break down data silos in your company. It takes continued, active steps to keep data flowing across an organization.

With training in data analytics, every member of your team can support big ideas with real data. That helps ensure those ideas are taken seriously. And, in turn, it encourages your team to continue bringing new, diverse points of view to the table.

For more tips on sharing data expertise across your company, check out our Data-Driven Marketer's Strategic Playbook.

1-2 Econsultancy/Google, "The Customer Experience is Written in Data", May 2017, U.S. (n=677 marketing and measurement executives at companies with over $250M in revenues, primarily in North America; n=199 leading marketers who reported marketing significantly exceeded top business goal in 2016, n=478 mainstream marketers (remainder of the sample), May 2017

New ways to measure your users in Google Analytics

Almost 90% of marketing executives say that understanding user journeys across channels and devices is critical to marketing success.1

Today's customers have incredibly high expectations for personalized and relevant experiences from brands. That's why Google Analytics keeps working to better measure the full customer journey in all its complexity.

Let's look at four new Analytics features that are all about helping businesses understand users so they can deliver more personalized site experiences.

Focus on your users in reporting 


Analytics standard reports have been updated to focus on your users. User metrics are an essential way to understand engagement with your customers, especially those who may have multiple sessions across multiple days.

With our updated standard reporting, you can see immediately, for instance, how many users are coming to your site from paid search ― in addition to seeing the number of sessions.


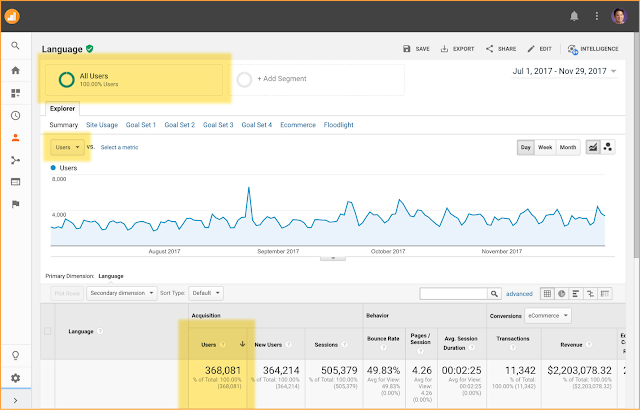
Users are now included in Analytics standard reports.


To enable this update, sign in to your account and go to Admin > Property Settings and then choose the toggle switch labeled Enable Users In Reporting.

For other ways to analyze by user, try existing reports like Active Users, Cohort Analysis, and Lifetime Value. In case you're wondering, session metrics will continue to be available in standard reporting ― that's not changing. Learn more about audience reports.

Measure lifetime metrics and dimensions for every user 


Another tool that marketers can use to analyze visitors on an individual level is User Explorer. And now we've added something new: lifetime metrics and dimensions for individual users (based on the lifetime of their cookie). These new metrics and dimensions will give Analytics users a much more detailed way to measure visitors and customers.


New lifetime metrics and dimensions for individual users in User Explorer.

For example, you can look back and see the total amount of time an individual user has spent or the total number of transactions an individual user has made on your website. You'll also see new dimensions that show data such as when a user made their first visit to your site and which channel acquired them.

The new lifetime metrics and dimensions are already available in your Analytics account. Learn more about User Explorer.

Audiences in reporting 


For marketers who live and breathe audiences ― which is most of us ― the breathing just got easier. We've added the option to publish any audience to a new report in Analytics that should help make every audience easier to understand.


Publish your audiences into Analytics and then view reporting in the Audiences report.


You can now go to the new Audiences report and see a cross-channel view of the audiences you’ve created in Analytics. This is a change from the past, where you could create audiences in Analytics and export those audiences to other products like AdWords, but you weren’t able to publish audiences to Analytics for reporting.

For instance, you might decide to publish an audience to Analytics so that you can see all users who have purchased within the last 12 months but not during the last 2.

You can find the new Audience report in your Analytics account. Learn more about Audiences in reporting.

Reach users most likely to convert 


Meet our newest metric: Conversion Probability. It takes user-based metrics one step further to show you just what the name suggests: the probability that a given user will convert in the future. The calculation is based on a machine learning model that learns from users who have made transactions in the past.

The advantages are clear: Marketers can create remarketing lists that target users who have a high likelihood to purchase and then reach those users through either advertising campaigns in AdWords and DoubleClick or site experiments in Optimize.

We are also adding a new Conversion Probability report. This report will show you the Conversion Probability for all your users, including across important dimensions such as channel.


The new conversion probability report.

This new feature from Analytics Intelligence is the first forward-looking estimate of how likely a conversion is for individual users. It's rolling out in beta to all Analytics accounts over the next few months. Learn more about Conversion Probability. 

These four new enhancements will help you better understand your users and what they are doing on your site, so that you can create better experiences for them. If you — like those 90% of marketing executives — are working hard to understand your users' journeys, we hope you'll find these features useful.

Happy analyzing!


1"The Customer Experience is Written in Data." Econsultancy and Google, May 2017. 

Your Marketing Data Has a Story to Tell — Are You Listening?

The old cliché says every picture tells a story. The question is — do you have a complete picture of your customer? And do you really hear all the stories they’re telling? Today’s consumers use many different devices, and there’s new channels to listen to every year. It can seem like a lot, but it gives marketers an opportunity to use data analytics to gain a deeper understanding into their audiences if they learn to keep their ears out.

In Why a Data and Analytics Strategy Today Gives Marketers an Advantage Tomorrow, Matt Lawson, Google marketing director, and Shuba Srinivasan, a Boston University business professor, look at the ways in which it’s more important than ever for businesses to embrace data analytics. For companies of all sizes, the time is now: With the right tools, strategy, and outlook, your organization can turn noisy data into a symphony of insights.

“We live in an always-on world. That’s an enormous challenge for marketing organizations, but one with a huge upside if they can turn data into insight,” explains Srinivasan, Adele and Norman Barron Professor of Management at the Boston University Questrom School of Business.

The article explores ways that companies can build stronger data strategies to navigate today’s digital landscape. Some key topics include:


All of these points are worth a deeper dive, but they boil down to one message: You need to listen to what your data’s telling you. Analytics isn’t a spectator sport, where you can watch from the sidelines as your team plays ball. To be successful, you need to be in the mix, applying data-driven principles to what you do every day.

It’s not as hard as it sounds. Get back to basics and use the scientific method: Make an educated guess, run a test, and hear what the data says. Starting with the team leader, if the entire team can become comfortable with data-backed trial and error, you’ll see real results.

Want to see the many ways shared data can provide insights and boost the performance of your business? Download The Data-Driven Marketer's Strategic Playbook.

Marketer questions answered: Econsultancy and Google on how to better use data


Q&A with Econsultancy’s Stefan Tornquist and Google’s Casey Carey


“How can I put data at the center of my organization’s marketing strategy? Which teams need access to that data? And how should I train them to use it successfully?”

On Nov. 15, we hosted a webinar with Econsultancy to answer questions like these and discuss our recent joint survey of over 700 marketing leaders about how they’re using data to stay ahead in their fields. Casey Carey, Director of Platforms Marketing at Google, and Stefan Tornquist, Vice President of Research at Econsultancy, walked through the results, revealing some fascinating takeaways.

Topics included everything from key skills and training to best practices in data-driven decision-making. One standout lesson? Teams across companies are focused on tying their data and analytics to business outcomes.

After the talk, listeners shared a number of follow-up questions for Casey and Stefan. Below, we’ve rounded up some of the most intriguing answers. Interested in the bigger picture? Check out the full webinar here: 7 ways marketing leaders use data to deliver better customer experiences.

1. What are the first steps marketing teams should take when they begin using multi-touch or data-driven attribution?

Casey: First and foremost, attribution is a big data problem. Going into an attribution project, job one is to get your data house in order. Connect all your campaigns, prospective customer touchpoints, and conversion events; start establishing a taxonomy for naming channels, placements, sites, and so on.

Second, you have to reckon with the real organizational and cultural impacts of moving to an attribution model. Companies tend to be organized in channel silos. So when you begin looking at performance across channels to find the optimal mix, you have to break down those barriers. Your executive leadership has to sponsor that, and your teams have to be willing to make the necessary changes.

2. What types of training typically help people in marketing get over the “I’m not an analyst, that’s not my job” attitude and use more data?

Stefan: Many companies see training as either a technical discipline or an employee benefit, and one that comes at a cost. But with marketing becoming more sophisticated and technical, you need an ongoing training program for marketers that includes a foundation in statistics and in analytical practices and thinking, as well as core finance and business knowledge. You also need to provide training on the technologies themselves.

In our own research, we’ve seen that when they’re given the right training, marketers become more effective, stay in the organization longer, and are more likely to be promoted.

(For more on training to use data, check out How to make everyone on your team a data-savvy marketer.)

3. What are some of the critical skill sets needed to lead this type of transformation and generate buy-in?

Stefan: There’s a close association between marketing and analytics on the one hand and the business outcomes on the other. Leaders of a targeted transformation to data-driven marketing need to understand – and show that they understand – the business’s larger goals and issues. They need to connect abstract principles of analytics to practical outcomes and business KPIs – to close the gap between data and insights. They need to show how practical insights have actually been data-driven, how data gets you real answers that contribute to the business.

4. How can vendors and consultants help companies get the right resources and institute the organizational changes that are needed for success?

Casey: Sometimes a vendor’s goal when they make a sale is to minimize the impact that their technology will have on resources and organizational structures. Companies buying a technology solution have to see that solution as part of an entire process and strategy, and ask vendors to help with that.

I always love when I’m talking to prospective clients and they ask questions such as: “OK, so, how does this impact my org structure? How many people and what skills do I need to actually be successful doing this? What other services should I be considering?” It really instills confidence that they’re actually going to realize the business value from the investment.

5. How do you cast a wider net from a data and analytics standpoint and ensure KPIs don’t miss critical trends and changes?

Stefan: There’s got to be a balance. The insights we provide need to go beyond things like tweaks to make emails perform better. Instead, we need to think both analytically and creatively and ask higher-level questions. Things like, “What are our customers going to be doing in five years that’s going to make our current business model obsolete?”

Casey: You have to build into your organization the discipline to open your field of view so you’re not getting caught by surprise. Sometimes we get so focused on executing and optimizing towards KPIs and we lose that bigger view.

6. Do businesses get hung up on language when it comes to change? Is the word “marketing” sufficient to describe the scope of modern marketing?

Stefan: Perhaps “marketing” isn’t sufficient to describe what modern marketing is becoming. Similarly, we say “digital marketing” even though digital is almost a vestigial word in this context – is there any aspect of marketing today that doesn’t have a digital component?

But the reality is we’re not going to change what we call things. What organizations can do internally is to change the “language-first” perception. To a certain degree, putting new terminology around it – “marketing-led transformation,” for example – does change how other stakeholders perceive it. But the bottom line is that marketing owns that customer relationship and owns that evolving customer knowledge. As such, it’s still going to be the core of whatever change is happening.

To see the slides and hear Stefan and Casey’s presentation, including the full set of Q&As, download the webinar.

Google Analytics for Firebase: New Look and New Features

If you use Google Analytics for Firebase to measure your apps, you'll notice something familiar today: a new look and feel that's more consistent with your Google Analytics experience.

These new elements echo some of the changes we made to Google Analytics earlier this year — the updates should help bridge the gap for anyone who uses both Google Analytics and Google Analytics for Firebase. We've also added new reports and cards that will make the Google Analytics for Firebase Dashboard more timely and helpful.

Real-Time Data 


We are now providing you with more real-time information throughout Google Analytics for Firebase to give you a better read on what’s happening in your app.

Inside the Google Analytics for Firebase Dashboard, you’ll now find a real-time card, much like the one on the Google Analytics Home. It shows details on the number of active users in the past 30 minutes. You'll also see the top conversion events logged by the app. You can configure these conversions so you can track app events that are most important to your team.


The new Google Analytics for Firebase Dashboard
 
Google Analytics for Firebase has a brand new stability card that reports on data from Firebase Crash Reporting and Firebase Crashlytics. It displays the percentage of users who have not had their app crash, so you can see just how stable your app is.

Latest Release 


The new Latest Release report lets app developers track the adoption and stability of new app versions within a few hours of release.

The report also contains a real-time card with an app version filter that lets you see which users have adopted the latest version of a release and know whether any versions have crashed in the past 30 minutes. It also lets you measure your users’ level of engagement.

Same Great Analytics 


The updated experience is more consistent with Google Analytics, but one thing hasn't changed: Google Analytics for Firebase users still get the same great app-centric reporting and analysis they're used to for Android and iOS. Our engineers are working on developments and new features we'll share in the months to come.

To see the new look and updated features, check out your Firebase project now. (Don't have one yet? Sign up!)


New tools for managing Google Analytics users

Last month we announced new account management tools for businesses using Google Analytics. Today we’re thrilled to introduce another round of improvements. Over the coming months, we’ll centralize user management across a company’s many Google Analytics accounts and launching user groups to simplify the task of managing permissions for multiple teams of users. We've heard feedback from many businesses about the need for simple but powerful tools to manage access to their important analytics data and built these features help to meet these needs.

Centralized user management

Administrators can now centrally manage users across all Google Analytics accounts linked to your organization. If you have many accounts, and need to add users across them, you’ll see huge time savings. For example, if you need to give a new teammate access to 25 accounts, you previously had to visit every account to get them setup. Now you can complete this task from one place.
Centralized user management for an organization

You can also:
  • View rich cross product and cross account details for your users
  • Manage a user’s access across many Analytics accounts in one console
  • See new details about how a user inherits their permissions
  • Get clear in-product explanations of different access levels and privileges
User details showing access across products and accounts


If you’re just using Google Analytics, and don’t need to manage users across accounts, you’ll see many of these same improvements inside of Google Analytics. All of the navigation and documentation improvements are present in both places.

User Groups in Google Analytics

Organization administrators often need to manage access for hundreds of users. This process can be tedious, especially when dealing with multiple Analytics accounts. Now you can more easily manage large teams of users by creating a group, placing the appropriate people inside it, and granting the groups access to the appropriate Analytics accounts. You can even place a group inside a group if you need to manage a hierarchy of teams. To get started, you’ll need to create an organization. Check out this help center article for more information.
Detail for an example “IT Team” user group


Combined with existing features like the ability to centrally audit and set policies for users, these new features bring enterprise grade controls to your organization. They also pave the way for future enhancements, such as bringing centralized user management and user groups to more products.

Better A/B Testing with Firebase

Earlier this year, the Google Optimize and Firebase teams worked together to bring A/B testing functionality to Firebase. Last week, at the Firebase Dev Summit, we announced that A/B testing is now available in beta to all app developers.

This post originally appeared on The Firebase Blog.


Announcing Better A/B Testing with Firebase 


If you're like most app developers, you know that small changes can often make a big difference in the long term success of your app. Whether it's the wording that goes into your "Purchase" button, the order in which dialogs appear in your sign-up flow, or how difficult you've made a particular level of a game, that attention to detail can often make the difference between an app that hits the top charts, or one that languishes. 


But how do you know you've made the right changes? You can certainly make some educated guesses, ask friends, or run focus groups. But often, the best way to find out how your users will react to changes within your app is to simply try out those changes and see for yourself. And that's the idea behind A/B testing; it lets you release two (or more!) versions of your app simultaneously among randomly selected users to find out which version truly is more successful at getting the results you want. 


And while Firebase Remote Config did allow you to perform some simple A/B testing through it's "random percentile" condition, we've gone ahead and added an entirely new experiment layer in Firebase that works with Remote Config and notifications to make it quick and easy to set up and measure sophisticated A/B tests. Let's take a quick tour of how it works!


Getting to Know the New A/B Testing Feature 


With the new A/B testing feature, you can create an A/B test that will allow you to play with any combination of values that you can control through Remote Config. Setting up an A/B test allows you to define how the experiment will behave in a number of different ways, including determining how many of your users are involved with the experiment at first…


…how many variants you want to run, and how your app might behave differently for each variant…


...and what the goal of the experiment is.


Different experiments might have different desired goals, and A/B testing supports a number of common outcomes, like increasing overall revenue or retention in your app, reducing the number of crashes, or increasing the occurrence of any event you're measuring in Google Analytics for Firebase, such as finishing your in-app tutorial.

Once you've defined your A/B test, Firebase takes over by delivering these different variations of your app to randomly-selected members of your audience. Firebase will then measure your users' behavior over time, and let you know when an experiment appears to be performing better, based on those goals you've defined earlier. Firebase A/B testing measures these results for you with the same Bayesian statistical models that power Google Optimize, Google's free testing and personalization product for websites.

Using A/B Tests for Better Onboarding: A Case Study 


Fabulous, a motivational app for building better habits, recently made improvements to their app's onboarding by using Firebase A/B testing. When the user first starts an app, Fabulous shows them how to complete a habit, presents them with a letter about forming better habits, and then asks them to commit to a simple routine. The team suspected that if they removed a few steps from this onboarding process, more people might complete it.


Some of the screens a typical user encounters when first using Fabulous.
 
So they ran an A/B test where some users didn't see the letter, others didn't see the request to commit to a simple routine, and others skipped both of those steps. The Fabulous team found that by removing both of these steps from the onboarding process, there was a 7% improvement in the rate of users completing the onboarding flow. More importantly, they confirmed that this shorter onboarding experience didn't have any impact on their app's retention.

Test Your Notifications, Too! 


You also have the ability to A/B test your app notification messages through the Firebase Notifications console. You can try out different versions of your notification message and see which ones lead to more users opening up your app from that notification, or which messages lead to users performing some intended goal within your app, like making a purchase.

Getting Started 


A/B testing is available in beta to all Firebase developers starting today. If you're excited to get started, you should make sure that your app is wired up to use Remote Config and/or Firebase Cloud Messaging, and that you've updated these libraries to the latest and greatest versions. You can always find out more about A/B testing in our documentation, or check out the A/B Test Like a Pro video series we've been building.

Then, head on over to the Firebase Console and start making your app better — one experiment at a time!


Google Analytics 360 + Salesforce: A Powerful Combination

We often hear from marketers how challenging it is to piece together online and offline customer interactions in order to see a complete view of a customer’s journey. That’s why we’re excited to share that Google and Salesforce are working together to seamlessly connect sales, marketing and advertising data for the first time, giving you the full view of what’s working and what isn’t as customers engage with your ads, websites, apps, emails, call centers, field sales teams and more.

Today at Dreamforce, Google and Salesforce are announcing a strategic partnership to deliver four new, turnkey integrations between Google Analytics 360, Salesforce Sales Cloud and Salesforce Marketing Cloud:
  • Sales data from Sales Cloud will be available in Analytics 360 for use in attribution, bid optimization and audience creation
  • Data from Analytics 360 will be visible in the Marketing Cloud reporting UI for a more complete understanding of campaign performance
  • Audiences created in Analytics 360 will be available in Marketing Cloud for activation via direct marketing channels, including email and SMS
  • Customer interactions from Marketing Cloud will be available in Analytics 360 for use in creating audience lists


These new connections between our market-leading digital analytics solution and Salesforce’s market-leading customer relationship management (CRM) platform will change the game for how our clients understand and reach their customers — and how they measure the impact of their marketing. These integrations are fully consistent with our privacy policies and have settings that offer privacy controls and choice on how data is used.

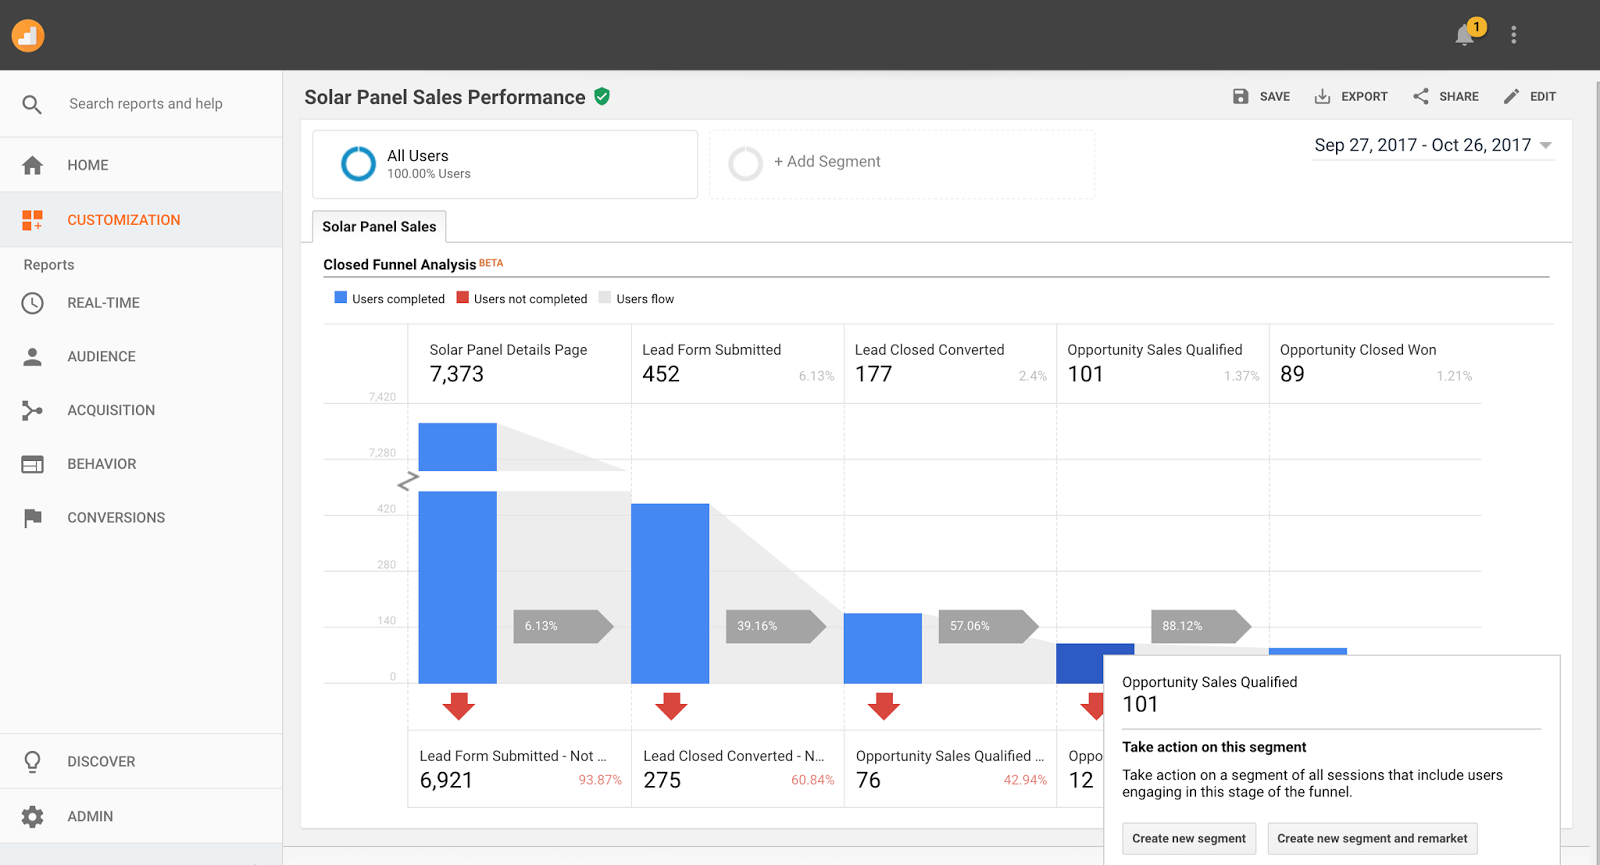
By integrating your customer data, you can see a customer’s path from awareness all the way through to conversion and retention. And with connections to Google’s ad platforms and Salesforce’s marketing platform, you can quickly take action, engaging them at the right moment. You'll see these new integrations begin to arrive in the first half of 2018.
Example of a complete customer journey funnel in Google Analytics 360 joining website data (pageviews, leads submitted) with pipeline data from Sales Cloud (lead and opportunity stages); example also shows a prompt to create a new audience segment to take action


New insights

Until now, businesses have not been able to connect offline interactions, such as an estimate provided by a call center rep or an order closed by a field sales rep, with insights on how customers use digital channels. With the connection between Sales Cloud and Analytics 360, soon you’ll be able to include offline conversions in your attribution modeling when using Google Attribution 360, so you’ll have a more complete view of ROI for each of your marketing channels and even more reason to move away from a last-click attribution method. This integration will also let you see how your most valuable customers engage with your digital properties, answering some important questions like, what are they looking for and are they actually finding what they need?

With the integration allowing data from Analytics 360 to be visible in Marketing Cloud, you’ll gain a more complete understanding of how your marketing campaigns perform. For example, if you send an email campaign to frequent shoppers to promote your fall fashion line, you’ll be able to see right in Marketing Cloud information such as how many pages people visited when they came to your site, the number of times people clicked on product details to learn more, and how many people added items to their shopping cart and converted.

Easy to take action

Today, Google Analytics allows you to create audience lists and goals that you can easily send to AdWords and DoubleClick for digital remarketing and to optimize bids. With the new connection from Sales Cloud to Analytics 360, in addition to unlocking new insights and more data for attribution modeling, you’ll be able to combine Salesforce data (such as sales milestones or conversions) with behavioral data from your digital properties to create richer audiences and for smarter bidding.

For example, if you’re a residential solar panel company and want to find new customers, you can create an audience in Analytics 360 of qualified leads from Sales Cloud and use AdWords or DoubleClick Bid Manager to reach people with similar characteristics. Or, create a goal in Analytics 360 based on leads marked as closed in Sales Cloud, and automatically send that goal to AdWords or DoubleClick Search to optimize your bidding and drive more conversions.

With the Analytics 360 connection to Marketing Cloud, you’ll be able to use customer insights to take action in marketing channels beyond Google’s ad platforms, such as email, SMS or push notification. For example, you can create an audience in Analytics 360 of customers who bought a TV on your site and came back later to browse for home theater accessories, and use that list in Salesforce to promote new speakers with a timely and relevant email.

Powerful combination

Every day, Google Analytics processes hundreds of billions of customer moments, Salesforce Marketing Cloud sends 1.4 billion emails, and there are over 5 million leads and opportunities created in Salesforce Sales Cloud. These new integrations represent a powerful combination, and we believe they will help marketers take a big step closer to the ultimate dream: providing every customer with a highly relevant experience at each step of their journey.

You’ll see these new joint capabilities become available beginning in 2018, and we'll be sure to keep you updated along the way. Contact us here if you would like to learn more about Analytics 360. We hope you’re as excited as we are!


The Google Analytics 360 + Salesforce integrations are just one part of a broader strategic alliance announced today between Google and Salesforce. Read about new integrations between G Suite and Salesforce and a new partnership between Google Cloud and Salesforce here.

Google Optimize now offers more precision and control for marketers

Savvy businesses review every step of the customer journey to ensure they are delivering the best experience and to find ways to offer more value. Today, we’re releasing two new features that will make it easier for you to improve each of those steps with the help of Google Optimize and Optimize 360.

AdWords integration: Find the best landing page 


Marketers spend a lot of time optimizing their Search Ads to find the right message that brings the most customers to their site. But that's just half the equation: Sales also depend on what happens once people reach the site.

The Optimize and AdWords integration we announced in May gives marketers an easy way to change and test the landing pages related to their AdWords ads. This integration is now available in beta for anyone to try. If you’re already an Optimize user, just enable Google Optimize account linking in your AdWords account. (See the instructions in step 2 of our Help Center article.) Then you can create your first landing page test in minutes.

Suppose you want to improve your flower shop's sales for the keyword “holiday bouquets.” You might use the Optimize visual editor to create two different options for the hero spot on your landing page: a photo of a holiday dinner table centerpiece versus a banner reading "Save 20% on holiday bouquets." And then you can use Optimize to target your experiment to only show to users who visit your site after searching for “holiday bouquets.”

If the version with the photo performs better, you can test it with other AdWords keywords and campaigns, or try an alternate photo of guests arriving with a bouquet of flowers.

Objectives: More flexibility and control 


Since we released Optimize and Optimize 360, users have been asking us for a way to set more Google Analytics metrics as experiment objectives. Previously,
Optimize users could only select the default experiment objectives built into Optimize (like page views, session duration, or bounces), or select a goal they had already created in Analytics.

With today's launch, Optimize users no longer need to pre-create a goal in Analytics, they can create the experiment objective right in Optimize:


Build the right objective for your experiment directly in the Optimize UI.

When users build their own objective directly in Optimize, we’ll automatically help them check to see if what they’ve set up is correct.

Plus, users can also set their Optimize experiment to track against things like Event Category or Page URL.

Learn more about Optimize experiment objectives here.

Why do these things matter? 


It's always good to put more options and control into the hands of our users. A recent study showed that marketing leaders – those who significantly exceeded their top business goal in 2016 – are 1.5X as likely to say that their organizations currently have a clear understanding of their customers' journeys across channels and devices.1 Testing and experimenting is one way to better understand and improve customer journeys, and that's what Optimize can help you do best.

>>> Check out these new features in Optimize now<<<


1Econsultancy and Google, "The Customer Experience is Written in Data", May 2017, U.S.

Data Studio: Richer Visualizations and Analytical Functions

The Data Studio team has been hard at work launching new features to allow for richer visualization and new views on data. Today, we'll highlight some of these recent launches.

Pivot Tables

Pivot tables let users narrow down a large data set or analyze relationships between data points. Additionally, they reorganize user's dimensions and metrics to help quickly summarize data and see relationships that might otherwise be hard to spot.

Example Pivot Table (Help center doc here)

Coordinated Coloring

Coordinated coloring allows users to bind colors to specific data. When a user creates visualizations, Data Studio automatically binds colors to data, so that color:data pairs stay consistent between visualizations and when filtering. This feature is automatically turned on for all new reports, and available in old reports.

Example Coordinated Coloring (Help center doc here)

Google Analytics Sampling Indicator

Google Analytics samples data in order to provide accurate reporting in a timely manner. Data Studio now shows a sampling indicator in Data Studio reports when a component contains sampled Analytics data.

GA Sampling indicator (Help center doc here)

Field Reports Editing

Data Studio has also recently added new options to the chips in reporting. These new options allow you to:
  • Rename fields
  • Change aggregation types
  • Change semantic types
  • Change date functions
  • Apply % of total, difference from total, or percent difference from total to a metric from within the report.
Example of new field editing options (Help center doc here).

Submitting and voting for new features

The Data Studio team will continue to introduce new features and product enhancements based on your submissions. You can view requests submitted by other users, upvote your favorites, or create new ones. Learn more here.