Three years ago, we introduced Google Analytics 4, a re-imagined tool that helps you get a complete view of consumer behavior across web and app by using first-party, modeled data. This is critical in an evolving privacy and technology landscape, where marketers have to rethink their approach to measurement in order to keep getting the insights they rely on. Today we’re introducing new resources to help you make the switch to Google Analytics 4, improved machine learning features, actionable reporting and new integrations.
Make the switch now to Google Analytics 4 with helpful solutions
Earlier this year we shared that we will begin sunsetting standard Universal Analytics properties on July 1, 2023. We recognize that setting up Google Analytics 4 to fit your needs takes time and resources, in particular for large enterprises with complex Analytics 360 setups. To allow enterprise customers more time to have a smoother transition to Google Analytics 4, we’re moving the Universal Analytics 360 properties’ sunset date from October 1, 2023 to July 1, 2024. We're focusing our efforts and investments on Google Analytics 4 to deliver a solution built to adapt to a changing ecosystem. Because of this, throughout 2023 we'll be shifting support away from Universal Analytics 360 and will move our full focus to Google Analytics 4 in 2024. As a result, performance will likely degrade in Universal Analytics 360 up until the new sunset date.
To help everyone make the move, we're launching new resources and tools to help you get started with Google Analytics 4. Our step by step guide helps you complete the entire setup of Google Analytics 4 at your pace and customize it to your needs. Or, if you prefer a more automated experience, you can use the Setup Assistant in the admin section of your Universal Analytics property. Once a Google Analytics 4 property is created and connected, the Setup Assistant can automate some required setup steps and help you track your progress. For example, the Setup Assistant lets you select the goals you want to import to Google Analytics 4, copy desired Google Ads links and audiences, and add users who have access to your current property.
The Setup Assistant tools
The best Google Analytics 4 setup comes from following the steps above to create a customized property tailored to your needs. The earlier you do this, the more historical data and insights you will have in Google Analytics 4. For example, SunCorp, one of Australia's largest financial services brands, prioritized setting up Google Analytics 4 to build a base of historical insights.
When Universal Analytics stops collecting data in 2023, we will have over two years of insights and reporting in Google Analytics 4. This is critical for a business like us to ensure we have a robust foundation of data to inform decision making.Mim Haysom Chief Marketing Officer, Suncorp Group
Beginning in early 2023, the Setup Assistant will also create a new Google Analytics 4 property for each standard Universal Analytics property that doesn’t already have one — helping you jumpstart your migration. These new Google Analytics 4 properties will be connected with the corresponding Universal Analytics properties to match your privacy and collection settings. They’ll also enable equivalent basic features such as goals and Google Ads links. If you’d rather begin the switch on your own, you can opt out of having the Setup Assistant do it for you.
Get accurate insights with new machine learning solutions
Behavioral modeling uses machine learning to fill gaps in your understanding of customer behavior when cookies and other identifiers aren’t available. Soon, behavioral modeling will also be available in the real time reporting, giving you a complete view of the consumer journey as it happens. It’s helping marketers like Nestlé get accurate insights from more customer activity.
Behavioral modeling with Consent Mode in Google Analytics 4 drove a 23% increase in the observable traffic in analytics reporting on European and UK websites.Jaime Rodera Privacy & Consumer Data Manager, Nestlé
Improve ROI with new actionable reporting and integrations
To get a more accurate picture of your campaigns across all of your marketing touchpoints, we will soon introduce custom channel grouping in Google Analytics 4 to help you see the performance of different channels aggregated. For example, you’ll be able to compare the performance of your paid search brand with your non-brand campaigns. These custom channel groupings work in reporting retroactively, and across the advertising and explore workspaces.
Your insights are only as good as the actions you can take from them. On top of Google Ads, Display & Video 360 and Search Ads 360, we will soon launch an integration with Campaign Manager 360 via Floodlight. This will allow marketers to bid towards Google Analytics 4 conversions in Display & Video 360’s automated bid strategies.
Now is the time to make Google Analytics 4 your cross-platform Analytics solution. Get started with Google Analytics 4 now, complete the setup by following our step by step guide and learn how to get the most out of it with the refreshed Google Analytics 4 certification.
At this year’s Google Marketing Livestream, we shared the latest updates coming to the new Google Analytics, the next generation of Analytics designed for the future of measurement.
Get privacy-safe customer insights using machine learning
With new privacy-safe solutions, Google is helping advertisers preserve marketing measurement while respecting user consent choices. This includes using machine learning to model conversions in Google Ads, so you can continue to optimize performance in a privacy-safe way when observed conversion data is not available.
Later this year, we’ll extend our modeling capabilities to certain reports in Google Analytics 4 properties to enhance your understanding of the customer journey when observed behavioral data is not available. If users don’t consent to analytics cookies, you’ll still be able to generate important customer insights while respecting your users’ privacy preferences.
For example, if there is incomplete data in your User Acquisition report, modeled data (in addition to observed data) will offer a more complete picture of the number of new users your campaigns have acquired.
Easily discover relevant insights
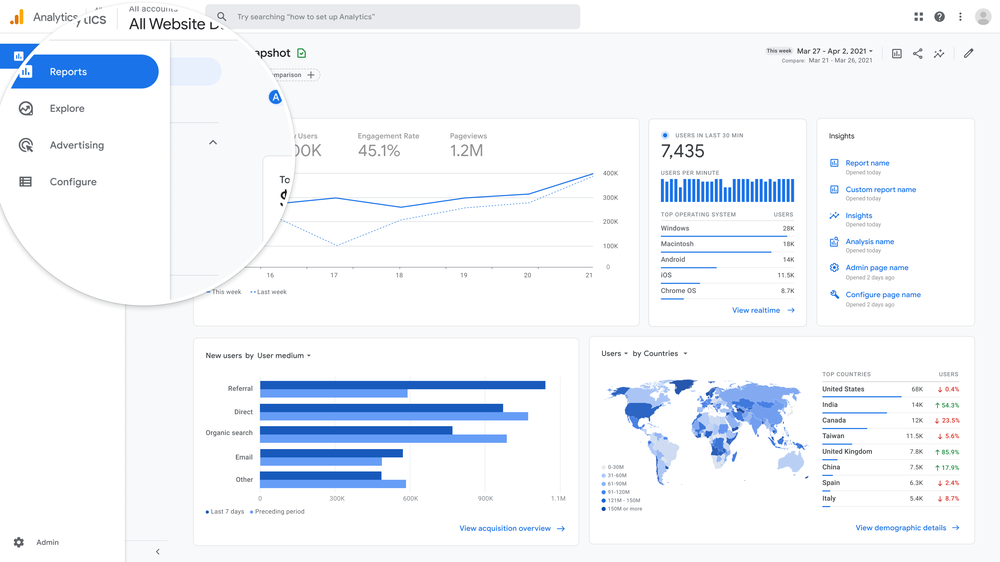
We want to make the new Analytics experience as intuitive to navigate as possible, so you can discover key insights with unprecedented speed and ease. In a new modular left navigation, we’ve organized important use cases into workspaces that will guide you to the reports, analyses, or data — like advertising conversions — you’re looking for.
New workspaces in left navigation
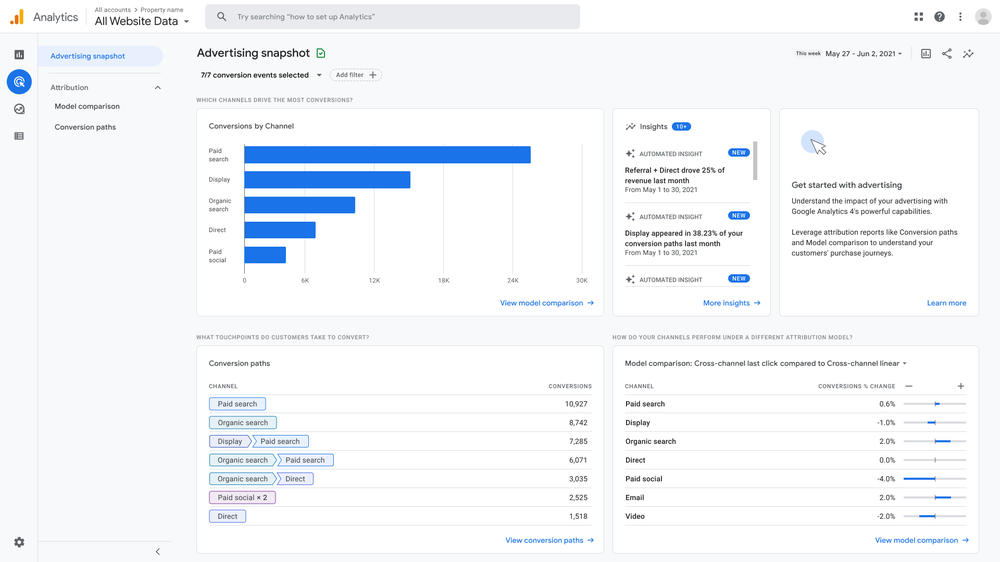
The new Advertising Workspace is designed to quickly address everyday advertiser needs and unlock deeper insights into your campaign performance. In the snapshot, you can see relevant campaign and performance insights at a glance. You’ll get automated insights notifying you of things like performance spikes in your campaigns, where the majority of your customers are converting from, or what channel is performing the best that week.
With an intuitive and easily accessible home for these insights, you’ll be able to quickly improve campaign performance when you want to make real-time optimizations.
Advertising Workspace snapshot
Beyond easier navigation, it’s also important to be able to tailor Analytics to the specific needs of your business, and even your role. To allow flexibility, we’re launching an entirely new set of customization options to reporting.
For the first time, within the Reports Workspace, users with admin access will be able to curate the Analytics interface and reports to suit the specific needs of their teams. Admins can make simple edits to existing reports or even create entirely new custom reports. They can also customize the left navigation to group reports into collections, and create custom overviews to highlight information. You can showcase these overviews in the Reports snapshot, the new homepage for the Reports Workspace.
Custom reporting options
Once admins set up customized reporting preferences for your organization, you can reduce time spent on reporting and surface the most relevant insights faster than ever before.
Better understand the value of your marketing
We know how valuable it is to have attribution reporting for your campaigns directly within Analytics, so we’re bringing new cross-platform attribution capabilities into the Advertising Workspace.
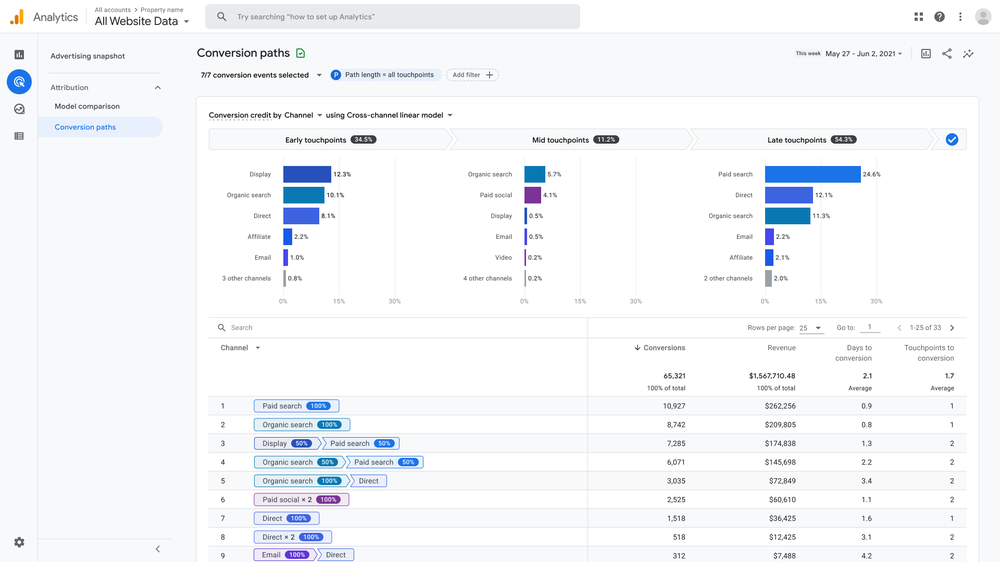
Data-driven attribution models will soon be available in all Google Analytics 4 properties, so you can use Google’s machine learning to understand the contribution of each touchpoint in your marketing funnel, alongside your other customer journey insights. We’ve also introduced two new attribution reports: the Conversion Paths report and Model Comparison report.
Similar to Multi-Channel Funnels in Universal Analytics properties, the Conversion Paths report allows you to view the customer journey by channel, assigning credit to touchpoints from when your customers first arrive to your site or app through conversion, based on a selected attribution model. It also includes a new conversion credit visualization that helps you understand your ROI by channel.
Conversion Paths report in the Advertising Workspace
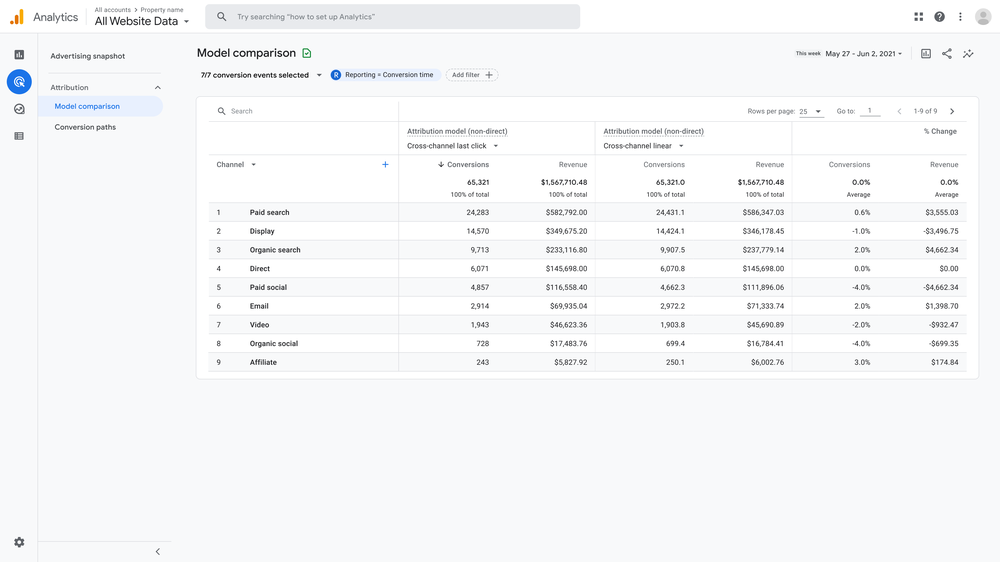
The Model Comparison report allows you to assess campaign performance using various attribution models, and compare how each affects the value of your marketing channels so you can determine which model best suits the needs of your business.
Model Comparison report in the Advertising Workspace
Prepare your measurement foundation for the future
The new Google Analytics will help ensure your measurement foundation is reliable and ready to meet the demands of an evolving ecosystem.
Get started with Google Analytics 4 properties today, and stay tuned for more enhancements coming soon.
In the United States, almost half of our food supply is wasted. That’s enough to feed everyone who experiences food insecurity four times over. “In a lot of ways hunger is not a supply problem, it’s a distribution problem,” says Leah Lizarondo, cofounder and CEO of 412 Food Rescue, a Pittsburgh-based nonprofit organization seeking to close the gap between food surplus and food scarcity.
In order to successfully achieve their mission to reduce hunger by redirecting surplus food to people experiencing food insecurity, Leah and her team need to recruit volunteers to download the Food Rescue Hero app and complete a local food pickup and delivery, becoming what they call “Food Rescue Heroes.” As a growing nonprofit organization, 412 Food Rescue has limited resources, though, and relies on technology to save time and invest in the right places.
Historically, measurement across 412 Food Rescue’s digital touchpoints had been a challenge for the nonprofit. Key data was siloed between their website and app, making it time intensive to get a complete understanding of how people were engaging with the organization online. With help from their digital analytics partner Bounteous, 412 Food Rescue turned to the new Google Analytics.
The new Google Analytics allows us to look at our data across platforms — web and app — to understand the full journey of our users. We’ve been able to cut our reporting time by 50%.Sara Swaney Director of Advancement, 412 Food Rescue
With that time savings, the team at 412 Food Rescue has been able to improve their marketing and focus on engaging more volunteers in the community.
“In order to recruit more volunteers, we needed to know where people were learning about 412 Food Rescue,” Swaney says. With a view of user engagement across platforms and devices, 412 Food Rescue was able to easily discern where the majority of its volunteers discover the organization, and what their typical journey is to get started. The team was able to see that new users are most likely to accept a Food Rescue and become volunteers within 48 hours of downloading the app. As a result, they adjusted their social media campaigns to drive app downloads on Mondays and Tuesdays, when most Food Rescues are typically posted in the app. By facilitating Food Rescues that users can immediately act on upon downloading the app, 412 Food Rescue was able to improve the user journey and convert more users to volunteers.
Automated insights introduce a new set of learnings
With automated insights generated through machine learning, 412 Food Rescue has been able to save time analyzing data and spend more time taking action. They learned, for example, that there was a dip in volunteer engagement on weekends, an insight that had gone unnoticed. Because they had been proactively alerted to the change in Analytics, they were able to quickly respond by increasing their marketing efforts on weekends to boost engagement and address the demand for local deliveries on those days.
Greater impact despite limited resources
Even without a dedicated analytics team, 412 Food Rescue is able to easily get a deep understanding of their data and use it to shift their marketing strategy, grow their network of Food Rescue Heroes, and secure further investment to ultimately expand to more cities and achieve their mission to end food waste and hunger.
Posted by Erica Hanson, Global Program Manager, Google Developer Student Clubs
Stevens Institute of Technology’s Google Developer Student Club. Names left to right: Tim Leonard, Will Escamilla, Rich Bilotti, Justin O'Boyle, Luke Mizus, and Rachael Kondra
The Google Developer Student Club at the Stevens Institute of Technology built their own website that makes local government data user friendly for voters in local districts. The goal: Take obscure budget and transportation information, display it via an easy-to-understand UI, and help voters become more easily informed.
When Tim Leonard first moved to Hoboken, New Jersey to start school at the Stevens Institute of Technology, he was interested in anything but government. A computer science major with a deep interest in startups, one was more likely to find him at a lecture on computational structures than on political science.
However, as the founder of the Google Developer Student Club (DSC) chapter at his university, Tim and his fellow classmates had the opportunity to make the trip into New York City to attend a developer community meetup with Ralph Yozzo, a community organizer from Google Developer Groups (GDG) NYC. While Ralph had given several talks on different technologies and programming techniques, this time he decided to try something new: Government budgets.
A slide from Ralph’s presentation
Titled “Why we should care about budgets,” Ralph’s talk to the young programmers focused on why tracking government spending in their community matters. He further explained how public budgets fund many parts of our lives - from getting to work, to taking care of our health, to going to a good school. However, Ralph informed them that while there are currently laws that attempt to make this data public, a platform that makes this information truly accessible didn’t exist. Instead, most of this information is tucked away in different corners of the internet; unorganized, and hard to understand.
Tim soon realized programming could be the solution and that his team had the chance to grow in a whole new way, outside of the traditional classroom setting. With Ralph’s encouragement, Tim and his team started thinking about how they could build a platform to collect all of this data, and provide a UI that’s easy for any user to interact with. By creating a well-organized website that could pull all of this local information, streamline it, and produce easy-to-understand graphics, the DSC Stevens team imagined they could have an impact on how voters inform themselves before casting their ballots at local elections.
“What if we had a technical approach to local government? Where our site would have actionable metrics that held us accountable for getting information out to the public.”
Tim thought if local voters could easily understand how their representatives were spending their community’s money, they could use it as a new framework to decide how to vote. The next step was to figure out the best way to get started.
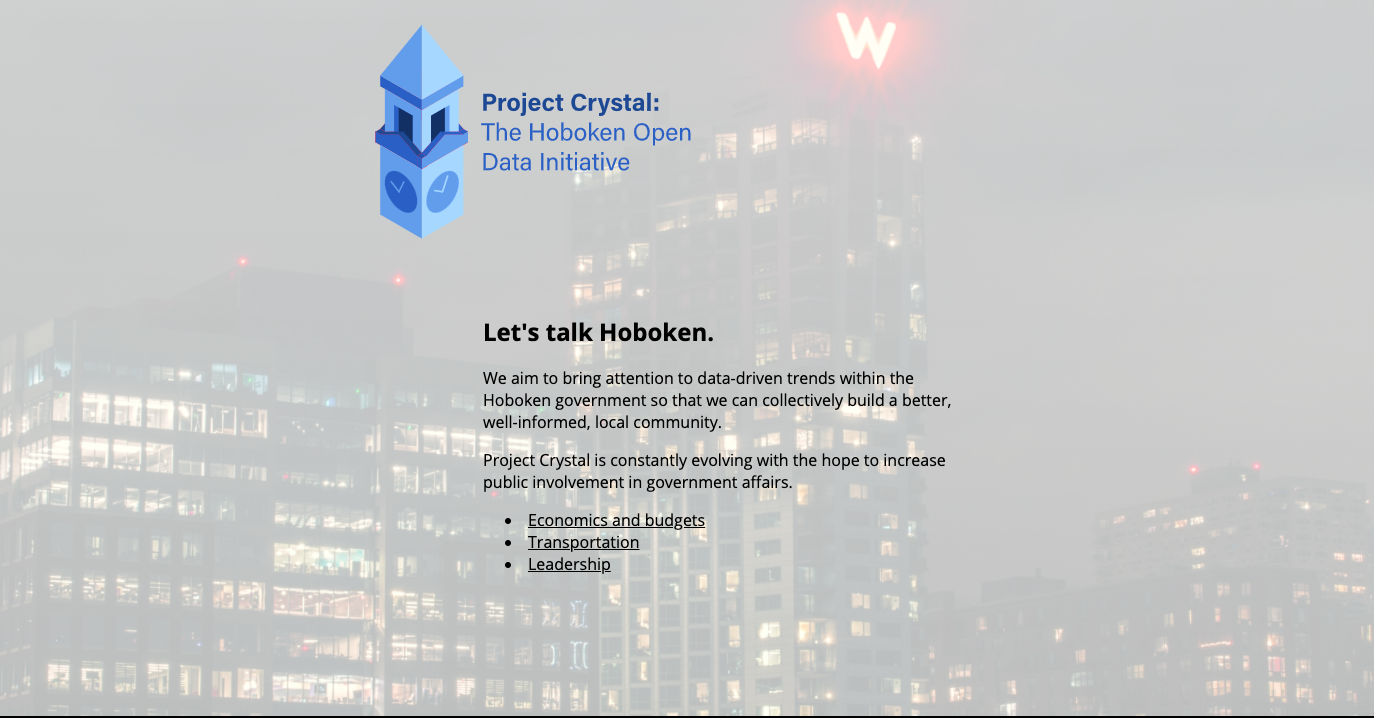
An image from the demo site
The DSC Stevens team quickly agreed that their goal should be to build a website about their own city, Hoboken. They named it “Project Crystal” and started taking Google App Engine courses and conducting Node.js server run throughs. With the data they would eventually store and organize, they also dove into Google Cloud demos and workshops on Google Charts. They were determined to build something that would store public information in a different way.
“Bounce rates and click through metrics ensure we evaluate our site like a startup. Instead of selling a product, our platform would focus on getting people to interact with the data that shapes their everyday lives.”
After participating in different courses on how to use Google Cloud, Maps, and Charts, they finally put it all together and created the first version of their idea - an MVP site, built to drive user engagement, that would serve as their prototype.
A video explaining the Project Crystal website
Complete with easy-to-understand budget charts, contact information for different public officials, and maps to help users locate important services, the prototype site has been their first major step in turning complicated data into actionable voting information. Excited about their progress, Tim wants to eventually host the site on Google Cloud so his team can store more data and offer the platform to local governments across the country.
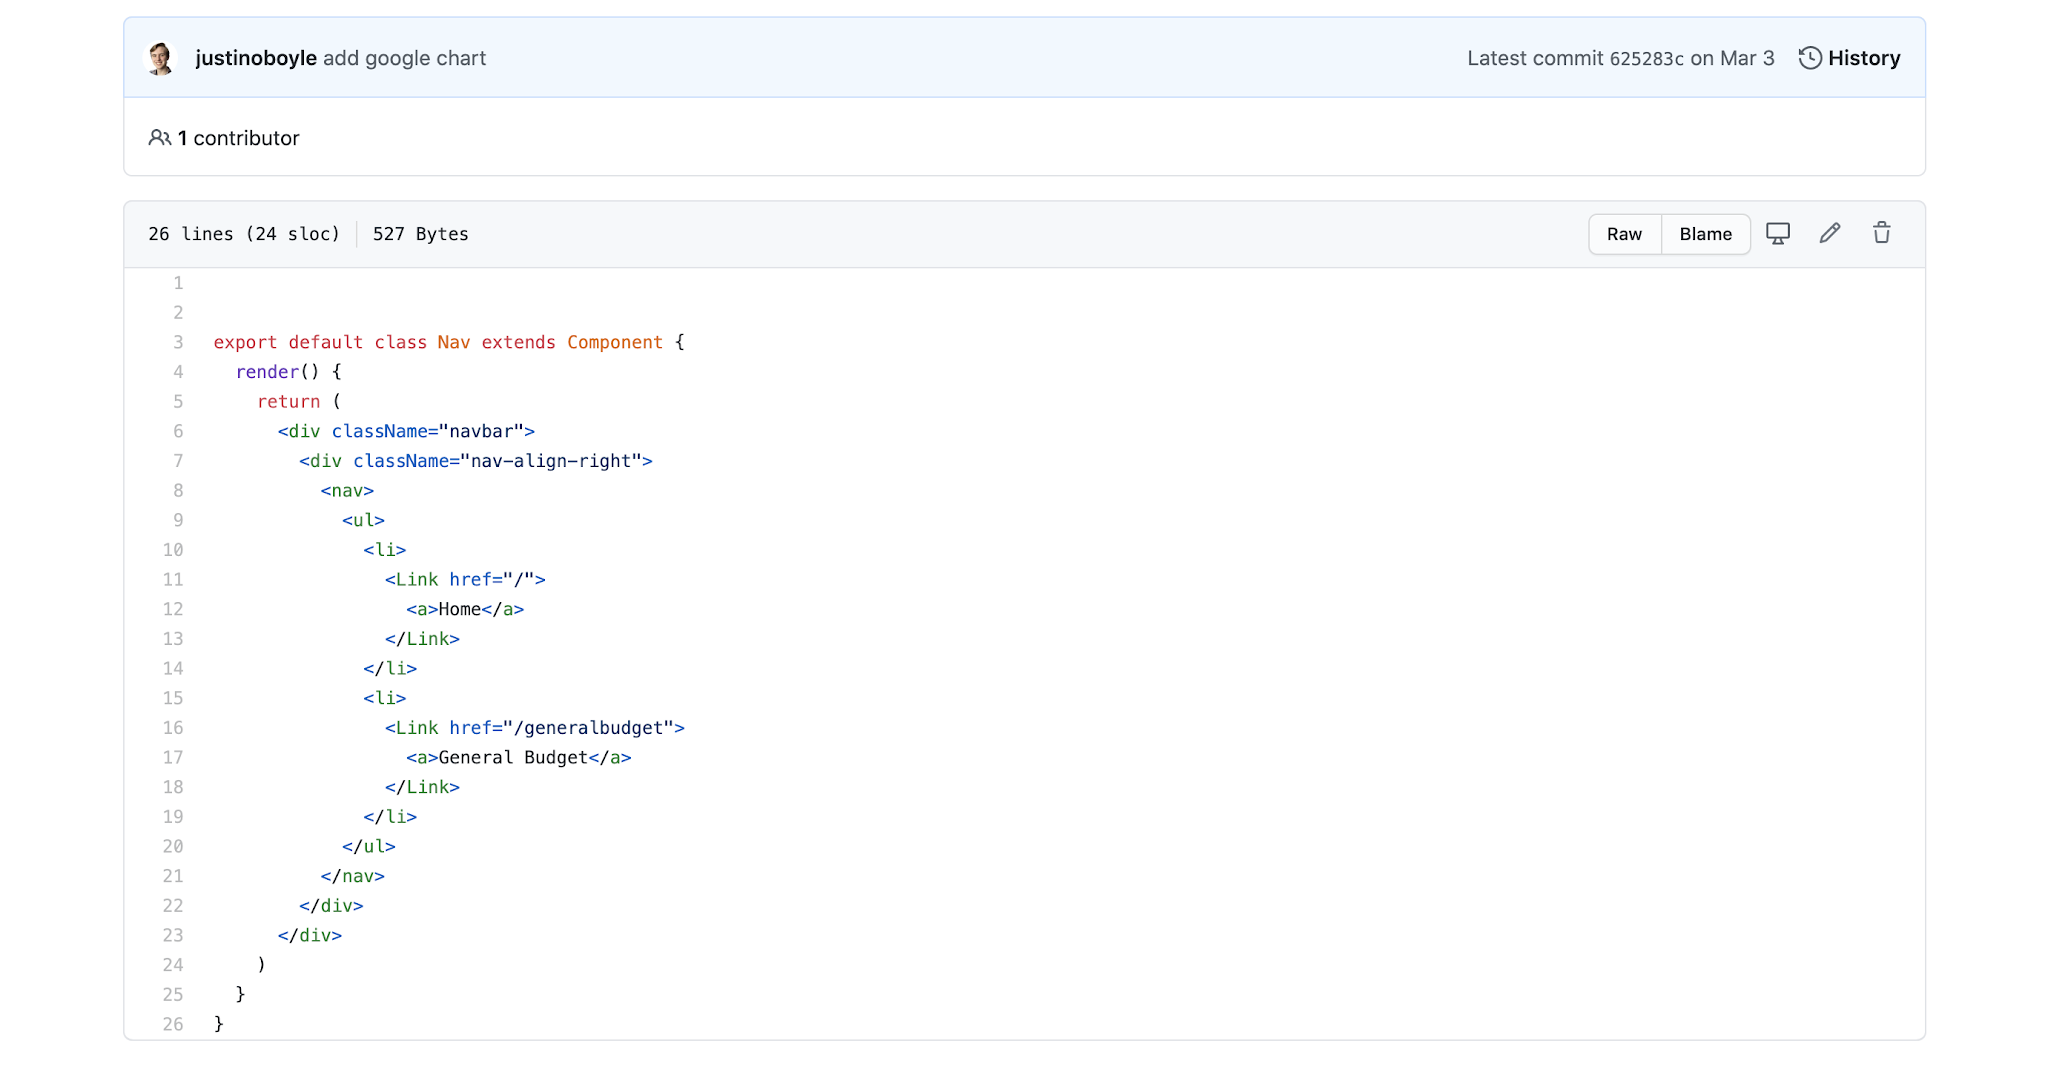
Image of the DSC Steven's team adding Google Charts to their demo site
The DSC Stevens team agrees, access to resources like Project Crystal could change how we vote. They hope with the right technical solutions around data, voters will be better informed, eager to ask more of their representatives, and more willing to participate in the day-to-day work of building their communities, together.
“Our advice to other student developers is to find outlets, like DSC, that enable you to think about helping others. For us, it was figuring out how to use our Google Cloud credits for good.”
Want to start a project of your own? If you’re a university student, join a Developer Student Club near you. If you’re a professional, find the right Google Developer Group for you.
With free measurement tools from Google, you can get insights into how customer behavior has changed due to COVID-19 and then take action to update your marketing strategy. Read more to learn about how to get started, and for specific tips to help your business navigate the coming months.
Understand the impact of your Google media
If you’re running marketing campaigns to drive visits to your website or app, it’s important for these visits to turn into sales. Attribution in Google Ads helps you understand the paths people take to complete a conversion, and then award credit for that conversion to different ads, clicks, and factors along the way.
We recently launched a new look for attribution reports in Google Ads that helps you quickly see how customers interact with your marketing throughout the purchase cycle. This makes it easier for you to then take action in the areas that are driving results.
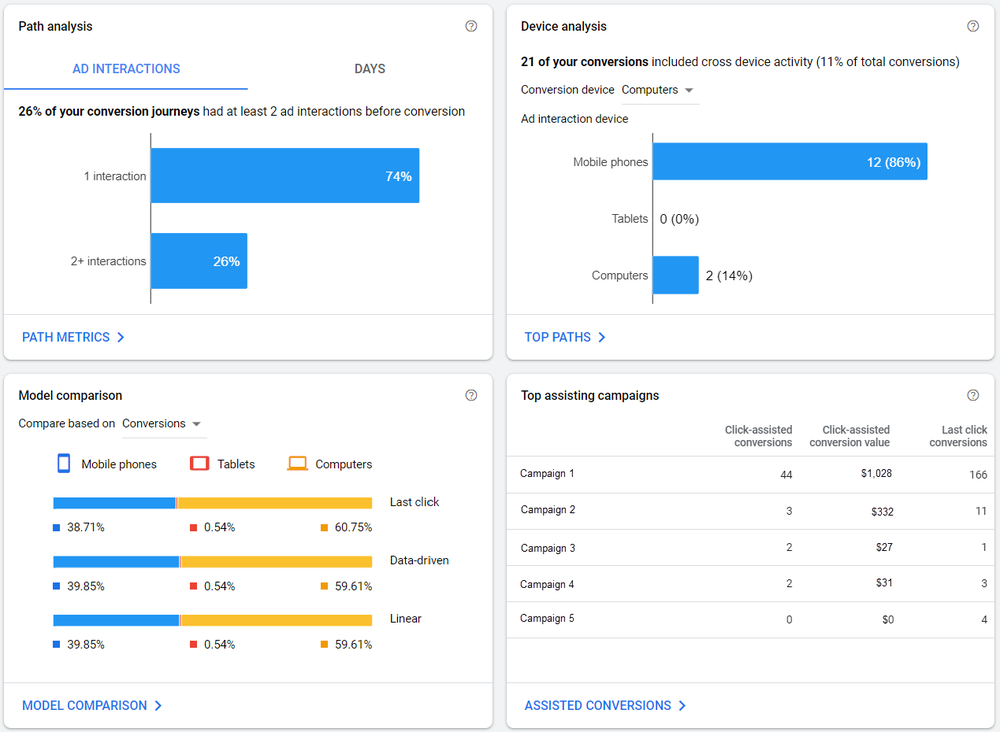
Revamped overview page that displays simplified and intuitive set of attribution reports.
Attribution models give you a deeper understanding of how your ads perform to help you decide where to allocate your marketing investment. One model, data-driven attribution, uses machine learning to determine how much credit to assign to each click on the customer journey, helping it better account for changes in customer behavior during turbulent times. For example, if you're working on behalf of a grocery store experiencing an increase in online orders from mobile devices, data-driven attribution may indicate that your mobile ads are having a greater impact on driving conversions than you realized, giving you the insight you need to optimize your campaign performance. If you’d like to learn which attribution model is right for your business, check out our official guide to attribution modeling.
Measure the online customer journey
The way that your customers interact with you may have changed dramatically in the past few months. Google Analytics can help you measure how those changes have impacted your business through your website or app.
We’ve put together a guide that lists a few reporting shortcuts in Analytics that can help you easily get useful insights. For example, if your business has shifted to online only, you need to make sure you’re converting as many site or app visits into sales as possible. You can use a shortcut to see your weekly conversion rate for the last 60 days and identify areas you might be able to improve upon – without digging through multiple reports in your account.
Visualize trends about your business
With so much changing so rapidly, you’ll want to understand how your business has been impacted. You can use Google Data Studio to help you create a report and visualize the changes that have happened over the past few months. Data Studio is easy to use, anyone on your team can quickly start using it.
If you’ve connected Data Studio to your marketing campaigns, you can use these curated marketing templates to monitor the performance of those campaigns. Let’s say you need to create a report that shows daily online sales from each of your Google Ads campaigns over the last 60 days. You can use one of those templates to quickly build the report and then identify which campaigns are performing best so you can re-allocate your marketing budget to those campaigns.
Keep your website updated
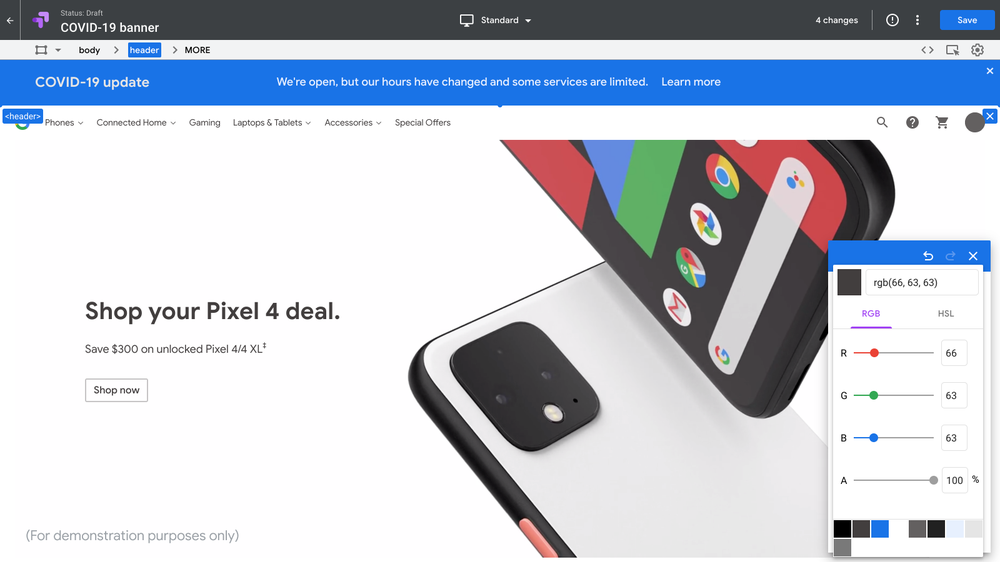
During this time, you might have different business hours or shipping policies. Instead of having to invest in an additional resource to update your website, you can do it for free with Google Optimize. When you log into your account, you can use a new feature to easily add a message for your customers to the top of your homepage. Either use our templated banner or customize the message by editing the color, size or text.
Use our template to post a banner at the top of your website with an important message.
And if you need to make other changes throughout your site, you can still continue to use Optimize to create site personalizations. Optimize users would normally be limited to running 10 site personalizations at once, but we’ve removed that restriction for the next 90 days, until July 31.
All of these products and features are available for free today. We hope they are helpful as you navigate your business through changing times.
 Upgrade your Analytics 360 properties to Google Analytics 4 by March 2024 to preserve measurement and campaign performance.
 The Google Analytics 4 deadline is July 1, make your move before it’s too late and get AI-powered insights to improve your ROI.
 Showcasing how Mercedes-Benz Germany increased performance with data-driven attribution, and introducing new ways to see success with this model.