Tag Archives: sheets

An easy formula: 5 reasons to use Google Sheets

Import, export, email. Do it again. When it comes to data analysis, it’s easy to fall into routine. But no matter how much of a whiz you are at formulas or pivot tables, superb spreadsheet skills only take you so far if you’re working with multiple versions or outdated datasets.

On average, employees spend up to eight hours each week—an entire work day—searching for and consolidating information. What if businesses spent their time applying data insights instead of tracking them down?

We designed cloud-based tools, like Google Sheets, to make it easier to quickly organize and analyze information in one place. Here are five reasons why you should try using Sheets.

1. Your data always stays up to date.

Image 1 - Sheets

Working in the cloud means your data can easily stay up to date because information is automatically saved as it’s typed. Multiple team members can collaborate in real-time from their phone, tablet or computer (online and offline) and create a single source of truth for projects, like quarterly budgets.

Need personalization? No problem. You can look at the same data as your coworkers without disrupting their viewsort information to be in a specific order or hide sheets that you don’t need to see. If you’re worried about others mucking up your data, you can protect cells by setting custom share settings. Plus, you don’t have to worry about version control. You can see changes or revert to previous versions in File > Version History or by clicking on “All Changes Saved in Drive” at the top of your Sheet.

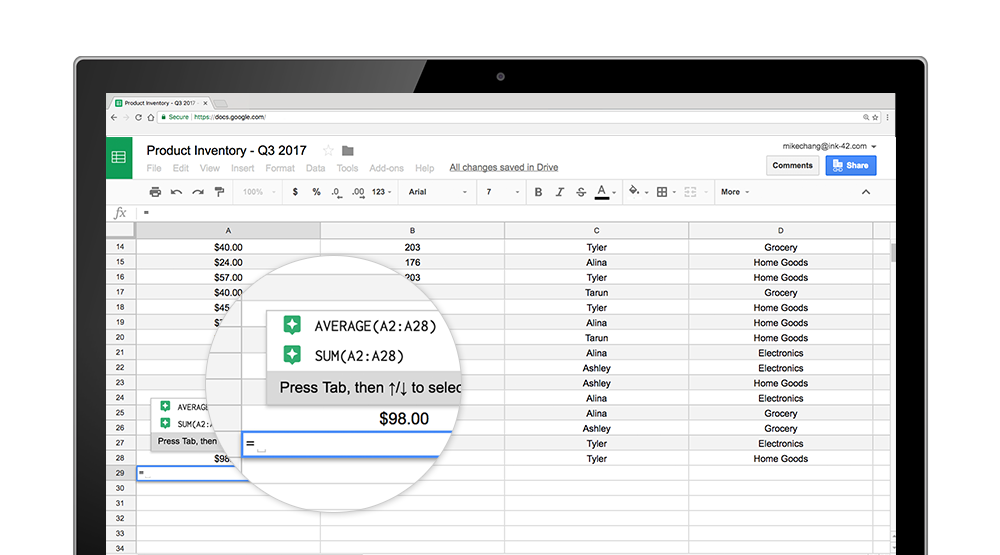
2. You can use Google’s artificial intelligence to speed up analysis.

Image 2 - Sheets

Powered by Google’s machine intelligence, Sheets does a lot of the heavy lifting for you when it comes to data analysis. You can ask a question about your data and Sheets will return an answer using natural language processing. Sheets also builds chartssuggests formulas and creates pivot tables for you.

Data gurus who want to take analysis a step further can sync Sheets to BigQuery to analyze information against large data sets. Check out this example or this example.

3. You can help keep your data secure.  

We built security features across G Suite to help you manage your most sensitive business information. Sheets is no exception.

Clicking “Share” in the upper righthand corner of your Sheet determines access settings for individual team members, so you stay in control of who can view, edit or comment on your documents. Additional IRM (Information Rights Management) controls allow you to easily disable options to download, copy or print spreadsheets, and you can set expiration dates if you need to suspend access to confidential information. Admins also have the power to restrict file sharing within an organization or to whitelist domains.

4. You can work the way you’re used to working.

We get it—you need tools that won’t interrupt work processes (especially if you’ve used those processes forever). That’s why we’ve baked in functionality that teams are used to using.

  • Let’s start with functions. You can use hundreds of functions that you’re used to working with, like VLOOKUP, SUMIFS and IPMT. We’ve also created unique-to-Sheets functions to help you crunch numbers in new ways, like: FILTER to quickly organize a spreadsheet according to an input, QUERY to pull specific results out of a central dataset or GOOGLEFINANCE to source data directly from Google Finance. Outside of functions, can also create pivot tables to analyze your data (or let Sheets do it for you.).
  • What about organization? Color cells using Conditional Formatting, create drop-down lists with Data Validation or freeze headers at the top of your sheet, to make your data presentation-friendly. Once your data is organized, you can visualize it in pie charts, bar charts, line charts—charts galore.
  • Editing on the fly. Sheets is available online and offline—and on desktop web browsers, and Android and iOS apps—which means your teams don’t have to stop working during business travel or when Wi-Fi is down.

5. You can automate processes.

When information is in one place, it’s easier to automate processes. Let’s say you need to order supplies for your office. Instead of emailing back-and-forth to coordinate purchases you can use G Suite apps instead.

NYT Sheets GIF

For example, say you’re an inventory manager at a retail company and you gather supply requests from your teams using Google Forms. You can import the Form responses into a Sheet  to keep a record of needs. If your Sheet is synced to Gmail with a script, it can send emails to relevant parties about requests automatically, so they can see and approve requests in one spot—the Sheet. Poof! No more unnecessary email clutter.

There are a ton of ways you can automate mundane tasks or speed up workflows. Check out how The New York Times used the Sheets API to report congressional votes quickly.

Let data drive your business decisions. Learn how you can access insights using Sheets or visit the G Suite Learning Center for specific product tips.

Pivot to the cloud: intelligent features in Google Sheets help businesses uncover insights

When it comes to data in spreadsheets, deciphering meaningful insights can be a challenge whether you’re a spreadsheet guru or data analytics pro. But thanks to advances in the cloud and artificial intelligence, you can instantly uncover insights and empower everyone in your organization—not just those with technical or analytics backgrounds—to make more informed decisions.

We launched "Explore" in Sheets to help you decipher your data easily using the power of machine intelligence, and since then we’ve added even more ways for you to intelligently visualize and share your company data. Today, we’re announcing additional features to Google Sheets to help businesses make better use of their data, from pivot tables and formula suggestions powered by machine intelligence, to even more flexible ways to help you analyze your data.

Easier pivot tables, faster insights

Many teams rely on pivot tables to summarize massive data sets and find useful patterns, but creating them manually can be tricky. Now, if you have data organized in a spreadsheet, Sheets can intelligently suggest a pivot table for you.


In the Explore panel, you can also ask questions of your data using everyday language (via natural language processing) and have the answer returned as a pivot table. For example, type “what is the sum of revenue by salesperson?” or “how much revenue does each product category generate?” and Sheets can help you find the right pivot table analysis.

GIF

In addition, if you want to create a pivot table from scratch, Sheets can suggest a number of relevant tables in the pivot table editor to help you summarize your data faster.

Suggested formulas, quicker answers

We often use basic spreadsheet formulas like =SUM or =AVERAGE for data analysis, but it takes time to make sure all inputs are written correctly. Soon, you may notice suggestions pop up when you type “=” in a cell. Using machine intelligence, Sheets provides full formula suggestions to you based on contextual clues from your spreadsheet data. We designed this to help teams save time and get answers more intuitively.

Formula suggestions in Sheets

Even more Sheets features

We’re also adding more features to make Sheets even better for data analysis:

  • Check out a refreshed UI for pivot tables in Sheets, and new, customizable headings for rows and columns.
  • View your data differently with new pivot table features. When you create a pivot table, you can “show values as a % of totals” to see summarized values as a fraction of grand totals. Once you have a table, you can right-click on a cell to “view details” or even combine pivot table groups to aggregate data the way you need it. We’re also adding new format options, like repeated row labels, to give you more fine-tuned control of how to present your summarized data.
  • Create and edit waterfall charts. Waterfall charts are good for visualizing sequential changes in data, like if you want to see the incremental breakdown of last year’s revenue month-by-month. Select Insert > Chart > Chart type picker and then choose “waterfall.”
  • Quickly import or paste fixed-width formatted data files. Sheets will automatically split up the data into columns for you without needing a delimiter, like commas, between data.

These new Sheets features will roll out in the coming weeks—see specific details here. To learn more about how G Suite can help your business uncover valuable insights and speed up efficiencies, visit the G Suite website. Or check out these tips to help you get started with Sheets.

Source: Google Cloud


Pivot to the cloud: intelligent features in Google Sheets help businesses uncover insights

When it comes to data in spreadsheets, deciphering meaningful insights can be a challenge whether you’re a spreadsheet guru or data analytics pro. But thanks to advances in the cloud and artificial intelligence, you can instantly uncover insights and empower everyone in your organization—not just those with technical or analytics backgrounds—to make more informed decisions.

We launched "Explore" in Sheets to help you decipher your data easily using the power of machine intelligence, and since then we’ve added even more ways for you to intelligently visualize and share your company data. Today, we’re announcing additional features to Google Sheets to help businesses make better use of their data, from pivot tables and formula suggestions powered by machine intelligence, to even more flexible ways to help you analyze your data.

Easier pivot tables, faster insights

Many teams rely on pivot tables to summarize massive data sets and find useful patterns, but creating them manually can be tricky. Now, if you have data organized in a spreadsheet, Sheets can intelligently suggest a pivot table for you.


In the Explore panel, you can also ask questions of your data using everyday language (via natural language processing) and have the answer returned as a pivot table. For example, type “what is the sum of revenue by salesperson?” or “how much revenue does each product category generate?” and Sheets can help you find the right pivot table analysis.

GIF

In addition, if you want to create a pivot table from scratch, Sheets can suggest a number of relevant tables in the pivot table editor to help you summarize your data faster.

Suggested formulas, quicker answers

We often use basic spreadsheet formulas like =SUM or =AVERAGE for data analysis, but it takes time to make sure all inputs are written correctly. Soon, you may notice suggestions pop up when you type “=” in a cell. Using machine intelligence, Sheets provides full formula suggestions to you based on contextual clues from your spreadsheet data. We designed this to help teams save time and get answers more intuitively.

Formula suggestions in Sheets

Even more Sheets features

We’re also adding more features to make Sheets even better for data analysis:

  • Check out a refreshed UI for pivot tables in Sheets, and new, customizable headings for rows and columns.
  • View your data differently with new pivot table features. When you create a pivot table, you can “show values as a % of totals” to see summarized values as a fraction of grand totals. Once you have a table, you can right-click on a cell to “view details” or even combine pivot table groups to aggregate data the way you need it. We’re also adding new format options, like repeated row labels, to give you more fine-tuned control of how to present your summarized data.
  • Create and edit waterfall charts. Waterfall charts are good for visualizing sequential changes in data, like if you want to see the incremental breakdown of last year’s revenue month-by-month. Select Insert > Chart > Chart type picker and then choose “waterfall.”
  • Quickly import or paste fixed-width formatted data files. Sheets will automatically split up the data into columns for you without needing a delimiter, like commas, between data.

These new Sheets features will roll out in the coming weeks—see specific details here. To learn more about how G Suite can help your business uncover valuable insights and speed up efficiencies, visit the G Suite website. Or check out these tips to help you get started with Sheets.

Analyze your business data with Explore in Google Sheets, use BigQuery too

A few months back, we announced a new way for you to analyze data in Google Sheets using machine learning. Instead of relying on lengthy formulas to crunch your numbers, now you can use Explore in Sheets to ask questions and quickly gather insights. Check it out.

Quicker data → problems solved

When you have easier access to data—and can figure out what it means quickly—you can solve problems for your business faster. You might use Explore in Sheets to analyze profit from last year, or look for trends in how your customers sign up for your company’s services. Explore in Sheets can help you track down this information, and more importantly, visualize it.

Getting started is easy. Just click the “Explore” button on the bottom right corner of your screen in Sheets. Type in a question about your data in the search box and Explore responds to your query. Here’s an example of how Sheets can build charts for you.

Sheets Explore GIF

Syncing Sheets with BigQuery for deeper insights

For those of you who want to take data analysis one step further, you can sync Sheets with BigQuery—Google Cloud’s low cost data warehouse for analytics.

Compare publicly-available datasets in BigQuery, like U.S. Census Data or World Bank: Global Health, Nutrition, and Population data, to your company’s data in Sheets and gather information. For example, you can see how sales of your medical product compared with last year’s disease trends, or cross-reference average inflation prices in key markets of interest to your business.  

Check out this post to see how you might query an example.

Source: Google Cloud


Analyze your business data with Explore in Google Sheets, use BigQuery too

A few months back, we announced a new way for you to analyze data in Google Sheets using machine learning. Instead of relying on lengthy formulas to crunch your numbers, now you can use Explore in Sheets to ask questions and quickly gather insights. Check it out.

Analyze easily with Explore in Sheets | The G Suite Show

Quicker data → problems solved

When you have easier access to data—and can figure out what it means quickly—you can solve problems for your business faster. You might use Explore in Sheets to analyze profit from last year, or look for trends in how your customers sign up for your company’s services. Explore in Sheets can help you track down this information, and more importantly, visualize it.

Getting started is easy. Just click the “Explore” button on the bottom right corner of your screen in Sheets. Type in a question about your data in the search box and Explore responds to your query. Here’s an example of how Sheets can build charts for you.

Sheets Explore GIF

Syncing Sheets with BigQuery for deeper insights

For those of you who want to take data analysis one step further, you can sync Sheets with BigQuery—Google Cloud’s low cost data warehouse for analytics.

Compare publicly-available datasets in BigQuery, like U.S. Census Data or World Bank: Global Health, Nutrition, and Population data, to your company’s data in Sheets and gather information. For example, you can see how sales of your medical product compared with last year’s disease trends, or cross-reference average inflation prices in key markets of interest to your business.  

Check out this post to see how you might query an example.

Source: Google Cloud


How The New York Times used Google Sheets to report congressional votes

There’s a common phrase among reporters: “The news never sleeps.” This is why many news outlets rely on cloud-based productivity tools like Google Docs and Sheets to share information, check facts and collaborate in real time. And The New York Times is no exception.

In May 2017, the U.S. House of Representatives voted on a new health care law affecting millions of Americans. To report the news as fast as possible, The Times’ editorial team used Sheets to tally and display House votes in real time on NYTimes.com.


Engaging voters with the Sheets API

“People want to feel connected to the decisions their legislators make as soon as they make them,” said Tom Giratikanon,  a graphics editor at The Times. But rules in the House chamber make reporting on how every representative votes in real time difficult. Photography is restricted on the assembly floor, and there is a delay until all votes are displayed on the House website—a process that can sometimes take up to an hour.

To get around this lag, Giratikanon’s team used the Google Sheets API. The editorial team dispatched reporters to the chamber where they entered votes into a Google Sheet as they were shown on the vote boards. The sheet then auto-populated NYTimes.com using the Sheets API integration.

Says Giratikanon: “It’s easy to feel like decisions are veiled in the political process. Technology is a powerful way to bridge that gap. Sharing news immediately empowers our readers.”

It’s easy to feel like decisions are veiled in the political process. Technology is a powerful way to bridge that gap. Tom Giratikanon
Graphics Editor, The New York Times
House votes

How it worked

To prep, Giratikanon tested the Sheets integration ahead of the House vote. He created a sheet listing the names of legislators in advance, so his team could avoid typos when entering data on the day of the vote. Next, he set up the Sheet to include qualifiers. A simple “Y” or “N” indicated “yes” and “no” votes.

After a few practice rounds, Giratikanon’s team realized they could add even more qualifiers to better inform readers–like flagging outlier votes and reporting on votes by party (i.e., Democrats vs. Republicans). The editorial team researched how each of the 431 legislators were expected to vote in advance. They created a rule in Sheets to automatically highlight surprises. If a legislator went against the grain, the sheet highlighted the cell in yellow and the editorial team fact-checked the original vote to reflect this in the article. Giratikanon also set up a rule to note votes by party.

As a result, The Times, which has roughly 2 million digital-only subscribers, beat the House website, reporting the new healthcare bill results and informing readers who were eager to follow how their legislator voted. 

NYT GIF

Try G Suite APIs today 

You can use Sheets and other G Suite products to help speed up real-time reporting, no matter the industry. Get started using the Sheets API today or check out other G Suite APIs, like the Slides API, Gmail API or Calendar API.

How The New York Times used the Google Sheets API to report congressional votes in real time

There’s a common phrase among reporters: “The news never sleeps.” This is why many news outlets rely on cloud-based productivity tools like Google Docs and Sheets to share information, check facts and collaborate in real time. And The New York Times is no exception.

In May 2017, the U.S. House of Representatives voted on a new health care law affecting millions of Americans. To report the news as fast as possible, The Times’ editorial team used Sheets to tally and display House votes in real time on NYTimes.com.


Engaging voters with the Sheets API

“People want to feel connected to the decisions their legislators make as soon as they make them,” said Tom Giratikanon,  a graphics editor at The Times. But rules in the House chamber make reporting on how every representative votes in real time difficult. Photography is restricted on the assembly floor, and there is a delay until all votes are displayed on the House website—a process that can sometimes take up to an hour.

To get around this lag, Giratikanon’s team used the Google Sheets API. The editorial team dispatched reporters to the chamber where they entered votes into a Google Sheet as they were shown on the vote boards. The sheet then auto-populated NYTimes.com using the Sheets API integration.

Says Giratikanon: “It’s easy to feel like decisions are veiled in the political process. Technology is a powerful way to bridge that gap. Sharing news immediately empowers our readers.”

It’s easy to feel like decisions are veiled in the political process. Technology is a powerful way to bridge that gap. Tom Giratikanon Graphics Editor, The New York Times
House votes

How it worked

To prep, Giratikanon tested the Sheets integration ahead of the House vote. He created a sheet listing the names of legislators in advance, so his team could avoid typos when entering data on the day of the vote. Next, he set up the Sheet to include qualifiers. A simple “Y” or “N” indicated “yes” and “no” votes.

After a few practice rounds, Giratikanon’s team realized they could add even more qualifiers to better inform readers–like flagging outlier votes and reporting on votes by party (i.e., Democrats vs. Republicans). The editorial team researched how each of the 431 legislators were expected to vote in advance. They created a rule in Sheets to automatically highlight surprises. If a legislator went against the grain, the sheet highlighted the cell in yellow and the editorial team fact-checked the original vote to reflect this in the article. Giratikanon also set up a rule to note votes by party.

As a result, The Times, which has roughly 2 million digital-only subscribers, beat the House website, reporting the new healthcare bill results and informing readers who were eager to follow how their legislator voted. 

NYT GIF

Try G Suite APIs today 

You can use Sheets and other G Suite products to help speed up real-time reporting, no matter the industry. Get started using the Sheets API today or check out other G Suite APIs, like the Slides API, Gmail API or Calendar API.

Source: Google Cloud


How The New York Times used the Google Sheets API to report congressional votes in real time

There’s a common phrase among reporters: “The news never sleeps.” This is why many news outlets rely on cloud-based productivity tools like Google Docs and Sheets to share information, check facts and collaborate in real time. And The New York Times is no exception.

In May 2017, the U.S. House of Representatives voted on a new health care law affecting millions of Americans. To report the news as fast as possible, The Times’ editorial team used Sheets to tally and display House votes in real time on NYTimes.com.


Engaging voters with the Sheets API

“People want to feel connected to the decisions their legislators make as soon as they make them,” said Tom Giratikanon,  a graphics editor at The Times. But rules in the House chamber make reporting on how every representative votes in real time difficult. Photography is restricted on the assembly floor, and there is a delay until all votes are displayed on the House website—a process that can sometimes take up to an hour.

To get around this lag, Giratikanon’s team used the Google Sheets API. The editorial team dispatched reporters to the chamber where they entered votes into a Google Sheet as they were shown on the vote boards. The sheet then auto-populated NYTimes.com using the Sheets API integration.

Says Giratikanon: “It’s easy to feel like decisions are veiled in the political process. Technology is a powerful way to bridge that gap. Sharing news immediately empowers our readers.”

It’s easy to feel like decisions are veiled in the political process. Technology is a powerful way to bridge that gap. Tom Giratikanon Graphics Editor, The New York Times
House votes

How it worked

To prep, Giratikanon tested the Sheets integration ahead of the House vote. He created a sheet listing the names of legislators in advance, so his team could avoid typos when entering data on the day of the vote. Next, he set up the Sheet to include qualifiers. A simple “Y” or “N” indicated “yes” and “no” votes.

After a few practice rounds, Giratikanon’s team realized they could add even more qualifiers to better inform readers–like flagging outlier votes and reporting on votes by party (i.e., Democrats vs. Republicans). The editorial team researched how each of the 431 legislators were expected to vote in advance. They created a rule in Sheets to automatically highlight surprises. If a legislator went against the grain, the sheet highlighted the cell in yellow and the editorial team fact-checked the original vote to reflect this in the article. Giratikanon also set up a rule to note votes by party.

As a result, The Times, which has roughly 2 million digital-only subscribers, beat the House website, reporting the new healthcare bill results and informing readers who were eager to follow how their legislator voted. 

NYT GIF

Try G Suite APIs today 

You can use Sheets and other G Suite products to help speed up real-time reporting, no matter the industry. Get started using the Sheets API today or check out other G Suite APIs, like the Slides API, Gmail API or Calendar API.

How The New York Times used Google Sheets to report congressional votes

There’s a common phrase among reporters: “The news never sleeps.” This is why many news outlets rely on cloud-based productivity tools like Google Docs and Sheets to share information, check facts and collaborate in real time. And The New York Times is no exception.

In May 2017, the U.S. House of Representatives voted on a new health care law affecting millions of Americans. To report the news as fast as possible, The Times’ editorial team used Sheets to tally and display House votes in real time on NYTimes.com.


Engaging voters with the Sheets API

“People want to feel connected to the decisions their legislators make as soon as they make them,” said Tom Giratikanon,  a graphics editor at The Times. But rules in the House chamber make reporting on how every representative votes in real time difficult. Photography is restricted on the assembly floor, and there is a delay until all votes are displayed on the House website—a process that can sometimes take up to an hour.

To get around this lag, Giratikanon’s team used the Google Sheets API. The editorial team dispatched reporters to the chamber where they entered votes into a Google Sheet as they were shown on the vote boards. The sheet then auto-populated NYTimes.com using the Sheets API integration.

Says Giratikanon: “It’s easy to feel like decisions are veiled in the political process. Technology is a powerful way to bridge that gap. Sharing news immediately empowers our readers.”

It’s easy to feel like decisions are veiled in the political process. Technology is a powerful way to bridge that gap. Tom Giratikanon
Graphics Editor, The New York Times
House votes

How it worked

To prep, Giratikanon tested the Sheets integration ahead of the House vote. He created a sheet listing the names of legislators in advance, so his team could avoid typos when entering data on the day of the vote. Next, he set up the Sheet to include qualifiers. A simple “Y” or “N” indicated “yes” and “no” votes.

After a few practice rounds, Giratikanon’s team realized they could add even more qualifiers to better inform readers–like flagging outlier votes and reporting on votes by party (i.e., Democrats vs. Republicans). The editorial team researched how each of the 431 legislators were expected to vote in advance. They created a rule in Sheets to automatically highlight surprises. If a legislator went against the grain, the sheet highlighted the cell in yellow and the editorial team fact-checked the original vote to reflect this in the article. Giratikanon also set up a rule to note votes by party.

As a result, The Times, which has roughly 2 million digital-only subscribers, beat the House website, reporting the new healthcare bill results and informing readers who were eager to follow how their legislator voted. 

NYT GIF

Try G Suite APIs today 

You can use Sheets and other G Suite products to help speed up real-time reporting, no matter the industry. Get started using the Sheets API today or check out other G Suite APIs, like the Slides API, Gmail API or Calendar API.

Source: Drive