Tag Archives: Google Earth

Shedding light on solar potential in all 50 U.S. States

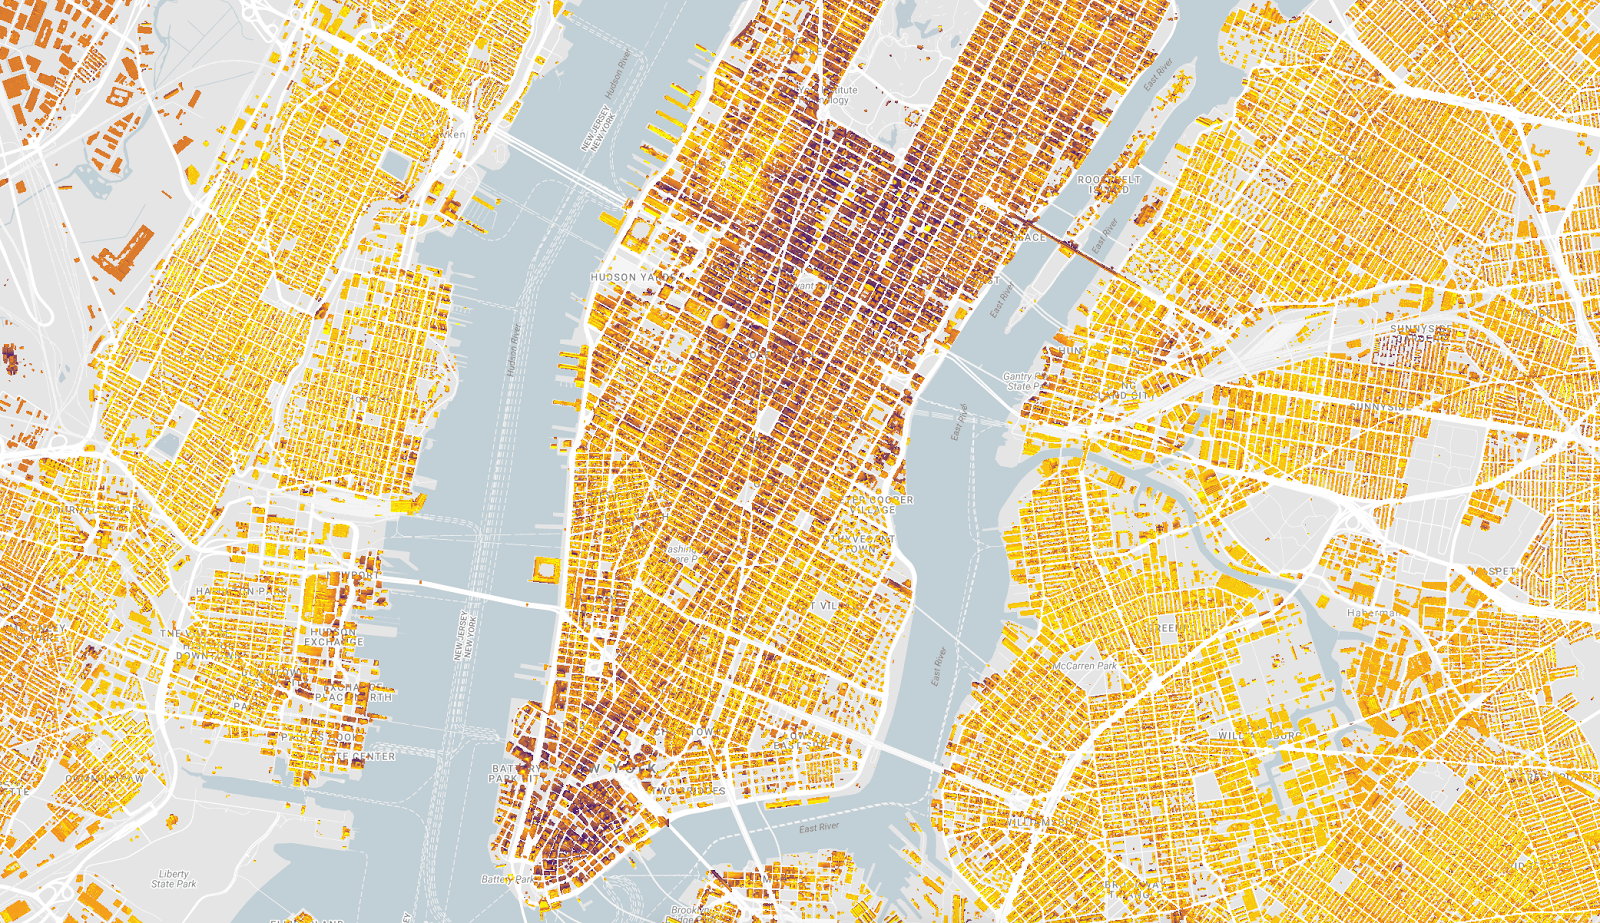
Solar power is an abundant, low carbon source of electricity, but historically it has been more expensive than traditional electricity. With solar costs dropping dramatically, many people are starting to ask: does solar power make sense on my rooftop? In my town or state?  Since its initial launch in 2015, Project Sunroof has used imagery from Google Maps and Google Earth, 3D modeling and machine learning to help answer those questions accurately and at scale. For every building included in the data, Project Sunroof calculates the amount of sunlight received by each portion of the roof over the course of a year, taking into account weather patterns, position of the sun in the sky at different times of year, and shade from nearby obstructions like trees and tall buildings. Finally, the estimated sunlight is translated into energy production using industry standard models for solar installation performance.

sunroof image 1
Project Sunroof county-level coverage from 2015 - 2017

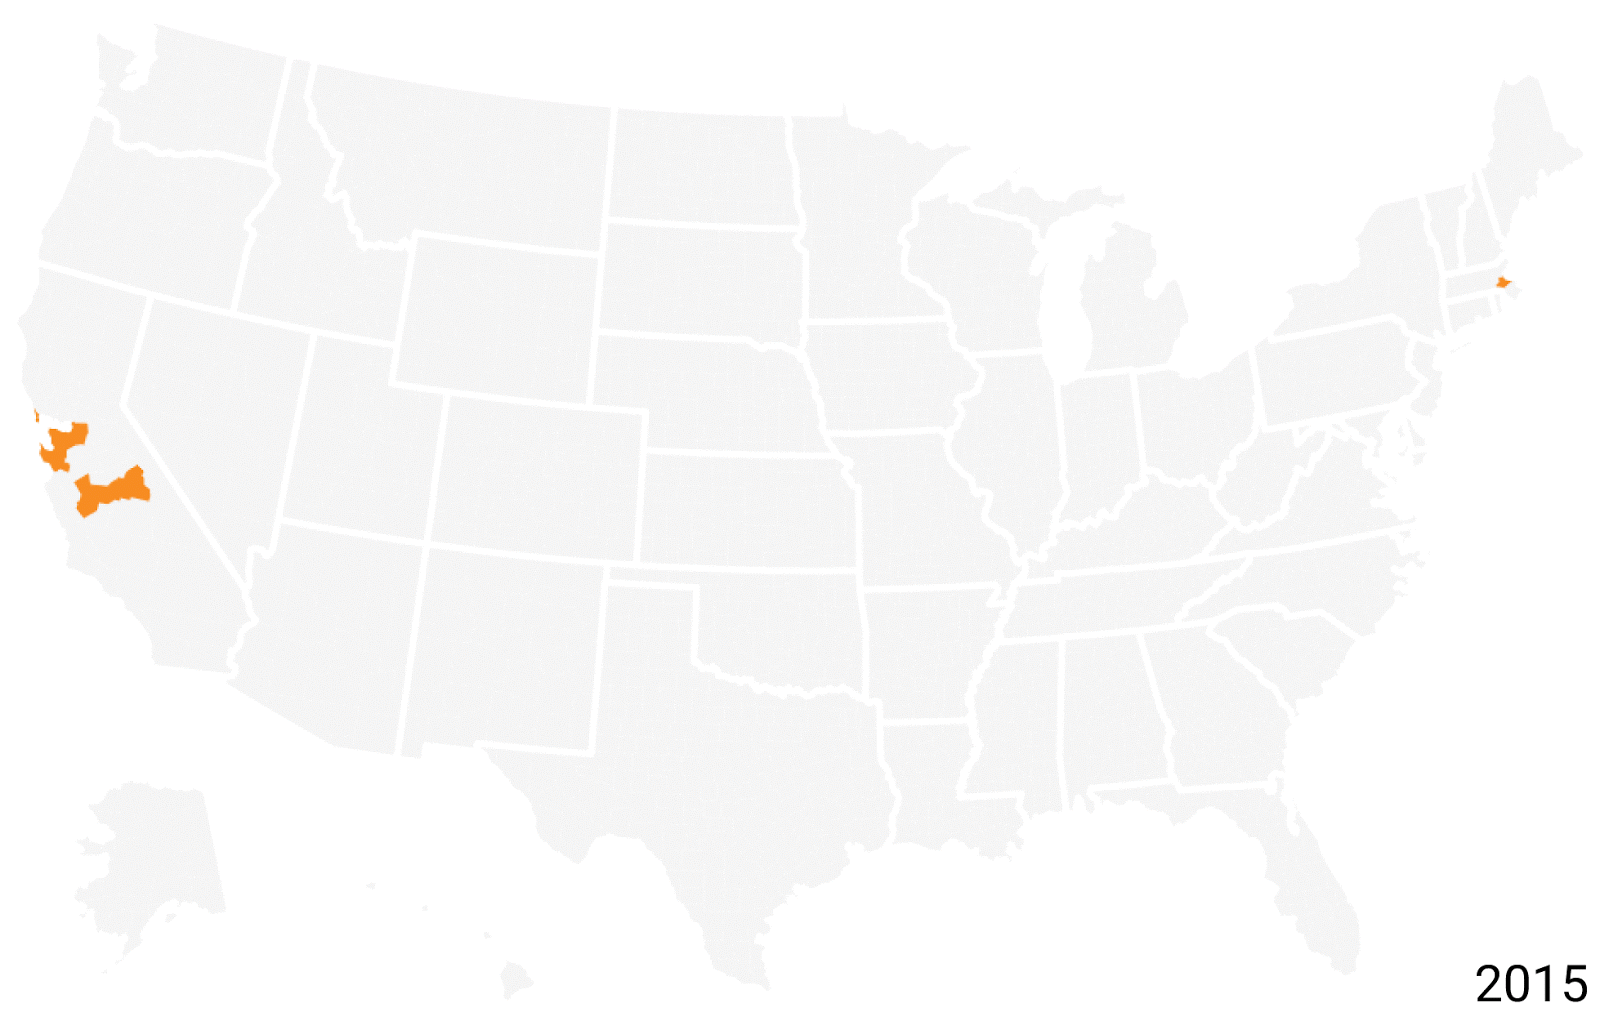
Today, Project Sunroof is helping answer those questions for more places than ever, with an expansion that brings Project Sunroof’s data coverage to every state in the U.S, with a total of approximately 60 million buildings analyzed. The expanded data reveals some fascinating insights about the solar energy opportunity nationwide:


  • Seventy-nine percent of all rooftops analyzed are technically viable for solar, meaning those rooftops have enough unshaded area for solar panels.

  • Over 90 percent of homes in Hawaii, Arizona, Nevada and New Mexico are technically viable, while states like Pennsylvania, Maine and Minnesota reach just above 60 percent viability.

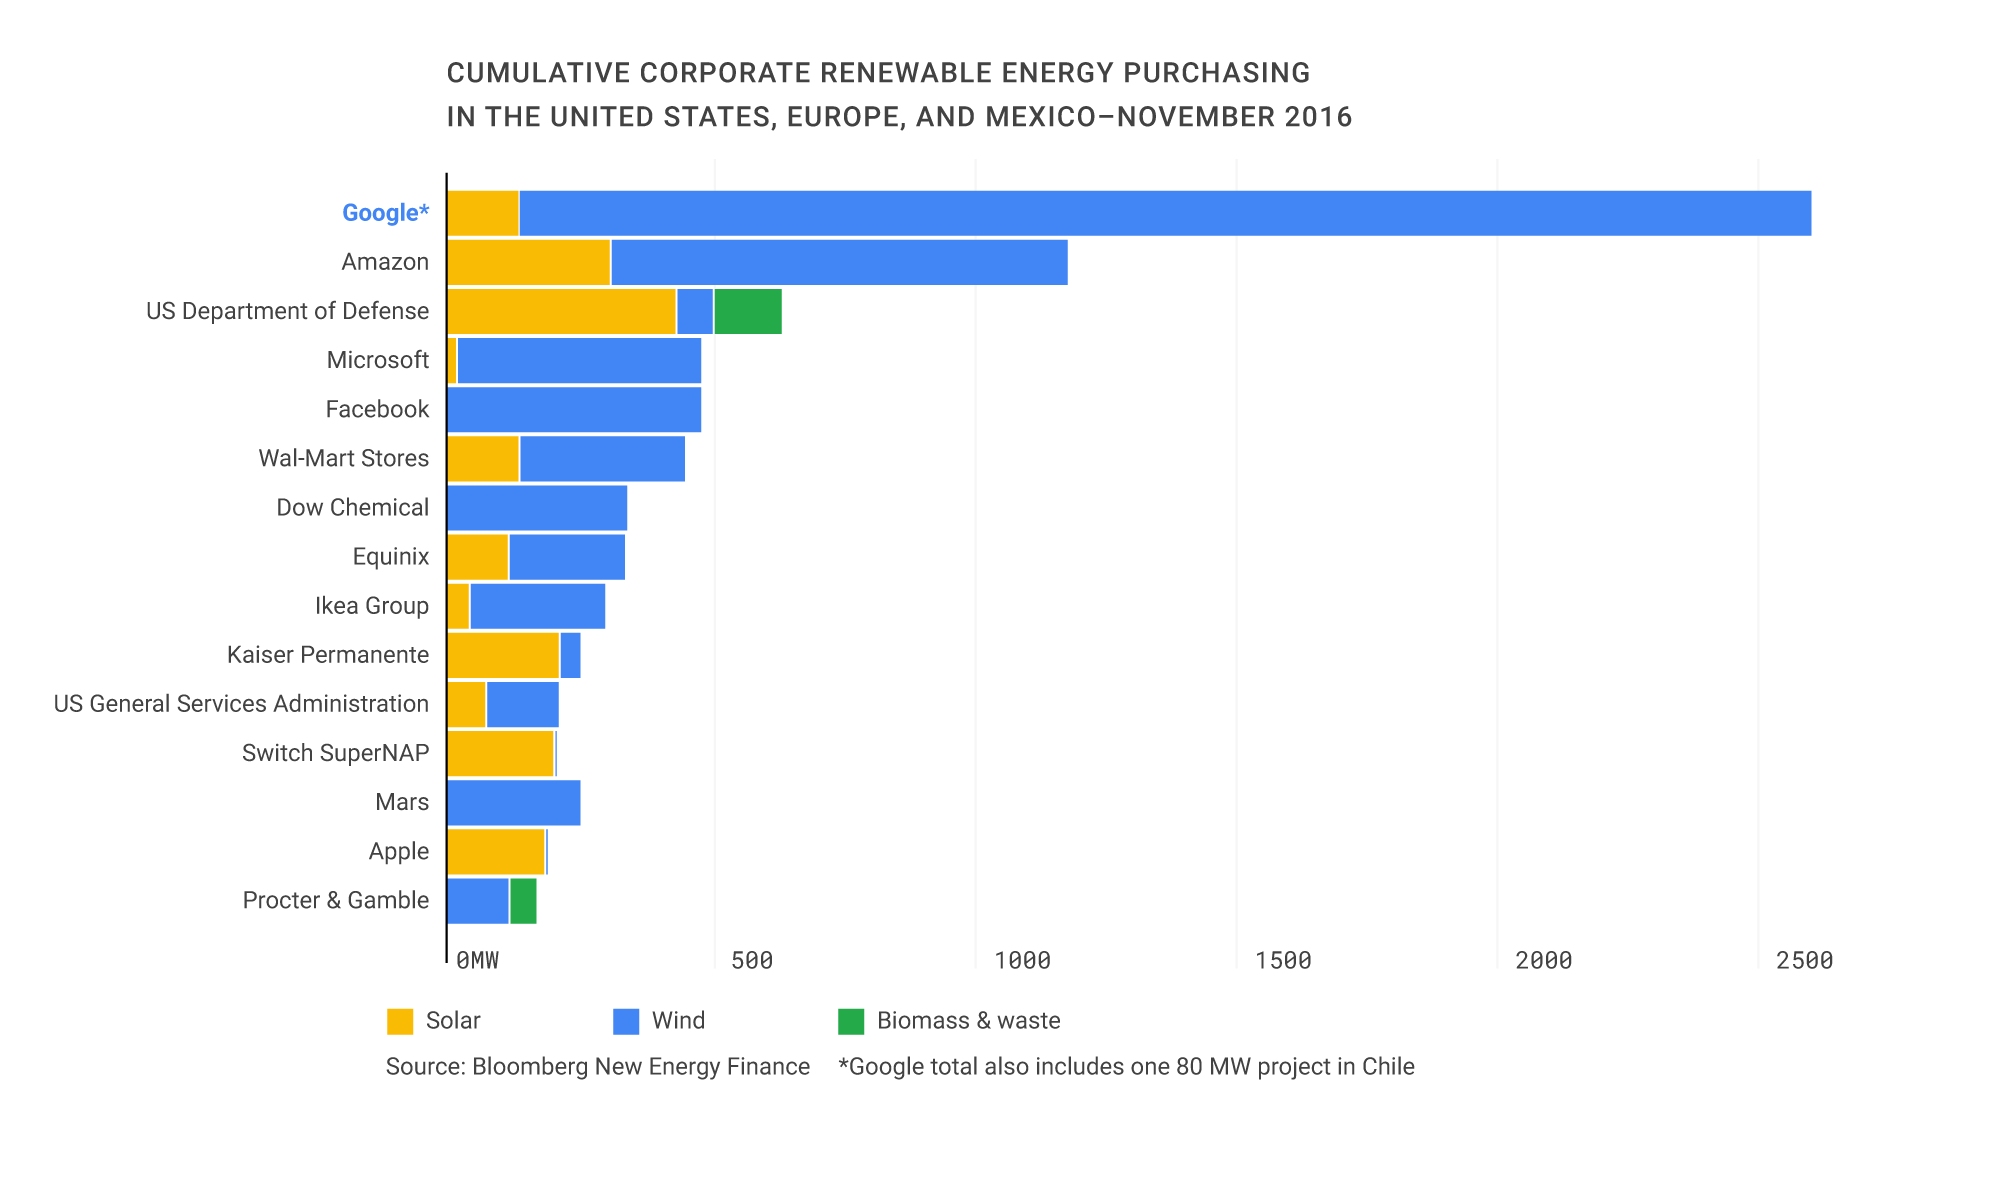
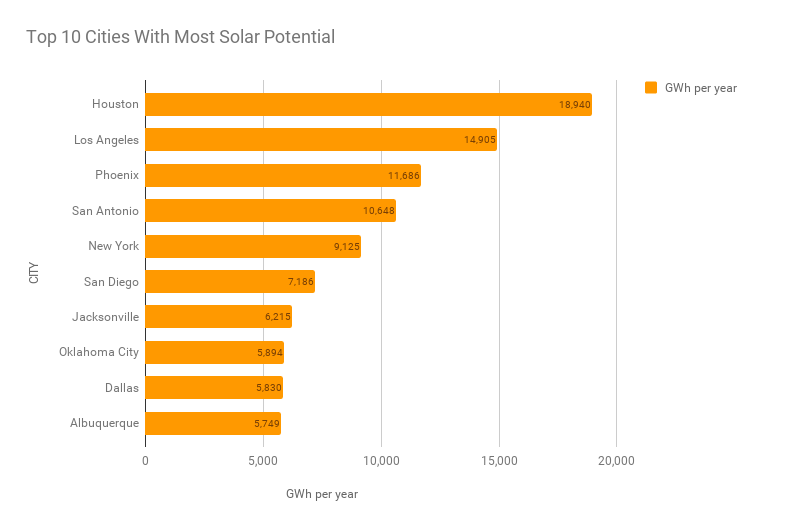
  • Houston, TX has the most solar potential of any U.S. city in the Project Sunroof data, with an estimated 18,940 gigawatt-hours (GWh) of rooftop solar generation potential per year. Los Angeles, Phoenix, San Antonio, and New York follow Houston for the top 5 solar potential cities -- see the full top 10 list in the chart below.
Sunroof image 2

To put the rooftop solar potential into perspective, the average U.S. home consumes 10,812 kilowatt-hours (kWh) a year according to EIA. There are one million kWh in one gigawatt-hour (GWh). One GWh of energy is enough to supply power to 90 homes for an entire year.

If the top ten cities above reached their full rooftop solar potential, they'd produce enough energy to power 8 million homes across the US.
Sunroof image 3
Sample of Project Sunroof solar energy potential map

This also means that if you've been thinking about going solar, there's a much better chance there's Project Sunroof data for your area. The Project Sunroof data explorer tool allows anyone to explore rooftop solar potential across U.S. zip codes, cities, counties and states. If you’re looking to learn about the solar and financial savings potential for your homes, the Project Sunroof savings estimator tool now covers 40x more buildings in the U.S. than when we launched it in 2015.

Sunroof Image 4
Visualization of solar potential at the Googleplex in Mountain View, CA.

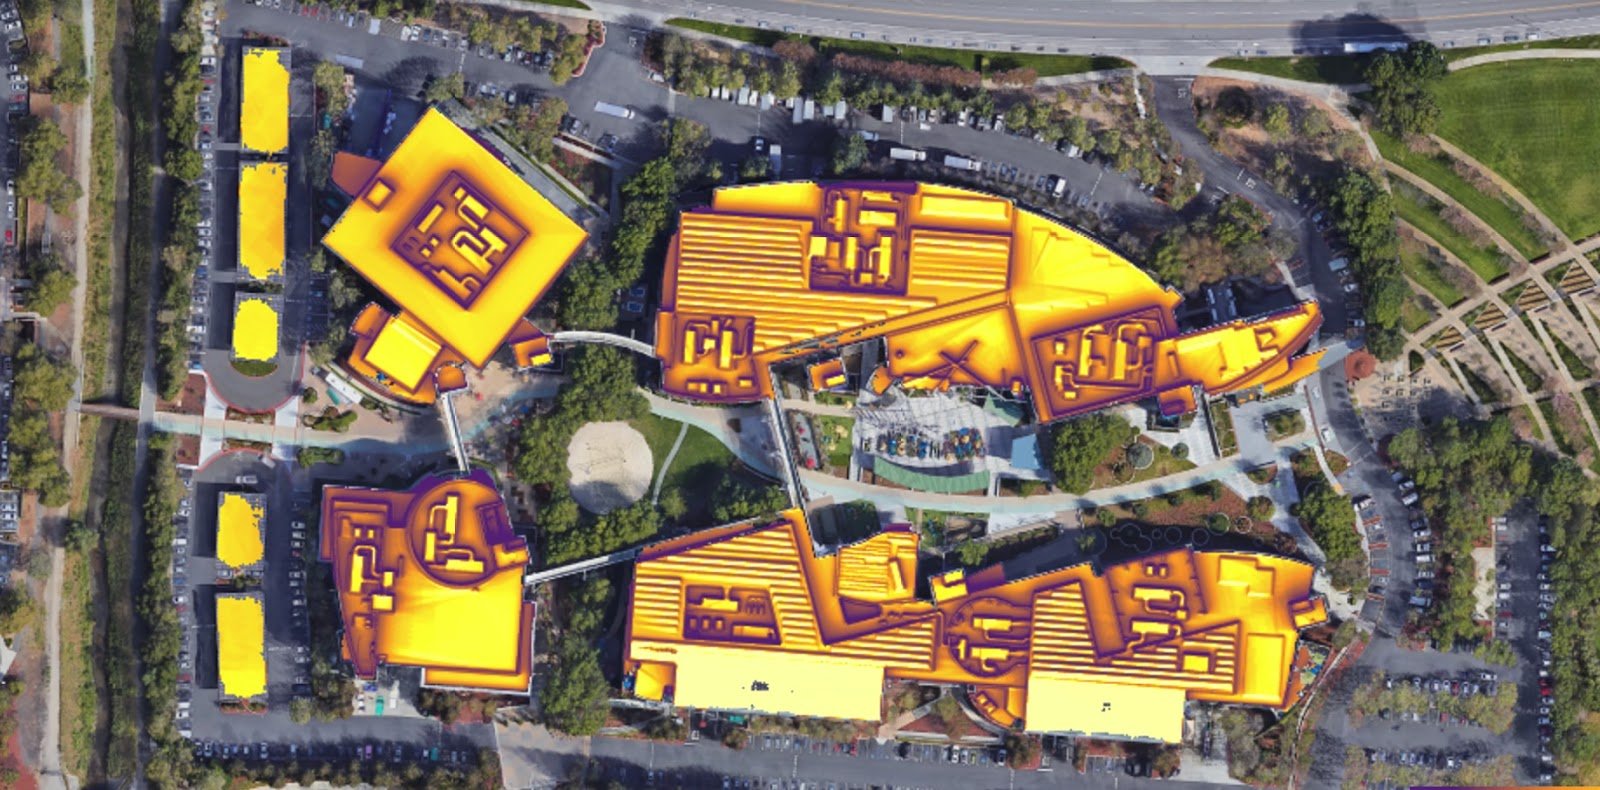
Almost 10 years ago, Google became an early adopter of rooftop solar, installing a 1.6 megawatt (MW) solar array at our headquarters in Mountain View, CA—the largest corporate solar installation of its kind at the time. Today, Project Sunroof combines Google’s longstanding interest in sustainability and renewable energy with unique, high-quality information about the potential of rooftop solar power. We’re proud to be expanding coverage of this project to help more people decide if solar makes sense for you.  

Open-sourcing Google Earth Enterprise

(originally posted on the Geo Developers blog)

We are excited to announce that we are open-sourcing Google Earth Enterprise (GEE), the enterprise product that allows developers to build and host their own private maps and 3D globes. With this release, GEE Fusion, GEE Server, and GEE Portable Server source code (all 470,000+ lines!) will be published on GitHub under the Apache2 license in March.
Screen Shot 2017-01-26 at 2.51.24 PM.png
Originally launched in 2006, Google Earth Enterprise provides customers the ability to build and host private, on-premise versions of Google Earth and Google Maps. In March 2015, we announced the deprecation of the product and the end of all sales. To provide ample time for customers to transition, we have provided a two year maintenance period ending on March 22, 2017. During this maintenance period, product updates have been regularly shipped and technical support has been available to licensed customers.

Feedback is important to us and we’ve heard from our customers that GEE remains in-use in mission-critical applications. Many customers have not transitioned to other technologies. Open-sourcing GEE allows our customer community to continue to improve and evolve the project in perpetuity. Note that the implementations for Google Earth Enterprise Client, Google Maps JavaScript® API V3 and Google Earth API will not be open sourced. The Enterprise Client will continue to be made available and updated. However, since GEE Fusion and GEE Server are being open-sourced, the imagery and terrain quadtree implementations used in these products will allow third-party developers to build viewers that can consume GEE Server Databases.

We’re thankful for the help of our GEE partners in preparing the codebase to be migrated to GitHub. It’s a lot of work and we cannot do it without them. It is our hope that their passion for GEE and GEE customers will serve to lead the project into its next chapter.

Looking forward, GEE customers can use Google Cloud Platform (GCP) instead of legacy on-premises enterprise servers to run their GEE instances. For many customers, GCP provides a scalable and affordable infrastructure as a service where they can securely run GEE. Other GEE customers will be able to continue to operate the software in disconnected environments. However, we believe that the advantages of incorporating even some of the workloads on GCP will become apparent (such as processing large imagery or terrain assets on GCP that can be downloaded and brought to internal networks, or standing up user-facing Portable Globe Factories).

Moreover, GCP is increasingly used as a source for geospatial data. Google’s Earth Engine has made available over a petabyte of raster datasets which are readily accessible and available to the public on Google Cloud Storage. Additionally, Google uses Cloud Storage to provide data to customers who purchase Google Imagery today. Having access to massive amounts of geospatial data, on the same platform as your flexible compute and storage, makes generating high quality Google Earth Enterprise Databases and Portables easier and faster than ever.

We will be sharing a series of white papers and other technical resources to make it as frictionless as possible to get open source GEE up and running on Google Cloud Platform. We are excited about the possibilities that open-sourcing enables, and we trust this is good news for our community. We will be sharing more information when we launch the code in March on GitHub. For general product information, visit the Google Earth Enterprise Help Center. Review the essential and advanced training for how to use Google Earth Enterprise, or learn more about the benefits of Google Cloud Platform.

Start with a line, let the planet complete the picture

Jeff Nusz, Data Arts Team

Take a break this holiday season and paint with satellite images of the Earth through a new experiment called Land Lines. The project lets you explore Google Earth images in unexpected ways through gesture. Earth provides the palette; your fingers, the paintbrush.
There are two ways to explore–drag or draw. "Draw" to find satellite images that match your every line. "Drag" to create an infinite line of connected rivers, highways and coastlines. Here's a quick demo:


Everything runs in real time in your phone's web browser without any servers. The responsiveness of the project is a result of using machine learning, data optimization, and vantage-point trees to analyze the images and store that data.

We preprocessed the images using a combination of Open CV's Structured Forests machine learning based edge detection and ImageJ's Ridge Detection library. This culled the initial dataset of over fifty thousand high res images down to just a few thousand selected for their presence of lines, as shown in the example below. What ordinarily would take days was completed in just a few hours.


Example output from the line detection processing. The dominant line is highlighted in red while secondary lines are highlighted in green.


In the drawing exploration, we stored the resulting data in a vantage-point tree. This enabled us to efficiently run gesture matching against all the images and have results appear in milliseconds.


An early example of gesture matching using vantage point trees, where the drawn input is on the right and the closest results on the left.


Another example of user gesture analysis, where the drawn input is on the right and the closest results on the left.


Built in collaboration with Zach Lieberman, Land Lines is an experiment in big visual data that explores themes of connection. We tried several machine learning libraries in our development process. The learnings from that experience can be found in the case study, while the project code is available open-source on Git Hub. Start with a line at g.co/landlines.

The nature of water: unveiling the most detailed view of water on Earth

In 1926, the Mississippi river flooded to its highest level in history, destroying towns and leaving hundreds of thousands homeless. Since then, dams and thousands of kilometers of levees have been built to control the mighty Mississippi. 60 years on, another effect of the historic flood is becoming apparent. As the river has become calmer, it now also carries a lot less of the sediment that created and replenished the delta. Without that, more than 13 thousand square kilometers of the delta -- an area 10 times the size of London -- is slowly slipping into the Gulf of Mexico. Once again the river is threatening to displace thousands and drown the fragile delta wetlands.

Mississippi delta gif
Mississippi delta sinking into the Gulf of Mexico. Blue is water, white is land, red shows areas of transition. (Source: EC JRC / Google)

The change of the Mississippi over decades is just one of the hundreds of stories of similarly dramatic change around the globe; from the draining of the Aral Sea in the Middle East for crops, to the effects of dam construction in China, or the impacts of the multi-year drought on the Western U.S.  Water has been shaping our planet since it was formed, and still plays a direct and crucial role in all of our lives.

Thanks to a partnership between the European Commission’s Joint Research Centre and Google, we can now get a view into the past three decades of water on the surface of Earth and see how stories like these have shaped the world over time, in unprecedented detail.   

This project has been a monumental undertaking and was made possible by new data processing methods, running the analysis on thousands of high performance computers at the same time. It took three years to download 1.8 petabytes of data from the USGS/NASA Landsat satellite program and prepare that for analysis. Each pixel in 3 million satellite images, going all the way back to 1984, was examined by a computer algorithm developed by the Joint Research Center running on the Google Earth Engine platform. More than 10 million hours of computing time was needed for this, roughly equivalent to a modern 2-core computer running day and night for 600 years.  

Karkheh River
Karkheh River in Iran backing up behind a dam from 1984 to 2015 (Source: EC JRC / Google)

The results for the first time allow us to map and measure changes in the water surface over time with a 30-meter accuracy, month-by-month, over 32 years. Here are some of our findings:  

  • 90 thousand square kilometers of water - the equivalent of half of the lakes in Europe - have vanished altogether. Over 200 thousand square kilometers of new, mostly man-made water bodies came into existence.

  • The continuing drying up of the Aral Sea in Uzbekistan and Kazakhstan accounts for the biggest loss in the world.

  • Iran and Afghanistan lost over a half, Iraq over a third of its water area.

  • Although the area covered by water in the U.S. has overall increased a little, a combination of drought and sustained demand for water have seen six western states, Arizona, California, Idaho, Nevada, Oregon, Utah, account for a third of the loss in U.S. water surface. 

Tibetan plateau
Lakes throughout the Tibetan Plateau have expanded in size over the past 30 years. (Source: EC JRC / Google)

The research findings and the maps, published today in the journal Nature, are available for you to explore on this new website.  The data are also freely available in Google Earth Engine for further research, use, and download.  These new maps, statistics and the stories of change they reveal provide essential information which can aid global water security, agricultural planning, disaster preparedness, public health, climate understanding and more, offering the most detailed view to date of one of our planet’s most vital resources.

With contributions from Alan Belward, Andrew Cottam and Jean-François Pekel, Joint Research Centre, European Commission

The nature of water: unveiling the most detailed view of water on Earth

In 1926, the Mississippi river flooded to its highest level in history, destroying towns and leaving hundreds of thousands homeless. Since then, dams and thousands of kilometers of levees have been built to control the mighty Mississippi. 60 years on, another effect of the historic flood is becoming apparent. As the river has become calmer, it now also carries a lot less of the sediment that created and replenished the delta. Without that, more than 13 thousand square kilometers of the delta -- an area 10 times the size of London -- is slowly slipping into the Gulf of Mexico. Once again the river is threatening to displace thousands and drown the fragile delta wetlands.

Mississippi delta gif
Mississippi delta sinking into the Gulf of Mexico. Blue is water, white is land, red shows areas of transition. (Source: EC JRC / Google)

The change of the Mississippi over decades is just one of the hundreds of stories of similarly dramatic change around the globe; from the draining of the Aral Sea in the Middle East for crops, to the effects of dam construction in China, or the impacts of the multi-year drought on the Western U.S.  Water has been shaping our planet since it was formed, and still plays a direct and crucial role in all of our lives.

Thanks to a partnership between the European Commission’s Joint Research Centre and Google, we can now get a view into the past three decades of water on the surface of Earth and see how stories like these have shaped the world over time, in unprecedented detail.   

This project has been a monumental undertaking and was made possible by new data processing methods, running the analysis on thousands of high performance computers at the same time. It took three years to download 1.8 petabytes of data from the USGS/NASA Landsat satellite program and prepare that for analysis. Each pixel in 3 million satellite images, going all the way back to 1984, was examined by a computer algorithm developed by the Joint Research Center running on the Google Earth Engine platform. More than 10 million hours of computing time was needed for this, roughly equivalent to a modern 2-core computer running day and night for 600 years.  

The results for the first time allow us to map and measure changes in the water surface over time with a 30-meter accuracy, month-by-month, over 32 years. Here are some of our findings:  

  • 90 thousand square kilometers of water - the equivalent of half of the lakes in Europe - have vanished altogether. Over 200 thousand square kilometers of new, mostly man-made water bodies came into existence.

  • The continuing drying up of the Aral Sea in Uzbekistan and Kazakhstan accounts for the biggest loss in the world.

  • Iran and Afghanistan lost over a half, Iraq over a third of its water area.

  • Although the area covered by water in the U.S. has overall increased a little, a combination of drought and sustained demand for water have seen six western states, Arizona, California, Idaho, Nevada, Oregon, Utah, account for a third of the loss in U.S. water surface. 

The research findings and the maps, published today in the journal Nature, are available for you to explore on this new website.  The data are also freely available in Google Earth Engine for further research, use, and download.  These new maps, statistics and the stories of change they reveal provide essential information which can aid global water security, agricultural planning, disaster preparedness, public health, climate understanding and more, offering the most detailed view to date of one of our planet’s most vital resources.

With contributions from Alan Belward, Andrew Cottam and Jean-François Pekel, Joint Research Centre, European Commission

We’re set to reach 100% renewable energy — and it’s just the beginning

Every year people search on Google trillions of times; every minute people upload more than 400 hours of YouTube videos. All of that takes an incredible amount of processing power — which means energy. Our engineers have spent years perfecting Google's data centers, making them 50 percent more energy efficient than the industry average. But we still need a lot of energy to power the products and services that our users depend on. We began purchasing renewable energy to reduce our carbon footprint and address climate change — but it also makes business sense.

I’m thrilled to announce that in 2017 Google will reach 100% renewable energy for our global operations — including both our data centers and offices. We were one of the first corporations to create large-scale, long-term contracts to buy renewable energy directly; we signed our first agreement to purchase all the electricity from a 114-megawatt wind farm in Iowa, in 2010. Today, we are the world’s largest corporate buyer of renewable power, with commitments reaching 2.6 gigawatts (2,600 megawatts) of wind and solar energy. That’s bigger than many large utilities and more than twice as much as the 1.21 gigawatts it took to send Marty McFly back to the future.

Google PPA Chart

To reach this goal we’ll be directly buying enough wind and solar electricity annually to account for every unit of electricity our operations consume, globally. And we're focusing on creating new energy from renewable sources, so we only buy from projects that are funded by our purchases.

Over the last six years, the cost of wind and solar came down 60 percent and 80 percent, respectively, proving that renewables are increasingly becoming the lowest cost option. Electricity costs are one of the largest components of our operating expenses at our data centers, and having a long-term stable cost of renewable power provides protection against price swings in energy.

Our 20 renewable energy projects also help support communities, from Grady County, OK, to Rutherford County, NC, to the Atacama Region of Chile to municipalities in Sweden. To date, our purchasing commitments will result in infrastructure investments of more than $3.5 billion globally, about two-thirds of that in the United States. These projects also generate tens of millions of dollars per year in revenue to local property owners, and tens of millions more to local and national governments in tax revenue.

So, we’re on track to match our global energy consumption on an annual basis by next year. But this is just the first step. As we look to the immediate future, we’ll continue to pursue these direct contracts as we grow, with an even greater focus on regional renewable energy purchases in places where we have data centers and significant operations. Since the wind doesn’t blow 24 hours a day, we’ll also broaden our purchases to a variety of energy sources that can enable renewable power, every hour of every day. Our ultimate goal is to create a world where everyone — not just Google — has access to clean energy. For more on these next steps, read our white paper.   

google_ppa.jpg
How Google purchases and uses renewable energy.

Operating our business in an environmentally sustainable way has been a core value from the beginning, and we’re always working on new ideas to make sustainability a reality — like enabling the building of healthy workplaces and creating a living, breathing dashboard for the planet. We’ve reported our carbon footprint and published information on our sustainability programs for many years in white papers, blog posts, and on our website. Now, we’ve put all this information together in a new Environmental Report.

You can also check out our new environment website, where we share stories of how we are finding new ways to do more while using less. Most of our on-campus sustainability initiatives were started by a few passionate Googlers, and have now grown into company-wide efforts. From the solar panels on our roofs to our bike-to-work program, these initiatives sit at the heart of our company culture and help both us and our users reduce our impact on the environment.

economic impact
Google is the largest corporate purchaser of renewable energy in the world.

The science tells us that tackling climate change is an urgent global priority. We believe the private sector, in partnership with policy leaders, must take bold steps and that we can do so in a way that leads to growth and opportunity. And we have a responsibility to do so — to our users and the environment.

We have lots of progress left to make, but these achievements we're announcing today feel like a breath of fresh air. Now, back to work.

Source: Google Cloud


We’re set to reach 100% renewable energy — and it’s just the beginning

Every year people search on Google trillions of times; every minute people upload more than 400 hours of YouTube videos. All of that takes an incredible amount of processing power — which means energy. Our engineers have spent years perfecting Google's data centers, making them 50 percent more energy efficient than the industry average. But we still need a lot of energy to power the products and services that our users depend on. We began purchasing renewable energy to reduce our carbon footprint and address climate change — but it also makes business sense.

I’m thrilled to announce that in 2017 Google will reach 100% renewable energy for our global operations — including both our data centers and offices. We were one of the first corporations to create large-scale, long-term contracts to buy renewable energy directly; we signed our first agreement to purchase all the electricity from a 114-megawatt wind farm in Iowa, in 2010. Today, we are the world’s largest corporate buyer of renewable power, with commitments reaching 2.6 gigawatts (2,600 megawatts) of wind and solar energy. That’s bigger than many large utilities and more than twice as much as the 1.21 gigawatts it took to send Marty McFly back to the future.

greent-wp-charts-Cumulative-Corporate-Renewal.png

To reach this goal we’ll be directly buying enough wind and solar electricity annually to account for every unit of electricity our operations consume, globally. And we're focusing on creating new energy from renewable sources, so we only buy from projects that are funded by our purchases.

Over the last six years, the cost of wind and solar came down 60 percent and 80 percent, respectively, proving that renewables are increasingly becoming the lowest cost option. Electricity costs are one of the largest components of our operating expenses at our data centers, and having a long-term stable cost of renewable power provides protection against price swings in energy.

Our 20 renewable energy projects also help support communities, from Grady County, OK, to Rutherford County, NC, to the Atacama Region of Chile to municipalities in Sweden. To date, our purchasing commitments will result in infrastructure investments of more than $3.5 billion globally, about two-thirds of that in the United States. These projects also generate tens of millions of dollars per year in revenue to local property owners, and tens of millions more to local and national governments in tax revenue.

So, we’re on track to match our global energy consumption on an annual basis by next year. But this is just the first step. As we look to the immediate future, we’ll continue to pursue these direct contracts as we grow, with an even greater focus on regional renewable energy purchases in places where we have data centers and significant operations. Since the wind doesn’t blow 24 hours a day, we’ll also broaden our purchases to a variety of energy sources that can enable renewable power, every hour of every day. Our ultimate goal is to create a world where everyone — not just Google — has access to clean energy. For more on these next steps, read our white paper.   

google_ppa.jpg
How Google purchases and uses renewable energy.

Operating our business in an environmentally sustainable way has been a core value from the beginning, and we’re always working on new ideas to make sustainability a reality — like enabling the building of healthy workplaces and creating a living, breathing dashboard for the planet. We’ve reported our carbon footprint and published information on our sustainability programs for many years in white papers, blog posts, and on our website. Now, we’ve put all this information together in a new Environmental Report.

You can also check out our new environment website, where we share stories of how we are finding new ways to do more while using less. Most of our on-campus sustainability initiatives were started by a few passionate Googlers, and have now grown into company-wide efforts. From the solar panels on our roofs to our bike-to-work program, these initiatives sit at the heart of our company culture and help both us and our users reduce our impact on the environment.

economic impact
Google is the largest corporate purchaser of renewable energy in the world.

The science tells us that tackling climate change is an urgent global priority. We believe the private sector, in partnership with policy leaders, must take bold steps and that we can do so in a way that leads to growth and opportunity. And we have a responsibility to do so — to our users and the environment.

We have lots of progress left to make, but these achievements we're announcing today feel like a breath of fresh air. Now, back to work.

We’re set to reach 100% renewable energy — and it’s just the beginning

Every year people search on Google trillions of times; every minute people upload more than 400 hours of YouTube videos. All of that takes an incredible amount of processing power — which means energy. Our engineers have spent years perfecting Google's data centers, making them 50 percent more energy efficient than the industry average. But we still need a lot of energy to power the products and services that our users depend on. We began purchasing renewable energy to reduce our carbon footprint and address climate change — but it also makes business sense.

I’m thrilled to announce that in 2017 Google will reach 100% renewable energy for our global operations — including both our data centers and offices. We were one of the first corporations to create large-scale, long-term contracts to buy renewable energy directly; we signed our first agreement to purchase all the electricity from a 114-megawatt wind farm in Iowa, in 2010. Today, we are the world’s largest corporate buyer of renewable power, with commitments reaching 2.6 gigawatts (2,600 megawatts) of wind and solar energy. That’s bigger than many large utilities and more than twice as much as the 1.21 gigawatts it took to send Marty McFly back to the future.

Google PPA Chart

To reach this goal we’ll be directly buying enough wind and solar electricity annually to account for every unit of electricity our operations consume, globally. And we're focusing on creating new energy from renewable sources, so we only buy from projects that are funded by our purchases.

Over the last six years, the cost of wind and solar came down 60 percent and 80 percent, respectively, proving that renewables are increasingly becoming the lowest cost option. Electricity costs are one of the largest components of our operating expenses at our data centers, and having a long-term stable cost of renewable power provides protection against price swings in energy.

Our 20 renewable energy projects also help support communities, from Grady County, OK, to Rutherford County, NC, to the Atacama Region of Chile to municipalities in Sweden. To date, our purchasing commitments will result in infrastructure investments of more than $3.5 billion globally, about two-thirds of that in the United States. These projects also generate tens of millions of dollars per year in revenue to local property owners, and tens of millions more to local and national governments in tax revenue.

So, we’re on track to match our global energy consumption on an annual basis by next year. But this is just the first step. As we look to the immediate future, we’ll continue to pursue these direct contracts as we grow, with an even greater focus on regional renewable energy purchases in places where we have data centers and significant operations. Since the wind doesn’t blow 24 hours a day, we’ll also broaden our purchases to a variety of energy sources that can enable renewable power, every hour of every day. Our ultimate goal is to create a world where everyone — not just Google — has access to clean energy. For more on these next steps, read our white paper.   

google_ppa.jpg
How Google purchases and uses renewable energy.

Operating our business in an environmentally sustainable way has been a core value from the beginning, and we’re always working on new ideas to make sustainability a reality — like enabling the building of healthy workplaces and creating a living, breathing dashboard for the planet. We’ve reported our carbon footprint and published information on our sustainability programs for many years in white papers, blog posts, and on our website. Now, we’ve put all this information together in a new Environmental Report.

You can also check out our new environment website, where we share stories of how we are finding new ways to do more while using less. Most of our on-campus sustainability initiatives were started by a few passionate Googlers, and have now grown into company-wide efforts. From the solar panels on our roofs to our bike-to-work program, these initiatives sit at the heart of our company culture and help both us and our users reduce our impact on the environment.

economic impact
Google is the largest corporate purchaser of renewable energy in the world.

The science tells us that tackling climate change is an urgent global priority. We believe the private sector, in partnership with policy leaders, must take bold steps and that we can do so in a way that leads to growth and opportunity. And we have a responsibility to do so — to our users and the environment.

We have lots of progress left to make, but these achievements we're announcing today feel like a breath of fresh air. Now, back to work.