Tag Archives: Google Cloud Platform

How to dynamically generate GCP IAM credentials with a new HashiCorp Vault secrets engine


Applications often require secrets such as credentials at build- or run-time. These credentials are an assertion of a service’s or user’s identity that they can use to authenticate to other services. On Google Cloud Platform (GCP), you can manage services or temporary users using Cloud Identity and Access Management (IAM) service accounts, which are identities whose credentials your application code can use to access other GCP services. You can access a service account from code running on GCP, in your on-premises environment, or even another cloud.

Protecting service account keys is critical—you should tightly control access to them, rotate them, and make sure they're not committed in code. But managing these credentials shouldn’t get harder as your number of services increases. HashiCorp Vault is a popular open source tool for secret management that allows users to store, manage and control access to tokens, passwords, certificates, API keys and many other secrets. Vault supports pluggable mechanisms known as secrets engines for managing different secret types. These engines allow developers to store, rotate and dynamically generate many kinds of secrets in Vault. Because Vault's secrets engines are pluggable, they each provide different functionality. Some engines store static data, others manage PKI and certificates, and others manage database credentials.

Today, we're pleased to announce a Google Cloud Platform IAM secrets engine for HashiCorp Vault. This allows a user to dynamically generate IAM service account credentials with which a human, machine or application can access specific Google Cloud resources using their own identity. To limit the impact of a security incident, Vault allows credentials to be easily revoked.

This helps address some common use cases, for example:
  • Restricting application access for recurring jobs: An application runs a monthly batch job. Instead of a hard-coded, long-lived credential, the application can request a short-lived GCP IAM credential at the start of the job. After a short time, the credential automatically expires, reducing the surface area for a potential attack.
  • Restricting user access for temporary users: A contracting firm needs 90 days of read-only access to build dashboards. Instead of someone generating this credential and distributing it to the firm, the firm requests this credential through Vault. This creates a 1-1 mapping of the credential to its users in audit and access logs.

Getting started with the IAM service account secret engine


Let’s go through an example for generating new service account credentials using Vault. This example assumes the Vault server is already up and running.

You can also watch a demo of the backend in our new video below.
First, enable the secrets engine:

$ vault secrets enable gcp 
Then, set up the engine with initial config and role sets:

$ vault write gcp/config \
credentials=@path/to/creds.json \
 ttl=3600 \
 max_ttl=86400

This config supplies default credentials that Vault will use to generate the service account keys and access tokens, as well as TTL metadata for the leases Vault assigns to these secrets when generated.

Role sets define the sets of IAM roles, bound to specific resources, that you assign to generated credentials. Each role set can generate one of two types of secrets: either `access_token` for one-use OAuth access tokens or `service_account_key` for long-lived service account keys. Here are some examples for both types of rolesets:

# Create role sets
$ vault write gcp/roleset/token-role-set \
    project="myproject" \
    secret_type="access_token" \
    bindings=@token_bindings.hcl
    token_scopes="https://www.googleapis.com/auth/cloud-platform"

$ vault write gcp/roleset/key-role-set \
    project="myproject" \
    secret_type="service_account_key"
    bindings=”
The above bindings param expects a string (or, using the special Vault syntax ‘@’, a path to a file containing this string) with the following HCL (or JSON) format
resource "path/to/my/resource" {
    roles = [
      "roles/viewer",
      "roles/my-other-role",
    ]
}

resource "path/to/another/resource" {
    roles = [
      "roles/editor",
    ]
}
Creating a new role set generates a new service account for a role set. When a user generates a set of credentials, they specify a role set (and thus service account) under which to create the credentials.

Once you have set up the secrets engine, a Vault client can easily generate new secrets:

$ vault read gcp/key/key-role-set

Key                 Value
---                 -----
lease_id            gcp/key/key-roleset/
lease_duration      1h
lease_renewable     true
key_algorithm       KEY_ALG_RSA_2048
key_type            TYPE_GOOGLE_CREDENTIALS_FILE
private_key_data    


$ vault read gcp/token/token-role-set

Key                 Value
---                 -----
lease_id           gcp/token/test/
lease_duration     59m59s
lease_renewable    false
token              ya29.c.restoftoken...
These credentials can then be used to make calls to GCP APIs as needed and can be automatically revoked by Vault.

To learn more, check out the GCP IAM service account secret engine documentation.

How WePay uses HashiCorp Vault on GCP


WePay is an online payment service provider who uses HashiCorp Vault on GCP. It currently runs HashiCorp Vault servers as virtual machines on Google Compute Engine for two primary use cases:
  • Plain vanilla secret storage using a configuration service: WePay has a service-oriented architecture built on Google Kubernetes Engine. Each microservice stores secrets such as passwords, tokens, private keys, and certificates in a centralized configuration service. This in turn uses the generic "kv" (key value) HashiCorp Vault secrets engine to manage application secrets. The configuration service authenticates services that talk to it, and authorizes those services to access their secrets at deployment time. Secrets are segmented by service using base paths, i.e., superSecurePaymentSystem would only be able to access secrets in the superSecurePaymentSystem path.
  • Key management using a key management service: WePay needs a way to centrally manage the provisioning, deprovisioning and rotation of encryption keys used in its applications. A central key management service generates encryption keys, and stores these in HashiCorp Vault using the "kv" secret engine.
WePay has its complete infrastructure built in GCP, and the introduction of the GCP IAM service account secrets engine will help to put in stronger security practices. WePay is exploring options on how to use the GCP IAM service account secrets engine in its infrastructure, and is excited by the possibilities.

Continuing work for HashiCorp Vault on GCP


We're excited to see what amazing applications and services users will build using the new HashiCorp Vault GCP secrets engine. This feature release is part of our long-standing ongoing partnership with HashiCorp since 2013. We're excited to continue working together to help HashiCorp users make the best use of GCP services and features. To get you up and running with, HashiCorp Vault for IAM service accounts, check out our solution brief “Using Vault on Compute Engine for Secret Management” for an overview of best practices, and a new video on authentication options.

As always, both HashiCorp and Google welcome contributions from the open-source community. Give us a tweet or open an issue on GitHub if you have any questions!
Introducing Kayenta: An open automated canary analysis tool from Google and Netflix


To perform continuous delivery at any scale, you need to be able to release software changes not just at high velocity, but safely as well. Today, Google and Netflix are pleased to announce Kayenta, an open-source automated canary analysis service that allows teams to reduce risk associated with rolling out deployments to production at high velocity.

Developed jointly by Google and Netflix, Kayenta is an evolution of Netflix’s internal canary system, reimagined to be completely open, extensible and capable of handling more advanced use cases. It gives enterprise teams the confidence to quickly push production changes by reducing error-prone, time-intensive and cumbersome manual or ad-hoc canary analysis.

Kayenta is integrated with Spinnaker, an open-source multi-cloud continuous delivery platform.

This allows teams to easily set up an automated canary analysis stage within a Spinnaker pipeline. Kayenta fetches user-configured metrics from their sources, runs statistical tests, and provides an aggregate score for the canary. Based on the score and set limits for success, Kayenta can automatically promote or fail the canary, or trigger a human approval path.
"Automated canary analysis is an essential part of the production deployment process at Netflix and we are excited to release Kayenta. Our partnership with Google on Kayenta has yielded a flexible architecture that helps perform automated canary analysis on a wide range of deployment scenarios such as application, configuration and data changes. Spinnaker’s integration with Kayenta allows teams to stay close to their pipelines and deployments without having to jump into a different tool for canary analysis. By the end of the year, we expect Kayenta to be making thousands of canary judgments per day. Spinnaker and Kayenta are fast, reliable and easy-to-use tools that minimize deployment risk, while allowing high velocity at scale."

Greg Burrell, Senior Reliability Engineer at Netflix (read more in Netflix’s blog post)
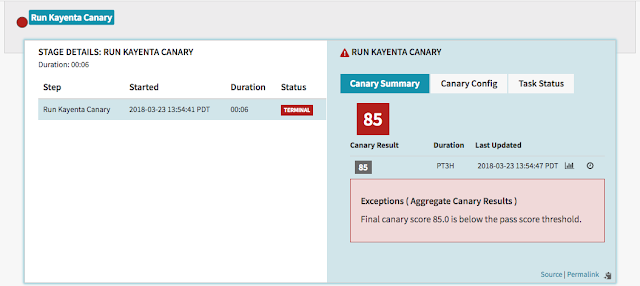
A final result summary from Kayenta looks something like the following:
“Canary analysis along with Spinnaker deployment pipelines enables us to automatically identify bad deployments. With 1000+ pipelines running in production, any form of human intervention as a part of canary analysis can be a huge blocker to our continuous delivery efforts. Automated canary deployment, as enabled by Kayenta, has allowed our team to increase development velocity by detecting anomalies faster. Additionally, being open source, standardizing on Kayenta helps reduce the risk of vendor lock-in. We look forward to working closely with Google and Netflix to further integrate Kayenta into our development cycle and get rid of our self-developed Jenkins job canary”

— Tom Feiner, Systems Operations Engineer at Waze

Continuous delivery challenges at scale


Canary analysis is a good way to reduce the risk associated with introducing new changes to end users in production. The basic idea is to route a small subset of production traffic, for example 1%, through a deployment that reflects the changes (the canary) and a newly deployed instance that has the same code and configuration as production (the baseline). The production instance is not modified in any way. Typically three instances are created each for baseline and canary, while production has multiple instances. Creating a new baseline helps minimize startup effects and limit the system variations between it and the canary. The system then compares the key performance and functionality metrics between the canary and the baseline, as chosen by the system owner. To continue with deployment, the canary should behave as well or better than the baseline.
Canary analysis is often carried out in a manual, ad-hoc or statistically incorrect manner. A team member, for instance, manually inspects logs and graphs showcasing a variety of metrics (CPU usage, memory usage, error rate, CPU usage per request) across the canary and production to make a decision on how to proceed with the proposed change. Manual or ad-hoc canary analysis can cause additional challenges:

  • Speed and scalability bottlenecks: For organizations like Google and Netflix that run at scale and that want to perform comparisons many times over multiple deployments in a single day, manual canary analysis isn't really an option. Even for other organizations, a manual approach to canary analysis can’t keep up with the speed and shorter delivery time frame of continuous delivery. Configuring dashboards for each canary release can be a significant manual effort, and manually comparing hundreds of different metrics across the canary and baseline is tiresome and laborious.
  • Accounting for human error: Manual canary analysis requires subjective assessment and is prone to human bias and error. It can be hard for people to separate real issues from noise. Humans often make mistakes while interpreting metrics and logs and deciding whether to promote or fail the canary. Collecting, monitoring and then aggregating multiple canary metrics for analysis in a manual manner further adds to the areas where an error can be made because of human judgement.
  • Risk of incorrect decisions: Comparing short-term metrics of a new deployment to the long-running production instances in a manual or ad-hoc fashion is an inaccurate way to identify the health of the canary. Mainly because it can be hard to distinguish whether the performance deviations you see in the canary are statistically relevant or simply random. As a result, you may end up pushing bad deployments to production.
  • Poor support for advanced use cases: To optimize the continuous delivery cycle with canary analysis, you need a high degree of confidence about whether to promote or fail the canary. But gaining the confidence to make go/no-go decisions based on manual or ad-hoc processes is time-consuming, primarily because a manual or ad-hoc canary analysis can’t handle advanced use cases such as adjusting boundaries and parameters in real-time.

The Kayenta approach 

Compared to manual or ad-hoc analysis, Kayenta runs automatic statistical tests on user-specified metrics and returns an aggregate score (success, marginal, failure). This rigorous analysis helps better inform rollout or rollback decisions and identify bad deployments that might go unnoticed with traditional canary analysis. Other benefits of Kayenta include:

  • Open: Enterprise teams that want to perform automated canary analysis with commercial offerings must provide confidential metrics to the provider, resulting in vendor lock-in.
  • Built for hybrid and multi-cloud: Kayenta provides a consistent way to detect problems across canaries, irrespective of the target environment. Given its integration to Spinnaker, Kayenta lets teams perform automated canary analysis across multiple environments, including Google Cloud Platform (GCP), Kubernetes, on-premise servers or other cloud providers.
  • Extensible: Kayenta makes it easy to add new metric sources, judges, and data stores. As a result, you can configure Kayenta to serve more diverse environments as your needs change.
  • Gives confidence quickly: Kayenta lets you adjust boundaries and parameters while performing automatic canary analysis. This lets you move fast and decide whether to promote or fail the canary as soon as you’ve collected enough data.
  • Low overhead: It's easy to get started with Kayenta. No need to write custom scripts or manually fetch canary metrics, merge these metrics or perform statistical analysis to decide whether to either deploy or rollback the canary. Deep links are provided by Kayenta within canary analysis results for in-depth diagnostic purposes.
  • Insight: For advanced use cases, Kayenta can help perform retrospective canary analysis. This gives engineering and operations teams insights into how to refine and improve canary analysis over time.

Integration with Spinnaker

Kayenta’s integration to Spinnaker has produced a new “Canary” pipeline stage in Spinnaker. Here you can specify which metrics to check from which sources, including monitoring tools such as Stackdriver, Prometheus, Datadog or Netflix’s internal tool Atlas. Next, Kayenta fetches metrics data from the source, creates a pair of control/experiment time series datasets and calls a Canary Judge. The Canary Judge performs statistical tests, evaluating each metric individually, and returns an aggregate score from 0 to 100 using pre-configured metric weights. Depending on user configuration, the score is then classified as "success," "marginal," or "failure." Success promotes the canary and continues the deployment, a marginal score can trigger a human approval path and failure triggers a roll back.

Join us!


With Kayenta, you now have an open, automated way to perform canary analysis and quickly deploy changes to production with confidence. By open-sourcing Kayenta, our goal is to build a community where metric stores and judges are provided both by the open source community and via proprietary systems. Here are some ways you can learn more about Kayenta and contribute to the project:


  • Read more about Kayenta in Netflix’s blog
  • Attend Spinnaker meetup in Bay Area

We hope you will join us!

Cloud Endpoints: Introducing a new way to manage API configuration rollout


Google Cloud Endpoints is a distributed API gateway that you can use to develop, deploy, protect and monitor APIs that you expose. Cloud Endpoints is built on the same services that Google uses to power its own APIs, and you can now configure it to use a new managed rollout strategy that automatically uses the latest service configuration, without having to re-deploy or restart it.

Cloud Endpoints uses the distributed Extensible Service Proxy (ESP) to serve APIs with low latency and high performance. ESP is a service proxy based on NGINX, so you can be confident that it can scale to handle simultaneous requests to your API. ESP runs in its own Docker container for better isolation and scalability and is distributed in the Google Container Registry and Docker registry. You can run ESP on Google App Engine flexible, Google Kubernetes Engine, Google Compute Engine, open-source Kubernetes, or an on-premises server running Linux or Mac OS.

Introducing rollout_strategy: managed


APIs are a critical part of using cloud services, and Cloud Endpoints provides a convenient way to take care of API management tasks such as authorization, monitoring and rate limiting. With Cloud Endpoints, you can describe the surface of the API using an OpenAPI specification or a gRPC service configuration file. To manage your API with ESP and Cloud Endpoints, deploy your OpenAPI specification or gRPC service configuration file using the brand new command:

gcloud endpoints services deploy

This command generates a configuration ID. Previously, in order for ESP to apply a new configuration, you had to restart ESP with the generated configuration ID of the last API configuration deployment. If your service was deployed to the App Engine flexible environment, you had to re-deploy your service every time you deployed changes to the API configuration, even if there were no changes to the source code.

Cloud Endpoint’s new rollout_strategy: managed option configures ESP to use the latest deployed service configuration. When you specify this option, ESP detects the change to a new service configuration within one minute, and automatically begins using it. We recommend that you specify this option instead of a specific configuration ID for ESP to use.

With the new managed rollout deployment strategy, Cloud Endpoints becomes an increasingly frictionless API management solution that doesn’t require you to re-deploy your services or restart ESP on every API configuration change.

For information on deploying ESP with this new option, see the documentation for your API implementation:

More reading 

Toward better phone call and video transcription with new Cloud Speech-to-Text


It’s been full speed ahead for our Cloud AI speech products as of late. Last month, we introduced Cloud Text-to-Speech, our speech synthesis API featuring DeepMind WaveNet models. And today, we’re announcing the largest overhaul of Cloud Speech-to-Text (formerly known as Cloud Speech API) since it was introduced two years ago.

We first unveiled the Cloud Speech API in 2016, and it’s been generally available for almost a year now, with usage more than doubling every six months. Today, with the opening of NAB and SpeechTek conferences, we’re introducing new features and updates that we think will make Speech-to-Text much more useful for business, including phone-call and video transcription.

Cloud Speech-to-Text now supports:

  1. A selection of pre-built models for improved transcription accuracy from phone calls and video
  2. Automatic punctuation, to improve readability of transcribed long-form audio
  3. A new mechanism (recognition metadata) to tag and group your transcription workloads, and provide feedback to the Google team
  4. A standard service level agreement (SLA) with a commitment to 99.9% availability

Let’s take a deeper look at the new updates to Cloud Speech-to-Text.

New video and phone call transcription models


There are lots of different ways to use speech recognition technology—everything from human-computer interaction (e.g., voice commands or IVRs) to speech analytics (e.g., call center analytics). In this version of Cloud Speech-to-Text, we’ve added models that are tailored for specific use cases— e.g., phone call transcriptions and transcriptions of audio from video.
For example, for processing phone calls, we’ve routed incoming English US phone call requests to a model that's optimized to handle phone calls and is considered by many customers to be best-in-class in the industry. Now we’re giving customers the power to explicitly choose the model that they prefer rather than rely on automatic model selection.

Most major cloud providers use speech data from incoming requests to improve their products. Here at Google Cloud, we’ve avoided this practice, but customers routinely request that we use real data that's representative of theirs, to improve our models. We want to meet this need, while being thoughtful about privacy and adhering to our data protection policies. That’s why today, we’re putting forth one of the industry’s first opt-in programs for data logging, and introducing a first model based on this data: enhanced phone_call.

We developed the enhanced phone_call model using data from customers who volunteered to share their data with Cloud Speech-to-Text for model enhancement purposes. Customers who choose to participate in the program going forward will gain access to this and other enhanced models that result from customer data. The enhanced phone_call model has 54% fewer errors than our basic phone_call model for our phone call test set.
In addition, we’re also unveiling the video model, which has been optimized to process audio from videos and/or audio with multiple speakers. The video model uses machine learning technology similar to that used by YouTube captioning, and shows a 64% reduction in errors compared to our default model on a video test set.

Both the enhanced phone_call and premium-priced video model are now available for en-US transcription and will soon be available for additional languages. We also continue to offer our existing models for voice command_and_search, as well as our default model for longform transcription.
Check out the demo on our product website to upload an audio file and see transcription results from each of these models.

Generate readable text with automatic punctuation


Most of us learn how to use basic punctuation (commas, periods, question marks) by the time we leave grade school. But properly punctuating transcribed speech is hard to do. Here at Google, we learned just how hard it can be from our early attempts at transcribing voicemail messages, which produced run-on sentences that were notoriously hard to read.
A few years ago, Google started providing automatic punctuation with our Google Voice voicemail transcription service. Recently, the team created a new LSTM neural network to improve automating punctuation in long-form speech transcription. Architected with performance in mind, the model is now available to you in beta in Cloud Speech-to-Text, and can automatically suggests commas, question marks and periods for your text.

Describe your use cases with recognition metadata


The progress we've made with Cloud Speech-to-Text is due in large part to the feedback you’ve given us over the last two years, and we want to open up those lines of communication even further, with recognition metadata. Now, you can describe your transcribed audio or video with tags such as “voice commands for a shopping app” or “basketball sports tv shows.” We then aggregate this information across Cloud Speech-to-Text users to prioritize what we work on next. Providing recognition metadata increases the probability that your use case will improve with time, but the program is entirely optional.

Customer references

We’re really excited about this new version of Cloud Speech-to-Text, but don’t just take our word for it—here’s what our customers have to say.
“Unstructured data, like audio, is full of rich information but many businesses struggle to find applications that make it easy to extract value from it and manage it. Descript makes it easier to edit and view audio files, just like you would a document. We chose to power our application with Google Cloud Speech-to-Text. Based on our testing, it’s the most advanced speech recognition technology and the new video model had half as many errors as anything else we looked at. And, with its simple pricing model, we’re able to offer the best prices for our users.”  
Andrew Mason, CEO, Descript
"LogMeIn’s GoToMeeting provides market leading collaboration software to millions of users around the globe. We are always looking for the best customer experience and after evaluating multiple solutions to allow our users to transcribe meetings we found Google’s Cloud Speech-to-Text’s new video model to be far more accurate than anything else we’ve looked at. We are excited to work with Google to help drive value for our customers beyond the meeting with the addition of transcription for GoToMeeting recordings." 
 – Matt Kaplan, Chief Product Officer, Collaboration Products at LogMeIn
"At InteractiveTel, we've been using Cloud Speech-to-Text since the beginning to power our real-time telephone call transcription and analytics products. We've constantly been amazed by Google's ability to rapidly improve features and performance, but we were stunned by the results obtained when using the new phone_call model. Just by switching to the new phone_call model we experienced accuracy improvements in excess of 64% when compared to other providers, and 48% when compared to Google's generic narrow-band model."  
 Jon Findley, Lead Product Engineer, InteractiveTel
Access to quality speech transcription technology opens up a world of possibilities for companies that want to connect with and learn from their users. With this update to Cloud Speech-to-Text, you get access to the latest research from our team of machine learning experts, all through a simple REST API. Pricing is $0.006 per 15 seconds of audio for all models except the video model, which is $0.012 per 15 seconds. We'll be providing the new video model for the same price ($0.006 per 15 seconds) for a limited trial period through May 31. To learn more, try out the demo on our product page or visit our documentation.

Viewing trace spans and request logs in multi-project deployments


Google Cloud Platform (GCP) provides developers and operators with fine-grained billing and resource access management for separate applications through projects. But while isolating application services across projects is important for security and cost allocation, it can make debugging cross-service issues more difficult.

Stackdriver Trace, our tool for analyzing latency data from your applications, can now visualize traces and logs for requests that cross multiple projects, all in a single waterfall chart. This lets you see how requests propagate through services in separate projects and helps to identify sources of poor performance across your entire stack.

To view spans and log entries for cross-project traces, follow the instructions in the Viewing traces across projects documentation. Your projects will need to be part of a single organization, as explained in Best Practices for Enterprise Organizations. To do so, create an organization and then migrate existing projects to it.

Once your projects are in an organization, you’re ready to view multi-project traces. First, select any one of the relevant projects in the GCP Console, and then navigate to the Trace List page and select a trace. You will see spans for all the projects in your organization for which you have “cloudtrace.traces.get” permission. The “Project” label in the span details panel on the right indicates which project the selected span is from.

You can also view log entries associated with the request from all projects that were part of the trace. This requires the “logging.logEntries.list” permission on the associated projects and it requires you to set the LogEntry “trace” field using the format “projects/[PROJECT-ID]/traces/[TRACE-ID]” when you write your logs to Stackdriver Logging. You may also set the LogEntry “span_id” field as the 16-character hexadecimal encoded span ID to associate logs with specific trace spans. See Viewing Trace Details > Log Entries for details.

If you use Google Kubernetes Engine or the Stackdriver Logging Agent via Fluentd, you can set the LogEntry “trace” and “span_id” fields by writing structured logs with the keys of “logging.googleapis.com/trace” and “logging.googleapis.com/span_id”. See Special fields in structured payloads for more information.

To view the associated log entries inline with trace spans, click “Show Logs.”


Automatic association of traces and logs

Here are the GCP languages and environments that support automatically associating traces and log entries:
Now, having applications in multiple projects is no longer a barrier to identifying the sources of poor performance in your stack. Click here to learn more about Stackdriver Trace.

Now, you can deploy to Kubernetes Engine from GitLab with a few clicks


In cloud developer circles, GitLab is a popular DevOps lifecycle tool. It lets you do everything from project planning and version control to CI/CD pipelines and monitoring, all in a single interface so different functional teams can collaborate. In particular, its Auto DevOps feature detects the language your app is written in and automatically builds your CI/CD pipelines for you.

Google Cloud started the cloud native movement with the invention and open sourcing of Kubernetes in 2014. Kubernetes draws on over a decade of experience running containerized workloads in production serving Google products at massive scale. Kubernetes Engine is our managed Kubernetes service, built by the same team that's the largest contributor to the Kubernetes open source project, and is run by experienced Google SREs, all of which enables you to focus on what you do best: creating applications to delight your users, while leaving the cluster deployment operations to us.

Today, GitLab and Google Cloud are announcing a new integration of GitLab and Kubernetes Engine that makes it easy for you to accelerate your application deployments by provisioning Kubernetes clusters, managed by Google, right from your DevOps pipeline supported by GitLab. You can now connect your Kubernetes Engine cluster to your GitLab project in just a few clicks, and use it to run your continuous integration jobs, and configure a complete continuous deployment pipeline, including previewing your changes live, and deploying them into production, all served by Kubernetes Engine.

Head over to GitLab, and add your first Kubernetes Engine cluster to your project from the CI/CD options in your repository today!

The Kubernetes Engine cluster can be added through the CI/CD -> Kubernetes menu option in the GitLab UI, which even supports creating a brand new Kubernetes Cluster.
Once connected, you can deploy the GitLab Runner into your cluster. This means that the continuous integration jobs will run on your Kubernetes Engine cluster, enabling you fine-grained control over the resources you allocate. For more information read the GitLab Runner docs.

Even more exciting is the new GitLab Auto DevOps integration with Kubernetes Engine. Using Auto DevOps with Kubernetes Engine, you'll have a continuous deployment pipeline that automatically creates a review app for each merge request  a special dynamic environment that allows you to preview changes before they go live  and once you merge, deploy the application into production on production-ready Google Kubernetes Engine.

To get started, go to CI/CD -> General pipeline settings, and select “Enable Auto DevOps”. For more information, read the AutoDev Ops docs.
Auto DevOps does the heavy lifting to detect what languages you’re using, and configure a Continuous Integration and Continuous Deployment pipeline that results in your app running live on the Kubernetes Engine cluster.
Now, whenever you create a merge request, GitLab will run a review pipeline to deploy a review app to your cluster where you can test your changes live. When you merge the code, GitLab will run a production pipeline to deploy your app to production, running on Kubernetes Engine!

Join us for a webinar co-hosted by Google Cloud and GitLab 


Want to learn more? We’re hosting a webinar to show how to build cloud-native applications with Gitlab and Kubernetes Engine. Register here for the April 26th webinar.

Want to get started deploying to Kubernetes? GitLab is offering $500 in Google Cloud Platform credits for new accounts. Try it out.

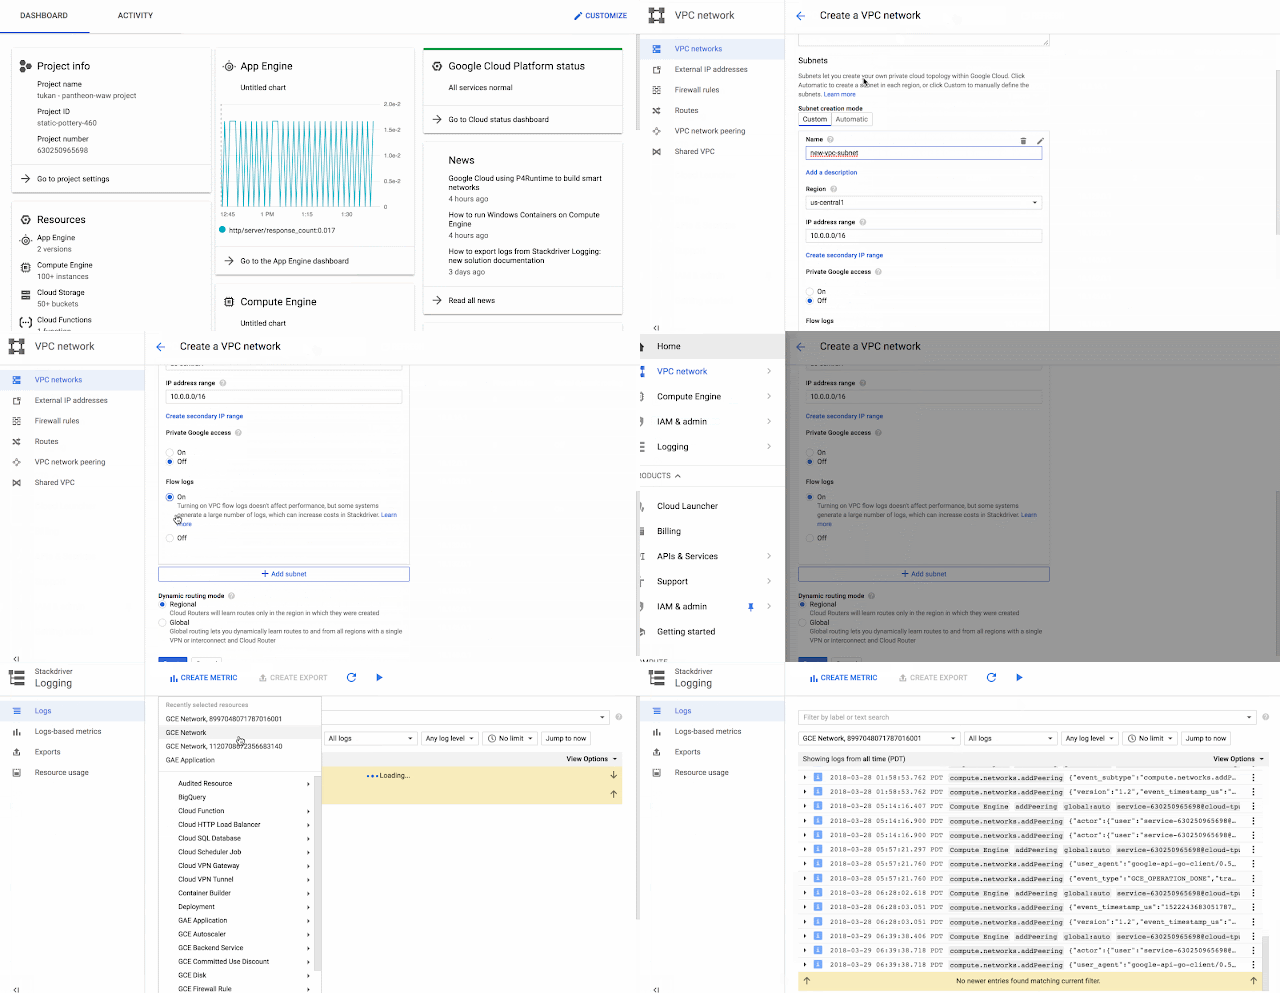
Introducing VPC Flow Logs—network transparency in near real-time


Logging and monitoring are the cornerstones of network and security operations. Whether it’s performance analysis or network forensics, logging and monitoring let you identify traffic and access patterns that may present security or operational risks to the organization. Today, we’re upping the ante for network operations on Google Cloud Platform (GCP) with the introduction of VPC Flow Logs, increasing transparency into your network and allowing you to track network flows all the way down to an individual virtual interface, in near-real-time.

If you’re familiar with network operations, think of VPC Flow Logs like NetFlow, but with additional features. VPC Flow Logs provides responsive flow-level network telemetry for GCP environments, creating logs in five-second intervals. It also allows you to collect network telemetry at various levels. You can choose to collect telemetry for a particular VPC network or subnet or drill down further to monitor a specific VM Instance or virtual interface.
VPC Flow Logs can capture telemetry data from a wide variety of sources. It can track:

  • Internal VPC Traffic 
  • Flows between your VPC and on-premises deployments over both VPNs and Google Cloud Interconnects 
  • Flows between your servers and any internet endpoint 
  • Flows between your servers and any Google services

The logs generated by this process include a variety of data points, including a 5-tuple definition and timestamps, performance metrics such as throughput and RTT, and endpoint definitions such as VPC and geo annotations. VPC Flow Logs natively lets you export this data in a highly secure manner to Stackdriver Logging or BigQuery. Or using Cloud Pub/Sub, you can export these logs to any number of real-time analytics or SIEM platforms.

Better network and security operations

Having VPC Flow Logs in your toolbox can help you with a wide range of operational tasks. Here are just a few.

  • Network monitoring - VPC Flow Logs allows you to monitor your applications from the perspective of your network. From performance to debugging and troubleshooting, VPC Flow Logs can tell you how your applications are performing, to help you keep them up and running, and identify what changed should an issue arise.
  • Optimizing network usage and egress - By providing visibility into both your application’s inter-region traffic and your traffic usage globally, VPC Flow Logs lets you optimize your network costs by optimizing your bandwidth utilization, load balancing and content distribution.
  • Network forensics and security analytics - VPC Flow Logs also helps you perform network forensics when investigating suspicious behavior such as traffic from access from abnormal sources or unexpected volumes of data migration. The logs also help you ensure compliance.
  • Real-time security analysis - With the Cloud Pub/Sub API, you can easily export your logs into any SIEM ecosystem that you may already be using.

All this happens with near real-time accuracy (updates every 5 seconds vs. minutes), with absolutely no performance impact on your deployment.

Partner Eco-system


One of our key goals with VPC Flow Logs was to allow you to export your flow logs to partner systems for real-time analysis and notifications. At launch, we integrate with two leading logging and analytics platforms: Cisco Stealthwatch and Sumo Logic.
"Our integration with VPC Flow Logs lets customers send their network and security telemetry into Cisco Stealthwatch Cloud without deploying agents or collectors, thereby providing exceptionally fast and easy access to Stealthwatch multicloud security services and a holistic security view across on-premises and public cloud. This integration provides customers with excellent security visibility and threat detection in their GCP environment, and is the latest example of how we are partnering with Google to deliver great value to our joint customers." 
Jeremy Oakey, Senior Director, Product Management, Cisco Cloud Platform and Solutions Group. 

To learn more about VPC Flow Logs, including how to get started and pricing, please visit the documentation and product page.

Exploring container security: Node and container operating systems


Editor’s note: This is the second in a series of blog posts on container security at Google.

When deploying containers, your container images should be free of known vulnerabilities, and have a bare minimum of functionality. This reduces the attack surface, preventing bad actors from taking advantage of unnecessary openings in your infrastructure.

Unlike other deployment mechanisms, with containers, there are actually two operating systems that you need to secure—the container’s node/host OS, i.e., the operating system on which you run the container; and the container image that runs inside the container itself. On Google Kubernetes Engine, our managed container service, as well as for other hosted services on Google Cloud Platform (GCP), we manage the node OS for you. And when it comes to the container image, we give you several options to choose from.

Out of the box, Kubernetes Engine provides the following options for your node OS and container images:

  • For the node OS, you can choose between Container-optimized OS (COS) or Ubuntu 
  • For the container image, Google Container Registry has readily available images for Debian and Ubuntu, and of course, you can also bring your own image!

It’s great to have choices—but choice can also be overwhelming. Let’s take a deeper look at the security properties of these options, and what’s included in Kubernetes Engine.

Node OS: Container-optimized OS (COS) 

Container-optimized OS (COS) is a relatively new OS that we developed to enhance the security and performance of services running in Google Cloud, especially containers. In fact, COS underpins Kubernetes Engine, Cloud SQL, Cloud Machine Learning Engine and several other Google services.

Based on Chromium OS, COS implements several security design principles to provide a manageable platform for running production services. Some of these design aspects include:

  • Minimal OS footprint. COS is optimized to run containers on GCP. As such, we only enable features and include packages that are absolutely necessary to support running containers. Since containers package their own dependencies, this allows us to greatly reduce the OS attack surface and also improves performance.
  • Read-only root filesystem. The COS root filesystem is always mounted as read-only. Additionally, its checksum is verified by the kernel on each boot. This means that the kernel refuses to boot if the root filesystem has been tampered with. Additionally, several other mounts are non-executable by default.
  • Stateless configuration. While having a read-only root filesystem is good for security, it makes the system unusable for all practical purposes (e.g., we need to be able to create and add users in order to log in to the system). To address this, we customized the root filesystem such that /etc/ is stateless. This allows you to write configuration settings at run time, but those settings do not persist across reboots. Thus, every time a COS node reboots, it starts from a clean slate. Certain areas, such as users’ home directories, logs, and docker images, persist across reboots, as they're not part of the root filesystem.
  • Security-hardened kernel. COS enables several security-hardening kernel features, including some from the ChromiumOS Linux Security Module (LSM). For example, by using a combination of LoadPin (one such LSM that comes from ChromiumOS) and the read-only rootfs and rootfs-verification, you can prevent attackers from compromising the kernel by loading custom kernel modules. Additionally, Linux features such as IMA, AUDIT, APPARMOR, etc. make it difficult to hide attempts at circumventing security policies.
  • Sane security-centric defaults. COS provides another level of hardening simply by providing sane default values for several features. This includes things such as sysctl settings that disable ptrace and unprivileged bpf, a locked down firewall, and so on. These sane defaults, when automatically applied to a fleet of instances, go a long way toward securing the entire cluster/project/organization. 
  • Auto-updates. COS’s automatic updates feature allows timely delivery of security patches to running VMs. When COS is managed by Kubernetes Engine, Node-Auto-Upgrade strikes a balance between security and stability.

In addition to various hardening features in the OS itself, the COS team also employs best practices when developing, building and deploying these OS images to Google Cloud. Some of these include:

  • Built from source at Google. Each package in COS, including the Linux kernel itself, is built from source from ChromiumOS code repositories. This means that we know exactly what is going into the OS, who checked it in, in which version it was introduced, etc. This also lets us quickly patch and update any package in case a vulnerability is discovered, at any level.
  • Continuous vulnerability scanning and response. A CVE-scanning system alerts us whenever a vulnerability is discovered in any component of the OS. The COS team then responds with priority to make patched releases available for our users. The COS team also works with Google’s incident response team to make wider security patches available quickly in COS, e.g., patched COS images were available on Google Cloud before the recent Spectre and Meltdown vulnerabilities were publicly announced.
  • Testing and qualification process. Before a new COS image is published to Google Cloud, it undergoes extensive testing at multiple levels—including kernel fuzz testing by syzkaller, cluster-level Kubernetes tests, and several performance benchmarks. This ensures the stability and quality of our releases.

We are also actively working on several improvements in the area of node-OS security. You can learn more in the COS security documentation.

Kubernetes Engine uses COS as the OS for all master nodes. By default, COS is also used for your workload’s node OS. Unless you have specific requirements, we recommend you use COS for its security properties.

Container image: Debian and Ubuntu


Similarly to our node OS, we maintain our own container images for running hosted services. Google Cloud uses Debian and Ubuntu as a base image, for services like Google App Engine or Google Cloud Functions. Likewise, Debian and Ubuntu are both popular choices for container images.

From a security perspective, it doesn’t matter which container image you use, the important thing is to scan it regularly for known vulnerabilities. We maintain our Debian and Ubuntu base images with regular patching and testing and can rebuild them from scratch reproducibly. If you’re building your own containers, you’re welcome to use our base images too!

 See you next week, as we cover a new topic in our container security series at Google.

Oro: How GCP smoothed our path to PCI DSS compliance


Editor’s note: We recently we made a bunch of security announcements, and today we’re sharing a story from Oro, Inc., which runs its OroCommerce e-commerce service on Google Cloud Platform, and was pleasantly surprised by the ease and speed with which they were able to demonstrate PCI DSS compliance. Read on for Oro’s information security officer’s take on achieving PCI DSS compliance in the cloud.

Building and running an e-commerce website poses many challenges. You want your website to be easy to use, have an attractive design and an intuitive user interface. It must scale during peak seasons like Black Friday and Cyber Monday. But equally, if not more important, is information security. E-commerce websites are frequent targets because they handle financial transactions and payment card industry (PCI) information such as credit and debit card numbers. They also connect into many other systems, so it must meet many strict infosec industry standards.

If you have an e-commerce website, achieving PCI DSS compliance is critical. As a Chief Information Security Officer (CISO), Chief Information Officer (CIO), Chief Technology Officer (CTO) or other Infosec specialist, you may be concerned about PCI compliance on cloud infrastructures. Here at Oro, the company behind the OroCommerce B2B eCommerce platform, we addressed our PCI DSS compliance requirements by using Google Cloud Platform (GCP) as our Infrastructure-as-a-Service (IaaS) platform, and pass the benefits on to our OroCommerce customers. Achieving PCI DSS compliance may not be as easy as googling the closest pizza shops or gas stations, but Google Cloud’s IaaS platform certainly simplifies the process, ensuring you have everything needed to be compliant.

Using cloud and IaaS wasn’t always our top choice for building a PCI DSS-compliant website. Initially, our customers were reluctant to put their precious data into another party’s hands and store it somewhere in a foggy cloud. But nowadays, attitudes have changed. GCP provided us with strong support and a variety of tools to help build a PCI DSS compliant solution.
We had an excellent experience partnering and working with Google to complete the PCI DSS certification on our platform-as-a-service (PaaS) that hosts customized OroCommerce sites for Oro customers. We're proud to partner with Google Cloud to offer our customers a secure environment.


Building PCI DSS compliant infrastructure

At its core, building a PCI DSS compliant infrastructure requires:

  • The platform used to build your service must be PCI DSS compliant. This is a direct compliance requirement. 
  • Your platform must provide all the tools and methods used to build secure networks.

Google helped with both of these. The first point was easy, since all GCP services are PCI DSS compliant. In addition, Google provided us with a Shared Responsibility document that lists all PCI DSS requirements. This document explains the details of how Google achieves compliance and what Google customers need to do above and beyond that to support a compliant environment. This document not only has legal value but if used as a checklist, it can be a useful tool when going for PCI DSS certification.

For example, Google supports PCI DSS requirement #9, which mandates the physical security of a hosting environment including the need for guards, hard disk drive shredders, surveillance, etc. Hearing that Google takes the responsibility to protect both hardware and data from physical theft or damage was very reassuring. We rely on GCP tools to protect against inappropriate access and ensure day-to-day information security.
Another key requirement of a secure network architecture (and PCI DSS) is to hide all internal nodes from external access, control all incoming and outgoing traffic, and use network segregation for different application tiers. OroCommerce fulfills these requirements by using Google’s Virtual Private Cloud, firewall rules, advanced load balancers and Cloud Identity and Access Management (IAM) for authentication control. Google Site Reliability Engineers (SRE) have secure connections into production nodes inside the isolated production network using Google’s 2-step authentication mechanisms.

Also, we found that we can safely use Google-provided Compute Engine images based on up-to-date and secure Linux distributions. This frees the sysadmin from hardening of the OS, so they can pay more attention to vulnerability management and other important tasks.

While the importance of a secure infrastructure, access control, and network configuration is well-known, it’s also important to build and maintain a reliable logging and monitoring system. The PCI DSS standard puts an emphasis on audit trails and logs. To be compliant, you must closely monitor environments for suspicious activity and collect all needed data for a predetermined length of time to investigate any incidents. We found the combination of Stackdriver Monitoring and Logging, plus big data services such as BigQuery, helped us meet our monitoring, storing and log analysis needs. With Stackdriver, we monitor our production systems and detect anomalies in a thorough and timely manner, spending less time on configuration and support. We use BigQuery to analyze our logs so engineers can easily figure out what happened during a particular period of time.

Back in 2017 when we started to work on getting PCI DSS compliance for OroCommerce, we expected to spend a huge amount of time and resources on this process. But as we moved forward, we figured out how much GCP helped us to meet our goal. Having achieved PCI DSS compliance, it’s clear that choosing GCP for our infrastructure was the right decision.