When it comes to mobile applications, automating app distribution helps ensure hardening and consistent delivery and speeds testing. But mobile application delivery pipelines can be challenging to build, because mobile development environments require you to install specific SDKs. Even distributing beta versions requires specific secrets and signing credentials.
Containers are a great way to distribute mobile applications, since you can incorporate the specific build requirements into the container image. Our new solution, Creating a Serverless Mobile Delivery Pipeline in Google Cloud Platform, demonstrates how you can use our Container Builder product to automate the build and distribution of the beta versions of your mobile application for just pennies a build. Check it out, and let us know what you think!
Editor’s note: Today is the third installment in a seven-part video and blog series from Google Developer Advocate Sandeep Dinesh on how to get the most out of your Kubernetes environment.
Distributed systems can be hard to manage. A big reason is that there are many moving parts that all need to work for the system to function. If a small part breaks, the system has to detect it, route around it, and fix it. And this all needs to be done automatically!
Health checks are a simple way to let the system know if an instance of your app is working or not working. If an instance of your app is not working, then other services should not access it or send a request to it. Instead, requests should be sent to another instance of the app that is ready, or retried at a later time. The system should also bring your app back to a healthy state.
By default, Kubernetes starts to send traffic to a pod when all the containers inside the pod start, and restarts containers when they crash. While this can be “good enough” when you are starting out, you can make your deployments more robust by creating custom health checks. Fortunately, Kubernetes make this relatively straightforward, so there is no excuse not to!
In this episode of “Kubernetes Best Practices”, let’s learn about the subtleties of readiness and liveness probes, when to use which probe, and how to set them up in your Kubernetes cluster.
Types of health checks
Kubernetes gives you two types of health checks, and it is important to understand the differences between the two, and their uses. Readiness
Readiness probes are designed to let Kubernetes know when your app is ready to serve traffic. Kubernetes makes sure the readiness probe passes before allowing a service to send traffic to the pod. If a readiness probe starts to fail, Kubernetes stops sending traffic to the pod until it passes. Liveness
Liveness probes let Kubernetes know if your app is alive or dead. If you app is alive, then Kubernetes leaves it alone. If your app is dead, Kubernetes removes the Pod and starts a new one to replace it.
How health checks help
Let’s look at two scenarios where readiness and liveness probes can help you build a more robust app.
Readiness
Let’s imagine that your app takes a minute to warm up and start. Your service won’t work until it is up and running, even though the process has started. You will also have issues if you want to scale up this deployment to have multiple copies. A new copy shouldn’t receive traffic until it is fully ready, but by default Kubernetes starts sending it traffic as soon as the process inside the container starts. By using a readiness probe, Kubernetes waits until the app is fully started before it allows the service to send traffic to the new copy.
Liveness
Let’s imagine another scenario where your app has a nasty case of deadlock, causing it to hang indefinitely and stop serving requests. Because the process continues to run, by default Kubernetes thinks that everything is fine and continues to send requests to the broken pod. By using a liveness probe, Kubernetes detects that the app is no longer serving requests and restarts the offending pod.
Type of Probes
The next step is to define the probes that test readiness and liveness. There are three types of probes: HTTP, Command, and TCP. You can use any of them for liveness and readiness checks. HTTP
HTTP probes are probably the most common type of custom liveness probe. Even if your app isn’t an HTTP server, you can create a lightweight HTTP server inside your app to respond to the liveness probe. Kubernetes pings a path, and if it gets an HTTP response in the 200 or 300 range, it marks the app as healthy. Otherwise it is marked as unhealthy.
You can read more about HTTP probes here. Command
For command probes, Kubernetes runs a command inside your container. If the command returns with exit code 0, then the container is marked as healthy. Otherwise, it is marked unhealthy. This type of probe is useful when you can’t or don’t want to run an HTTP server, but can run a command that can check whether or not your app is healthy.
You can read more about command probes here. TCP
The last type of probe is the TCP probe, where Kubernetes tries to establish a TCP connection on the specified port. If it can establish a connection, the container is considered healthy; if it can’t it is considered unhealthy.
TCP probes come in handy if you have a scenario where HTTP probes or command probe don’t work well. For example, a gRPC or FTP service is a prime candidate for this type of probe.
Probes can be configured in many ways. You can specify how often they should run, what the success and failure thresholds are, and how long to wait for responses. The documentation on configuring probes is pretty clear about the different options and what they do.
However, there is one very important setting that you need to configure when using liveness probes. This is the initialDelaySeconds setting.
As I mentioned above, a liveness probe failure causes the pod to restart. You need to make sure the probe doesn’t start until the app is ready. Otherwise, the app will constantly restart and never be ready!
I recommend using the p99 startup time as the initialDelaySeconds, or just take the average startup time and add a buffer. As your app's startup time gets faster or slower, make sure you update this number.
Conclusion
Most people will tell you that health checks are a requirement for any distributed system, and Kubernetes is no exception. Using health checks gives your Kubernetes services a solid foundation, better reliability, and higher uptime. Thankfully, Kubernetes makes it easy to do!
By Maya Kaczorowski, Product Manager, Security & Privacy; and Andy Chang, Product Manager, Security & Privacy
Editor’s note: This is the sixth in a series of blog posts on container security at Google.
If you suspect that a container has been compromised, what do you do? In today’s blog post on container security, we’re focusing in on container runtime security—how to detect, respond to, and mitigate suspected threats for containers running in production. There’s no one way to respond to an attack, but there are best practices that you can follow, and in the event of a compromise, we want to make it easy for you to do the right thing.
Today, we’re excited to announce that you’ll soon be able to manage security alerts for your clusters in Cloud Security Command Center (Cloud SCC), a central place on Google Cloud Platform (GCP) to unify, analyze and view security data across your organization. Further, even though we just announced Cloud SCC a few weeks ago, already five container security companies have integrated their tools with Cloud SCC to help you better secure the containers you’re running on Google Kubernetes Engine.
With your Kubernetes Engine assets in Cloud SCC, you can view security alerts for your Kubernetes Engine clusters in a single pane of glass, and choose how to best take action. You’ll be able to view, organize and index your Kubernetes Engine cluster assets within each project and across all the projects that your organization is working on. In addition, you’ll be able to associate your container security findings to either specific clusters, container images and/or VM instances as appropriate.
Until then, let’s take a deeper look at runtime security in the context of containers and Kubernetes Engine.
Responding to bad behavior in your containers
Security operations typically includes several steps. For example, NIST’s well known framework includes steps to identify, protect, detect, respond, and recover. In containers, this translates to detecting abnormal behavior, remediating a potential threat, performing forensics after an incident, and enforcing runtime policies in isolated environments such as the new gVisor sandboxed container environment.
But first, how do you detect that a container is acting maliciously? Typically, this requires creating a baseline of what normal behaviour looks like, and using rules or machine learning to detect variation from that baseline. There are many ways to create that initial behavioral baseline (i.e., how a container should act), for example, using kprobes, tracepoints, and eBPF kernel inspection. Deviation from this baseline then triggers an alert or action.
If you do find a container that appears to be acting badly, there are several actions you might want to take, in increasing order of severity:
Just send an alert. This notifies your security response team that something unusual had been detected. For example, if security monitoring is relatively new in your environment, you might be worried about having too many false positives. Cloud SCC lets you unify container security signals with other security signals across your organization. With Cloud SCC, you can: see the live monitored state of container security issues in the dashboard; access the details either in the UI or via the API; and set up customer-defined filters to generate Cloud Pub/Sub topics that can then trigger email, SMS, or bugs in Jira.
Isolate a container. This moves the container to a new network, or otherwise restricts its network connectivity. For example, you might want to do this if you think one container is being used to perform a denial of service attack on other services.
Pause a container, e.g., `gcloud compute instances stop`. This suspends all running processes in the container. For example, if you detect suspected cryptomining, you might want to limit resource use and make a backup prior to further investigation.
Restart a container, e.g., `docker restart` or `kubectl delete pod`. This kills and restarts a running container, and resets the current state of the application. For example, if you suspect an attacker has created a foothold in your container, this might be a first step to counter their efforts, but this won’t stop an attacker from replicating an attack—just temporarily remove them.
Kill a container, i.e., `docker kill`. This kills a running container, halting all running processes (and less gracefully than `docker stop`). This is typically a last resort for a suspected malicious container.
Analyzing a security incident
After an incident, your security forensics team might step in to determine what really happened, and how they can prevent it the next time around. On Kubernetes Engine, you can look at a few different sources of event information:
Security event history and monitoring status in Cloud SCC. You can view the summary status of your assets and security findings in the dashboard, configure alerting and notification to a custom Cloud Pub/Sub topic and then query and explore specific events in detail either via the UI or API.
Container logs, kubelet logs, Docker logs, and audit logs in Stackdriver. Kubernetes Engine Audit Logging captures certain actions by default, both in the Kubernetes Engine API (e.g., create cluster, remove nodepool) and in the Kubernetes API (e.g., create a pod, update a DaemonSet).
Snapshots. You can snapshot a container’s filesystem in docker with `docker export`.
To give you the best options for container runtime security on Google Cloud Platform, we’re excited to announce five partners who have already integrated with Cloud SCC: Aqua Security, Capsule8, Stackrox, Sysdig Secure, and Twistlock. These technical integrations allow you to use their cutting-edge security tools with your deployments, and view their findings and recommendations directly in Cloud SCC.
Aqua Security
Aqua’s integration with Cloud SCC provides real-time visibility into container security events and policy violations, including:
Inventory of vulnerabilities in container images in Google Container Registry, and alerts on new vulnerabilities
Container user security violations, such as privilege escalation attempts
Attempts to run unapproved images
Policy violations of container network, process, and host resource usage
To learn more and get a demo of Aqua’s integration with Google Cloud SCC, visit aquasec.com/gcp
Capsule8
Capsule8 is a real-time, zero-day attack detection platform purpose-built for modern production infrastructures. The Capsule8 integration with Google delivers continuous security across GCP environments to detect and help shut down attacks as they happen. Capsule8 runs entirely in the customer's Google Compute Engine environment and accounts and only requires a lightweight installation-free sensor running on each Compute Engine instance to stream behavioral telemetry to identify and help shut down zero-day attacks in real-time.
StackRox has partnered with Google Cloud to deliver comprehensive security for customers running containerized applications on Kubernetes Engine. StackRox visualizes the container attack surface, exposes malicious activity using machine learning, and stops attacks. Under the partnership, StackRox is working closely with the GCP team to offer an integrated experience for Kubernetes and Kubernetes Engine users as part of Cloud SCC.
“My current patchwork of security vendor solutions is no longer viable – or affordable – as our enterprise is growing too quickly and cyber threats evolve constantly. StackRox has already unified a handful of major product areas into a single security engine, so moving to containers means positive ROI."
- Gene Yoo, Senior Vice President and Head of Information Security at City National Bank
By bringing together container visibility and a native Kubernetes Engine integration, Sysdig Secure provides the ability to block threats, enforce compliance, and audit activity across an infrastructure through microservices-aware security policies. Security events are enriched with hundreds of container and Kubernetes metadata before being sent to Cloud SCC. This brings the most relevant signals to your attention and correlates Sysdig events with other security information sources so you can have a single point of view and the ability to react accordingly at all levels.
"We chose to develop on Google Cloud for its robust, cost-effective platform. Sysdig is the perfect complement because it allows us to effectively secure and monitor our Kubernetes services with a single agent. We're excited to see that Google and Sysdig are deepening their partnership through this product integration.”
- Ashley Penny, VP of infrastructure, Cota Healthcare.
Twistlock surfaces cloud-native security intel vulnerability findings, compliance posture, runtime anomalies, and firewall logs directly into Cloud SCC. Customers can use Cloud SCC's big data capabilities to analyze and alert at scale, integrating container, serverless, and cloud-native VM security intelligence alongside other apps and workloads connected to Cloud SCC.
"Twistlock enables us to pinpoint vulnerabilities, block attacks, and easily enforce compliance across our environment, giving our team the visibility and control needed to run containers at scale."
If you use Kubernetes, you know how much easier it makes it to build and deploy container-based applications. But that’s only one part of the challenge: you need to be able to inspect your application and underlying infrastructure to understand complex system interactions and debug failures, bottlenecks and other abnormal behavior—to ensure your application is always available, running fast, and doing what it's supposed to do. Up until now, observing a complex Kubernetes environment has required manually stitching together multiple tools and data coming from many sources, resulting in siloed views of system behavior.
Today, we are excited to announce the beta release of Stackdriver Kubernetes Monitoring, which lets you observe Kubernetes in a comprehensive fashion, simplifying operations for both developers and operators.
Monitor multiple clusters at scale, right out of the box
Stackdriver Kubernetes Monitoring integrates metrics, logs, events, and metadata from your Kubernetes environment and from your Prometheus instrumentation, to help you understand, in real time, your application’s behavior in production, no matter your role and where your Kubernetes deployments run.
As a developer, for instance, this increased observability lets you inspect Kubernetes objects (e.g., clusters, services, workloads, pods, containers) within your application, helping you understand the normal behavior of your application, as well as analyze failures and optimize performance. This helps you focus more on building your app and less on instrumenting and managing your Kubernetes infrastructure.
As a Site Reliability Engineer (SRE), you can easily manage multiple Kubernetes clusters in a single place, regardless of whether they’re running on public or private clouds. Right from the start, you get an overall view of the health of each cluster and can drill down and up the various Kubernetes objects to obtain further details on their state, including viewing key metrics and logs. This helps you proactively monitor your Kubernetes environment to prevent problems and outages, and more effectively troubleshoot issues.
If you are a security engineer, audit data from your clusters is sent to Stackdriver Logging where you can see all of the current and historical data associated with the Kubernetes deployment to help you analyze and prevent security exposures.
Works with open source
Stackdriver Kubernetes Monitoring integrates seamlessly with the leading Kubernetes open-source monitoring solution, Prometheus. Whether you want to ingest third-party application metrics, or your own custom metrics, your Prometheus instrumentation and configuration works within Stackdriver Kubernetes Monitoring with no modification.
At Google, we believe that having an enthusiastic community helps a platform stay open and portable. We are committed to continuing our contributions to the Prometheus community to help users run and observe their Kubernetes workloads in the same way, anywhere they want.
To this end, we will expand our current integration with Prometheus to make sure all the hooks we need for our sidecar exporter are available upstream by the time Stackdriver Kubernetes Monitoring becomes generally available.
We also want to extend a warm welcome to Fabian Reinartz, one of the Prometheus maintainers, who has just joined Google as a Software Engineer. We're excited about his future contributions in this space.
Works great alone, plays better together
Stackdriver Kubernetes Monitoring allows you to get rich Kubernetes observability all in one place. When used together with all the other Stackdriver products, you have a powerful toolset that helps you proactively monitor your Kubernetes workloads to prevent failure, speed up root cause analysis and reduce your mean-time-to-repair (MTTR) when issues occur.
For instance, you can configure alerting policies using Stackdriver's multi-condition alerting system to learn when there are issues that require your attention. Or you can explore various other metrics via our interactive metrics explorer, and pursue root cause hypotheses that may lead you to search for specific logs in Stackdriver Logging or inspect latency data in Stackdriver Trace.
Easy to get started on any cloud or on-prem
Stackdriver Kubernetes Monitoring is pre-integrated with Google Kubernetes Engine, so you can immediately use it on your Kubernetes Engine workloads. It can also be integrated with Kubernetes deployments on other clouds or on-prem infrastructure, so you can access a unified collection of logs, events, and metrics for your application, regardless of where your containers are deployed.
Benefits
Stackdriver Kubernetes Monitoring gives you:
Reliability: Faster time-to-resolution for issues thanks to comprehensive visibility into your Kubernetes environment, including infrastructure, application and service data.
Choice: Ability to work with any cloud, accessing a unified collection of metrics, logs, and events for your application, regardless of where your containers are deployed.
A single source of truth: Customized views appropriate for developers, operators, and security engineers, drawing from a single, unified source of truth for all logs, metrics and monitoring data.
Early access customers have used Stackdriver Kubernetes Monitoring to increase visibility into their Kubernetes environments and simplify operations.
"Given the scale of our business we often have to use multiple tools to help manage the complex environment of our infrastructure. Every second is critical for eBay as we aim to easily connect our millions active buyers with the items they’re looking for. With the early access to Stackdriver Kubernetes Monitoring, we saw the benefits of a unified solution, which helps provide us with faster diagnostics for the eBay applications running on Kubernetes Engine, ultimately providing our customers with better availability and less latency.”
-- Christophe Boudet, Staff Devops, eBay
Getting started with Stackdriver Kubernetes Monitoring
Stackdriver Kubernetes Monitoring Beta is available for testing in Kubernetes Engine alpha clusters today, and will be available in production clusters as soon as Kubernetes 1.10 rolls out to Kubernetes Engine.
Please help us help you improve your Kubernetes operations! Try Stackdriver Kubernetes Monitoring today and let us know how we can make it better and easier for you to manage your Kubernetes applications. Join our user group and send us your feedback at [email protected]
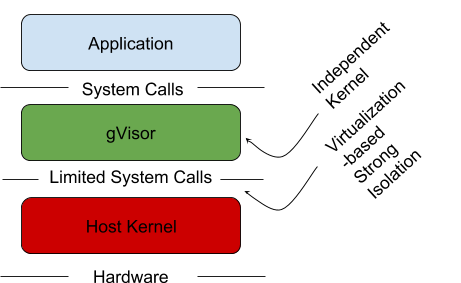
A growing desire to run more heterogenous and less trusted workloads has created a new interest in sandboxed containers—containers that help provide a secure isolation boundary between the host OS and the application running inside the container.
To that end, we’d like to introduce gVisor, a new kind of sandbox that helps provide secure isolation for containers, while being more lightweight than a virtual machine (VM). gVisor integrates with Docker and Kubernetes, making it simple and easy to run sandboxed containers in production environments.
Traditional Linux containers are not sandboxes
Applications that run in traditional Linux containers access system resources in the same way that regular (non-containerized) applications do: by making system calls directly to the host kernel. The kernel runs in a privileged mode that allows it to interact with the necessary hardware and return results to the application.
With traditional containers, the kernel imposes some limits on the resources the application can access. These limits are implemented through the use of Linux cgroups and namespaces, but not all resources can be controlled via these mechanisms. Furthermore, even with these limits, the kernel still exposes a large surface area that malicious applications can attack directly.
Kernel features like seccomp filters can provide better isolation between the application and host kernel, but they require the user to create a predefined whitelist of system calls. In practice, it’s often difficult to know which system calls will be required by an application beforehand. Filters also provide little help when a vulnerability is discovered in a system call that your application requires.
Existing VM-based container technology
One approach to improve container isolation is to run each container in its own virtual machine (VM). This gives each container its own "machine," including kernel and virtualized devices, completely separate from the host. Even if there is a vulnerability in the guest, the hypervisor still isolates the host, as well as other applications/containers running on the host.
Running containers in distinct VMs provides great isolation, compatibility, and performance, but may also require a larger resource footprint.
Kata containers is an open-source project that uses stripped-down VMs to keep the resource footprint minimal and maximize performance for container isolation. Like gVisor, Kata contains an Open Container Initiative (OCI) runtime that is compatible with Docker and Kubernetes.
Sandboxed containers with gVisor
gVisor is more lightweight than a VM while maintaining a similar level of isolation. The core of gVisor is a kernel that runs as a normal, unprivileged process that supports most Linux system calls. This kernel is written in Go, which was chosen for its memory- and type-safety. Just like within a VM, an application running in a gVisor sandbox gets its own kernel and set of virtualized devices, distinct from the host and other sandboxes.
gVisor provides a strong isolation boundary by intercepting application system calls and acting as the guest kernel, all while running in user-space. Unlike a VM which requires a fixed set of resources on creation, gVisor can accommodate changing resources over time, as most normal Linux processes do. gVisor can be thought of as an extremely paravirtualized operating system with a flexible resource footprint and lower fixed cost than a full VM. However, this flexibility comes at the price of higher per-system call overhead and application compatibility—more on that below.
"Secure workloads are a priority for the industry. We are encouraged to see innovative approaches like gVisor and look forward to collaborating on specification clarifications and making improvements to joint technical components in order to bring additional security to the ecosystem."
— Samuel Ortiz, member of the Kata Technical Steering Committee and Principal Engineer at Intel Corporation
“Hyper is encouraged to see gVisor’s novel approach to container isolation. The industry requires a robust ecosystem of secure container technologies, and we look forward to collaborating on gVisor to help bring secure containers into the mainstream.”
— Xu Wang, member of the Kata Technical Steering Committee and CTO at Hyper.sh
Integrated with Docker and Kubernetes
The gVisor runtime integrates seamlessly with Docker and Kubernetes though runsc (short for "run Sandboxed Container"), which conforms to the OCI runtime API.
The runsc runtime is interchangeable with runc, Docker's default container runtime. Installation is simple; once installed it only takes a single additional flag to run a sandboxed container in Docker:
$ docker run --runtime=runsc hello-world
$ docker run --runtime=runsc -p 3306:3306 mysql
In Kubernetes, most resource isolation occurs at the pod level, making the pod a natural fit for a gVisor sandbox boundary. The Kubernetes community is currently formalizing the sandbox pod API, but experimental support is available today.
The runsc runtime can run sandboxed pods in a Kubernetes cluster through the use of either the cri-o or cri-containerd projects, which convert messages from the Kubelet into OCI runtime commands.
gVisor implements a large part of the Linux system API (200 system calls and counting), but not all. Some system calls and arguments are not currently supported, as are some parts of the /proc and /sys filesystems. As a result, not all applications will run inside gVisor, but many will run just fine, including Node.js, Java 8, MySQL, Jenkins, Apache, Redis, MongoDB, and many more.
Getting started
As developers, we want the best of both worlds: the ease of use and portability of containers, and the resource isolation of VMs. We think gVisor is a great step in that direction. Check out our repo on GitHub to find how to get started with gVisor and to learn more of the technical details behind it. And be sure to join our Google group to take part in the discussion!
If you’re at KubeCon in Copenhagen join us at our booth for a deep dive demo and discussion.
Also check out an interview with the gVisor PM to learn more.
With KubeCon in Copenhagen this week, it’s shaping up to be a busy week for Kubernetes news. Here’s another tidbit: Starting this week, we are launching the Kubernetes Podcast from Google, hosted by yours truly and Google Cloud Kubernetes advocacy lead, Craig Box. In this weekly conversation, we’ll focus on all the great things that are happening in the world of Kubernetes. From the news of the week to interviews with people in the community, we’re helping you stay up to date on everything Kubernetes.
In our first episode we spoke with Paris Pittman; Kubernetes Community Manager, about the community, how it’s different, and how to get involved (if you aren’t already). Next week, we’re talking about Kubeflow with David Aronchick.
We’re just getting started so we’d love for you to subscribe and give it a listen. You can check out the podcast on Google Play Music Podcasts, iTunes Podcasts, or your favorite podcast client (just search for Kubernetes Podcast and look for our logo). You can also subscribe by scanning the QR code for your platform below.
We hope you enjoy the podcast. Be sure to let us know if there are any particular topics you’d like us to discuss, guests you think we should interview, or technology/projects we should know about by email ([email protected]) or on Twitter (@KubernetesPod).
By Chris Kleban and Ari Liberman, Product Managers
Cloud-based hardware accelerators like Graphic Processing Units, or GPUs, are a great choice for computationally demanding workloads such as machine learning and high-performance computing (HPC). We strive to provide the widest selection of popular accelerators on Google Cloud to meet your needs for flexibility and cost. To that end, we’re excited to announce that NVIDIA Tesla V100 GPUs are now publicly available in beta on Compute Engine and Kubernetes Engine, and that NVIDIA Tesla P100 GPUs are now generally available.
Today’s most demanding workloads and industries require the fastest hardware accelerators. You can now select as many as eight NVIDIA Tesla V100 GPUs, 96 vCPU and 624GB of system memory in a single VM, receiving up to 1 petaflop of mixed precision hardware acceleration performance. The next generation of NVLink interconnects deliver up to 300GB/s of GPU-to-GPU bandwidth, 9X over PCIe, boosting performance on deep learning and HPC workloads by up to 40%. NVIDIA V100s are available immediately in the following regions: us-west1, us-central1 and europe-west4. Each V100 GPU is priced as low as $2.48 per hour for on-demand VMs and $1.24 per hour for Preemptible VMs. Like our other GPUs, the V100 is also billed by the second and Sustained Use Discounts apply.
Our customers often ask which GPU is the best for their CUDA-enabled computational workload. If you’re seeking a balance between price and performance, the NVIDIA Tesla P100 GPU is a good fit. You can select up to four P100 GPUs, 96 vCPUs and 624GB of memory per virtual machine. Further, the P100 is also now available in europe-west4 (Netherlands) in addition to us-west1, us-central1, us-east1, europe-west1 and asia-east1.
Our GPU portfolio offers a wide selection of performance and price options to help meet your needs. Rather than selecting a one-size-fits-all VM, you can attach our GPUs to custom VM shapes and take advantage of a wide selection of storage options, paying for only the resources you need.
* Maximum vCPU count and system memory limit on the instance might be smaller depending on the zone or the number of GPUs selected.
** GPU prices listed as hourly rate, per GPU attached to a VM that are billed by the second. Pricing for attaching GPUs to preemptible VMs is different from pricing for attaching GPUs to non-preemptible VMs. Prices listed are for US regions. Prices for other regions may be different. Additional Sustained Use Discounts of up to 30% apply to GPU on-demand usage only.
Google Cloud makes managing GPU workloads easy for both VMs and containers. On Google Compute Engine, customers can use instance templates and managed instance groups to easily create and scale GPU infrastructure. You can also use NVIDIA V100s and our other GPU offerings in Kubernetes Engine, where Cluster Autoscaler helps provide flexibility by automatically creating nodes with GPUs, and scaling them down to zero when they are no longer in use. Together with Preemptible GPUs, both Compute Engine managed instance groups and Kubernetes Engine’s Autoscaler let you optimize your costs while simplifying infrastructure operations.
LeadStage, a marketing automation provider, is impressed with the value and scale of GPUs on Google Cloud.
"NVIDIA GPUs work great for complex Optical Character Recognition tasks on poor quality data sets. We use V100 and P100 GPUs on Google Compute Engine to convert millions of handwritten documents, survey drawings, and engineering drawings into machine-readable data. The ability to deploy thousands of Preemptible GPU instances in seconds was vastly superior to the capacity and cost of our previous GPU cloud provider."
— Adam Seabrook, Chief Executive Officer, LeadStage
Chaos Group provides rendering solutions for visual effects, film, architectural, automotive design and media and entertainment, and is impressed with the speed of NVIDIA V100s on Google Cloud.
"V100 GPUs are great for running V-Ray Cloud rendering services. Among all possible hardware configurations that we've tested, V100 ranked #1 on our benchmarking platform. Thanks to V100 GPUs we can use cloud GPUs on-demand on Compute Engine to render our clients' jobs extremely fast." — Boris Simandoff, Director of Engineering, Chaos Group
If you have computationally demanding workloads, GPUs can be a real game-changer. Check our GPU page to learn more about how you can benefit from P100, V100 and other Google Cloud GPUs!
Editor’s note: Today is the second installment in a seven-part video and blog series from Google Developer Advocate Sandeep Dinesh on how to get the most out of your Kubernetes environment.
As you start to build more and more services on top of Kubernetes, simple tasks start to get more complicated. For example, teams can’t create Kubernetes Services or Deployments with the same name. If you have thousands of pods, just listing them all would take some time, let alone actually administering them! And these are just the tip of the iceberg.
In this episode of Kubernetes Best Practices, let’s take a look at how Kubernetes Namespaces can make managing your Kubernetes resources easier.
What is a Namespace?
You can think of a Namespace as a virtual cluster inside your Kubernetes cluster. You can have multiple namespaces inside a single Kubernetes cluster, and they are all logically isolated from each other. They can help you and your teams with organization, security, and even performance!
The “default” Namespace
In most Kubernetes distributions, the cluster comes out of the box with a Namespace called “default.” In fact, there are actually three namespaces that Kubernetes ships with: default, kube-system (used for Kubernetes components), and kube-public (used for public resources). kube-public isn’t really used for much right now, and it’s usually a good idea to leave kube-system alone, especially in a managed system like Google Kubernetes Engine. This leaves the default Namespace as the place where your services and apps are created.
There is absolutely nothing special about this Namespace, except that the Kubernetes tooling is set up out of the box to use this namespace and you can’t delete it. While it is great for getting started and for smaller production systems, I would recommend against using it in large production systems. This is because it is very easy for a team to accidentally overwrite or disrupt another service without even realizing it. Instead, create multiple namespaces and use them to segment your services into manageable chunks.
Creating Namespaces
Don’t be afraid to create namespaces. They don’t add a performance penalty, and in many cases can actually improve performance as the Kubernetes API will have a smaller set of objects to work with.
Creating a Namespace can be done with a single command. If you wanted to create a Namespace called ‘test’ you would run:
kubectl create namespace test
Or you can create a YAML file and apply it just like any other Kubernetes resource.
test.yaml:
kind: Namespace
apiVersion: v1
metadata:
  name: test
  labels:
    name: test
kubectl apply -f test.yaml
Viewing Namespaces
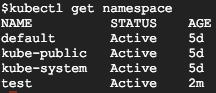
You can see all the Namespaces with the following command:
kubectl get namespace
You can see the three built-in Namespaces, as well as the new Namespace called ‘test.’
Creating Resources in the Namespace
Let’s take a look at a simple YAML to create a Pod:
You might notice that there is no mention of namespaces anywhere. If you run a `kubectl apply` on this file, it will create the Pod in the current active namespace. This will be the “default” namespace unless you change it.
There are two ways to explicitly tell Kubernetes in which Namespace you want to create your resources.
One way is to set the “namespace” flag when creating the resource:
kubectl apply -f pod.yaml --namespace=test
You can also specify a Namespace in the YAML declaration.
apiVersion: v1
kind: Pod
metadata:
  name: mypod
  namespace: test
  labels:
    name: mypod
spec:
  containers:
  - name: mypod
    image: nginx
If you specify a namespace in the YAML declaration, the resource will always be created in that namespace. If you try to use the “namespace” flag to set another namespace, the command will fail.
Viewing resources in the Namespace
If you try to find your Pod, you might notice you can’t!
$ kubectl get pods
No resources found.
This is because all commands are run against the currently active Namespace. To find your Pod, you need to use the “namespace” flag.
$ kubectl get pods --namespace=test
NAME      READY     STATUS    RESTARTS   AGE
mypod     1/1       Running   0          10s
This can get annoying quickly, especially if you are a developer working on a team that uses its own Namespace for everything and don’t want to use the “namespace” flag for every command. Let’s see how we can fix that.
Managing your active Namespace
Out of the box, your active namespace is the “default” namespace. Unless you specify a Namespace in the YAML, all Kubernetes commands will use the active Namespace.
Unfortunately, trying to manage your active Namespace with kubectl can be a pain. Fortunately, there is a really good tool called kubens (created by the wonderful Ahmet Alp Balkan) that makes it a breeze!
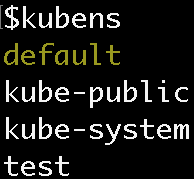
When you run the ‘kubens’ command, you should see all the namespaces, with the active namespace highlighted:
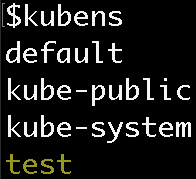
To switch your active namespace to the ‘test’ Namespace, run:
kubens test
Now you can see that the ‘test’ Namespace is active:
Now, if you run kubectl commands, the Namespace will be ‘test’ instead of ‘default’! This means you don’t need the namespace flag to see the pod in the test namespace.
$ kubectl get pods
NAME      READY     STATUS    RESTARTS   AGE
mypod     1/1       Running   0          10m
Cross Namespace communication
Namespaces are “hidden” from each other, but they are not fully isolated by default. A service in one Namespace can talk to a service in another Namespace. This can often be very useful, for example to have your team’s service in your Namespace communicate with another team’s service in another Namespace.
When your app wants to access a Kubernetes sService, you can use the built-in DNS service discovery and just point your app at the Service’s name. However, you can create a service with the same name in multiple Namespaces! Thankfully, it’s easy to get around this by using the expanded form of the DNS address.
Services in Kubernetes expose their endpoint using a common DNS pattern. It looks like this:
<Service Aame>.<Namespace Name>.svc.cluster.local
Normally, you just need the Service’s name and DNS will automatically resolve to the full address. However, if you need to access a Service in another Namespace just use the Service name plus the Namespace name.
For example, if you want to connect to the “database” service in the “test” namespace, you can use the following address:
database.test
If you want to connect to the “database” service in the “production” namespace, you can use the following address:
database.production
Warning: If you create a Namespace that maps to a TLD like “com” or “org”, and then create a Service that has the same name as a website, like “google” or “reddit”, Kubernetes will intercept requests to “google.com” or “reddit.com” and send them to your Service. This can often be very useful for testing and proxying, but can also easily break things in your cluster!
Note: If you do want to isolate Namespaces, you should use Network Policies to accomplish this. Stay tuned for more on this in a future episode!
Namespace granularity
A common question I get is how many Namespaces to create and for what purpose. What exactly are manageable chunks? Create too many Namespaces and they get in your way, but make too few and you miss out on the benefits.
I think the answer lies in what stage your project or company is in—from small team, to mature enterprise, each has its own organizational structure. Depending on your situation, you can adopt the relevant Namespace strategy.
The small team
In this scenario, you are part of a small team that is working on 5-10 microservices and can easily bring everyone into the same room. In this situation, it makes sense to launch all production services into the “default” Namespace. You might want to have a “production” and “development” namespace if you want to get fancy, but you are probably testing your development environment on your local machine using something like Minikube.
Rapidly growing team(s)
In this scenario, you have a rapidly growing team that is working on 10+ microservices. You are starting to split the team into multiple sub-teams that each own their own microservices. While everyone might know how the complete system works, it is getting harder to coordinate every change with everyone else. Trying to spin up the full stack on your local machine is getting more complicated every day.
It is necessary at this point to use multiple clusters or namespaces for production and development. Each team may choose to have their own namespace for easier manageability.
The large company
In a large company, not everyone knows everyone else. Teams are working on features that other teams might not know about. Teams are using services contracts to communicate with other microservices (e.g., gRPC) and service meshes to coordinate communication (e.g., istio). Trying to run the whole stack locally is impossible. Using a Kubernetes-aware Continuous Delivery system (e.g., Spinnaker) is highly recommended.
At this point, each team definitely needs its own namespace. Each team might even opt for multiple namespaces to run its development and production environments. Setting up RBAC and ResourceQuotas is a good idea as well. Multiple clusters start to make a lot of sense, but might not be necessary.
Note: I’ll deep dive into gRPC, Istio, Spinnaker, RBAC, and resources in future episodes!
Enterprise
At this scale, there are groups that don’t even know about the existence of other groups. Groups might as well be external companies, and services are consumed through well-documented APIs. Each group has multiple teams that have multiple microservices. Using all the tools I mentioned above are necessary; people should not be deploying services by hand and should be locked out of Namespaces they don’t own.
At this point, it probably makes sense to have multiple clusters to reduce the blast radius of poorly configured applications, and to make billing and resource management easier.
Conclusion
Namespaces can help significantly with organizing your Kubernetes resources and can increase the velocity of your teams. Stay tuned for future Kubernetes Best Practices episodes where I’ll show you how you can lock down resources in a Namespace and introduce more security and isolation to your cluster!
It’s only been a few months since we last spoke about securing Google Kubernetes Engine, but a lot has changed since then. Our security team has been working to further harden Kubernetes Engine, so that you can deploy sensitive containerized applications on the platform with confidence. Today we’ll walk through the latest best practices for hardening your Kubernetes Engine cluster, with updates for new features in Kubernetes Engine versions 1.9 and 1.10.
1. Follow the steps in the previous hardening guide
This new hardening guide assumes you’ve already completed the previous one. So go ahead and run though that guide real quick, and head on back over here.
2. Service Accounts and Access Scopes
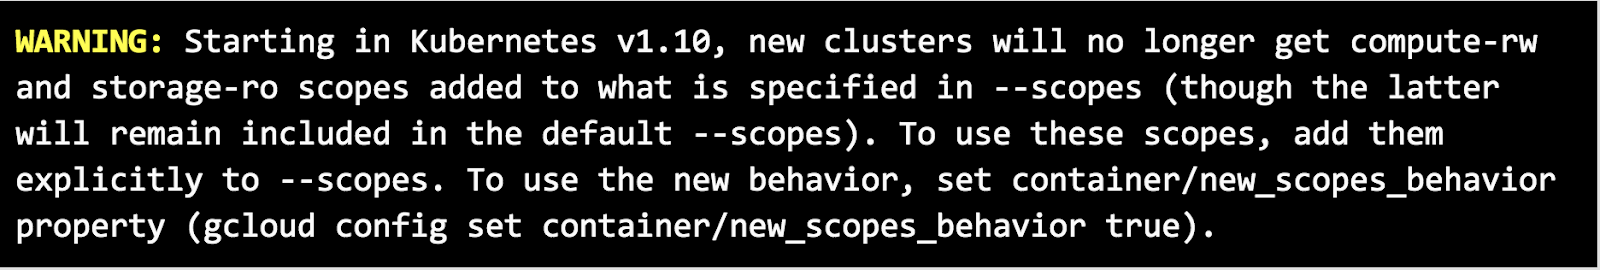
Next, you’ll need to think about service accounts and access control. We strive to set up Kubernetes Engine with usable but protected defaults. In Kubernetes Engine 1.7, we disabled the Kubernetes Dashboard (the web UI) by default, because it uses a highly privileged service account; and in 1.8, we disabled Attribute-Based Access Control (ABAC) by default, since Role-Based Access Control (RBAC) provides more complex permission management. Now, in Kubernetes Engine 1.10, new clusters will no longer have the compute-rw scope on node service accounts enabled by default, which reduces the blast radius of a potential node compromise. If a node were exploited, an attacker would not be able to use the service account to create new compute resources or read node metadata directly, which could be a path for privilege escalation.
If you’ve created a Kubernetes Engine cluster recently, you may have seen the following warning:
This means that if you have a special requirement to use the node’s service account to access storage or manipulate compute resources, you’ll need to explicitly include the required scopes when creating new clusters:
If you’re like most people and don’t use these scopes, your new clusters are automatically created with the gke-default permissions.
3. Create good RBAC roles
In the Kubernetes Engine 1.8 hardening blog post, we made sure node service accounts were running with the minimum required permissions, but what about the accounts used by DevOps team(s), Cluster administrators, or security teams? They all need different levels of access to clusters, which should be kept as restricted as possible.
While Cloud IAM provides great user access management at the Google Cloud Platform (GCP) Project level, RBAC roles control access within each Kubernetes cluster. They work in concert to help you enforce strong access control.
A good RBAC role should give a user exactly the permissions they need, and no more. Here is how to create and grant a user permission to view pods only, for example:
```
PROJECT_ID=$(gcloud config get-value project)
PRIMARY_ACCOUNT=$(gcloud config get-value account)
# Specify your cluster name.
CLUSTER=cluster-1

# You may have to grant yourself permission to manage roles
kubectl create clusterrolebinding cluster-admin-binding \
   --clusterrole cluster-admin --user $PRIMARY_ACCOUNT

# Create an IAM service account for the user “gke-pod-reader”, which
we will allow to read pods
gcloud iam service-accounts create gke-pod-reader \
    --display-name "GKE Pod Reader" \
    USER_EMAIL=gke-pod-reader@$PROJECT_ID.iam.gserviceaccount.com

cat > pod-reader-clusterrole.yaml<<EOF
kind: ClusterRole
apiVersion: rbac.authorization.k8s.io/v1
metadata:
  namespace: default
  name: pod-reader
rules:
- apiGroups: [""] # "" indicates the core API group
  resources: ["pods"]
  verbs: ["get", "watch", "list"]
EOF

kubectl create -f pod-reader-clusterrole.yaml

cat > pod-reader-clusterrolebinding.yaml<<EOF
kind: ClusterRoleBinding
apiVersion: rbac.authorization.k8s.io/v1
metadata:
  name: pod-reader-global
subjects:
- kind: User
  name: $USER_EMAIL
  apiGroup: rbac.authorization.k8s.io
roleRef:
  kind: ClusterRole
  name: pod-reader
  apiGroup: rbac.authorization.k8s.io
EOF

kubectl create -f pod-reader-clusterrolebinding.yaml

# Check the permissions of our Pod Reader user.
gcloud iam service-accounts keys create \
   --iam-account $USER_EMAIL pod-reader-key.json
gcloud container clusters get-credentials $CLUSTER
gcloud auth activate-service-account $USER_EMAIL \
   --key-file=pod-reader-key.json

# Our user can get/list all pods in the cluster.
kubectl get pods --all-namespaces

# But they can’t see the deployments, services, or nodes.
kubectl get deployments --all-namespaces
kubectl get services --all-namespaces
kubectl get nodes

# Reset gcloud and kubectl to your main user.
gcloud config set account $PRIMARY_ACCOUNT
gcloud container clusters get-credentials $CLUSTER
```
For most people, the predefined IAM roles available on Kubernetes Engine work great. If they meet your organization's needs then you’re good to go. If you need more fine-grained control, though, we also have the tools you need.
Custom IAM Roles let you define new roles, alongside the predefined ones, with the exact permissions your users require and no more.
5. Explore the cutting edge
We’ve launched a few new features to beta that we recommend turning on, at least in a test environment, to prepare for their general availability.
In order to use these beta features, you’ll need to enable the v1beta1 API on your cluster by running this command:
gcloud config set container/use_v1_api false
Conceal your host VM’s metadata Server [Beta]
Starting with the release of Kubernetes 1.9.3, Kubernetes Engine can conceal the Compute Engine metadata server from your running workloads, to prevent your workload from impersonating the node. Many practical attacks against Kubernetes rely on access to the node’s metadata server to extract the node’s identity document and token.
Constraining access to the underlying service account, by using least privilege service accounts as we did in the previous guide, is a good idea; preventing workloads from impersonating the node is even better. Note that containers running in your pods will still be able to access the non-sensitive data from the metadata server.
Kubernetes offers many controls to restrict your workloads at the pod spec level to execute with only their minimum required capabilities. Pod Security Policy allows you to set smart defaults for your pods, and enforce controls you want to enable across your fleet. The policies you define should be specific to the needs of your application. If you’re not sure where to start, we recommend the restricted-psp.yaml in the kubernetes.io documentation for example policies. It’s pretty restrictive, but it’s a good place to start, and you can loosen the restrictions later as appropriate.
If you’ve been following our blog series so far, hopefully you’ve already learned a lot about container security. For Kubernetes Engine, we’ve put together a new Overview of Kubernetes Engine Security, now published in our documentation, to guide you as you think through your security model. This page can act as a starting point to get a brief overview of the various security features and configurations that you can use to help ensure your clusters are following best practices. From that page, you can find links to more detailed guidance for each of the features and recommendations.
We’re working hard on many more Kubernetes Engine security features. To stay in the know, keep an eye on this blog for more security posts, and have a look at the Kubernetes Engine hardening guide for prescriptive guidance on how to bolster the security of your clusters.
Packaging server applications as container images is quickly gaining traction across tech organizations, game companies among them. They want to use containers to improve VM utilization, as well as take advantage of the isolated run-time paradigm. Despite their interest, many game companies don't know where to start.
Using the orchestration framework Kubernetes to deploy production-scale fleets of dedicated game servers in containers is an excellent choice. We recommend Google Kubernetes Engine as the easiest way to start a Kubernetes cluster for game servers on Google Cloud Platform (GCP) without manual setup steps. Kubernetes will help simplify your configuration management and select a VM with adequate resources to spin up a match for your players for you automatically.
We recently put together a tutorial that shows you how to integrate dedicated game servers with Kubernetes Engine, and how to automatically scale the number of VMs up and down according to player demand. It also offers some key storage strategies, including how to manage your game server assets without having to manually distribute them with each container image. Check it out, and let us know what other Google Cloud tools you’d like to learn how to use in your game operations. You can reach me on Twitter at @gcpjoe.