Editor’s note: Today is the sixth installment in a seven-part video and blog series from Google Developer Advocate Sandeep Dinesh on how to get the most out of your Kubernetes environment.
If you’re like most Kubernetes users, chances are you use services that live outside your cluster. For example, maybe you use the Twillio API to send text messages, or maybe the Google Cloud Vision API to do image analysis.
If your applications in your different environments connect to the same external endpoint, and have no plans to bring the external service into your Kubernetes cluster, it is perfectly fine to use the external service endpoint directly in your code. However, there are many scenarios where this is not the case.
A good example of this are databases. While some cloud-native databases such as Cloud Firestore or Cloud Spanner use a single endpoint for all access, most databases have separate endpoints for different instances.
At this point, you may be thinking that a good solution to finding the endpoint is to use ConfigMaps. Simply store the endpoint address in a ConfigMap, and use it in your code as an environment variable. While this solution works, there are a few downsides. You need to modify your deployment to include the ConfigMap and write additional code to read from the environment variables. But most importantly, if the endpoint address changes you may need to restart all running containers to get the updated endpoint address.
In this episode of “Kubernetes best practices”, let’s learn how to leverage Kubernetes’ built-in service discovery mechanisms for services running outside the cluster, just like you can for services inside the cluster! This gives you parity across your dev and prod environments, and if you eventually move the service inside the cluster, you don’t have to change your code at all.
Scenario 1: Database outside cluster with IP address
A very common scenario is when you are hosting your own database, but doing so outside the cluster, for example on a Google Compute Engine instance. This is very common if you run some services inside Kubernetes and some outside, or need more customization or control than Kubernetes allows.Hopefully, at some point, you can move all services inside the cluster, but until then you are living in a hybrid world. Thankfully, you can use static Kubernetes services to ease some of the pain.
In this example, I created a MongoDB server using Cloud Launcher. Because it is created in the same network (or VPC) as the Kubernetes cluster, it can be accessed using the high performance internal IP address. In Google Cloud, this is the default setup, so there is nothing special you need to configure.

Now that we have the IP address, the first step is to create a service:
kind: Service
apiVersion: v1
metadata:
 name: mongo
Spec:
 type: ClusterIP
 ports:
 - port: 27017
targetPort: 27017kind: Endpoints
apiVersion: v1
metadata:
name: mongo
subsets:
- addresses:
- ip: 10.240.0.4
ports:
- port: 27017mongodb://mongoScenario 2: Remotely hosted database with URI
If you are using a hosted database service from a third party, chances are they give you a unified resource identifier (URI) that you can use to connect to. If they give you an IP address, you can use the method in Scenario 1.In this example, I have two MongoDB databases hosted on mLab. One of them is my dev database, and the other is production.
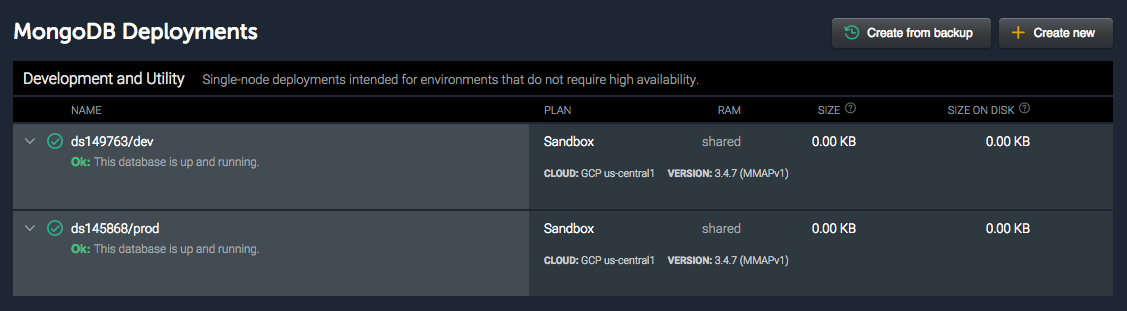
The connection strings for these databases are as follows:
mongodb://<dbuser>:<dbpassword>@ds149763.mlab.com:49763/devmongodb://<dbuser>:<dbpassword>@ds145868.mlab.com:45868/prodYou can create a “ExternalName” Kubernetes service, which gives you a static Kubernetes service that redirects traffic to the external service. This service does a simple CNAME redirection at the kernel level, so there is very minimal impact on your performance.
The YAML for the service looks like this:
kind: Service
apiVersion: v1
metadata:
 name: mongo
spec:
 type: ExternalName
externalName: ds149763.mlab.commongodb://<dbuser>:<dbpassword>@mongo:<port>/devHowever, if you can get the IP address, then you can do port remapping as I will explain in the next section.
Scenario 3: Remotely hosted database with URI and port remapping
While the CNAME redirect works great for services with the same port for each environment, it falls short in scenarios where the different endpoints for each environment use different ports. Thankfully we can work around that using some basic tools.The first step is to get the IP address from the URI.
If you run the nslookup, hostname, or ping command against the URI, you can get the IP address of the database.
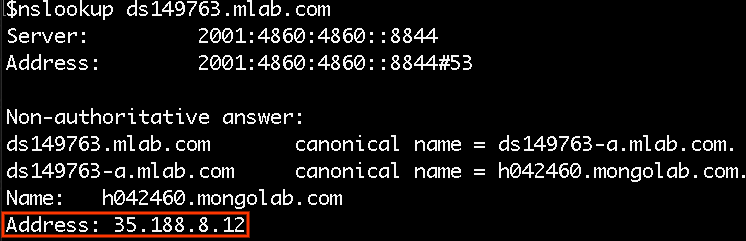
You can now create a service that remaps the mLab port and an endpoint for this IP address.
kind: Service
apiVersion: v1
metadata:
 name: mongo
spec:
 ports:
 - port: 27017
   targetPort: 49763
---
kind: Endpoints
apiVersion: v1
metadata:
 name: mongo
subsets:
 - addresses:
     - ip: 35.188.8.12
   ports:
- port: 49763With this, you can connect to the remote database without needing to specify the port. The Kubernetes service does the port remapping transparently!
mongodb://<dbuser>:<dbpassword>@mongo/devConclusion
Mapping external services to internal ones gives you the flexibility to bring these services into the cluster in the future while minimizing refactoring efforts. Even if you don’t plan to bring them in today, you never know what tomorrow might bring! Additionally, it makes it easier to manage and understand which external services your organization is using.If the external service has a valid domain name and you don’t need port remapping, then using the “ExternalName” service type is an easy and quick way to map the external service to an internal one. If you don’t have a domain name or need to do port remapping, simply add the IP addresses to an endpoint and use that instead.
Going to Google Cloud Next18? Stop by to meet me and other Kubernetes team members in the "Meet the Experts" zone! Hope to see you there!