What’s changing
We’re adding several new features that will give you more ways to work with, display, and organize your BigQuery data when using Connected Sheets. Specifically, the new abilities and improvements are:
- Column stats
- Filter by value
- Calculated fields for pivot tables
- Pivot table grouping
- Slicers
See below for more details on these features. If you’re new to BigQuery and Connected Sheets, check out this video demo.
Who’s impacted
Admins and End users
Why you’d use it
Column stats
This new feature allows easy access to aggregated insights about the data in any column of your BigQuery table. These insights help you understand the shape of your data and include sum, average, median, unique count, max, min, list of most and least frequent values and distribution of the values in the column.
Filter by value
In addition to the ability to filter a column “by condition”, you can now filter a column “by value”. Connected Sheets will retrieve the list of values for any column that you can access for your analysis. Use the Help Center to learn more about filtering columns by value when using Connected Sheets.

Calculated fields in pivot tables
Calculated fields for pivot tables allow for custom aggregation of formulas in pivot table buckets. Use the Help Center to learn more about how to use calculated fields.
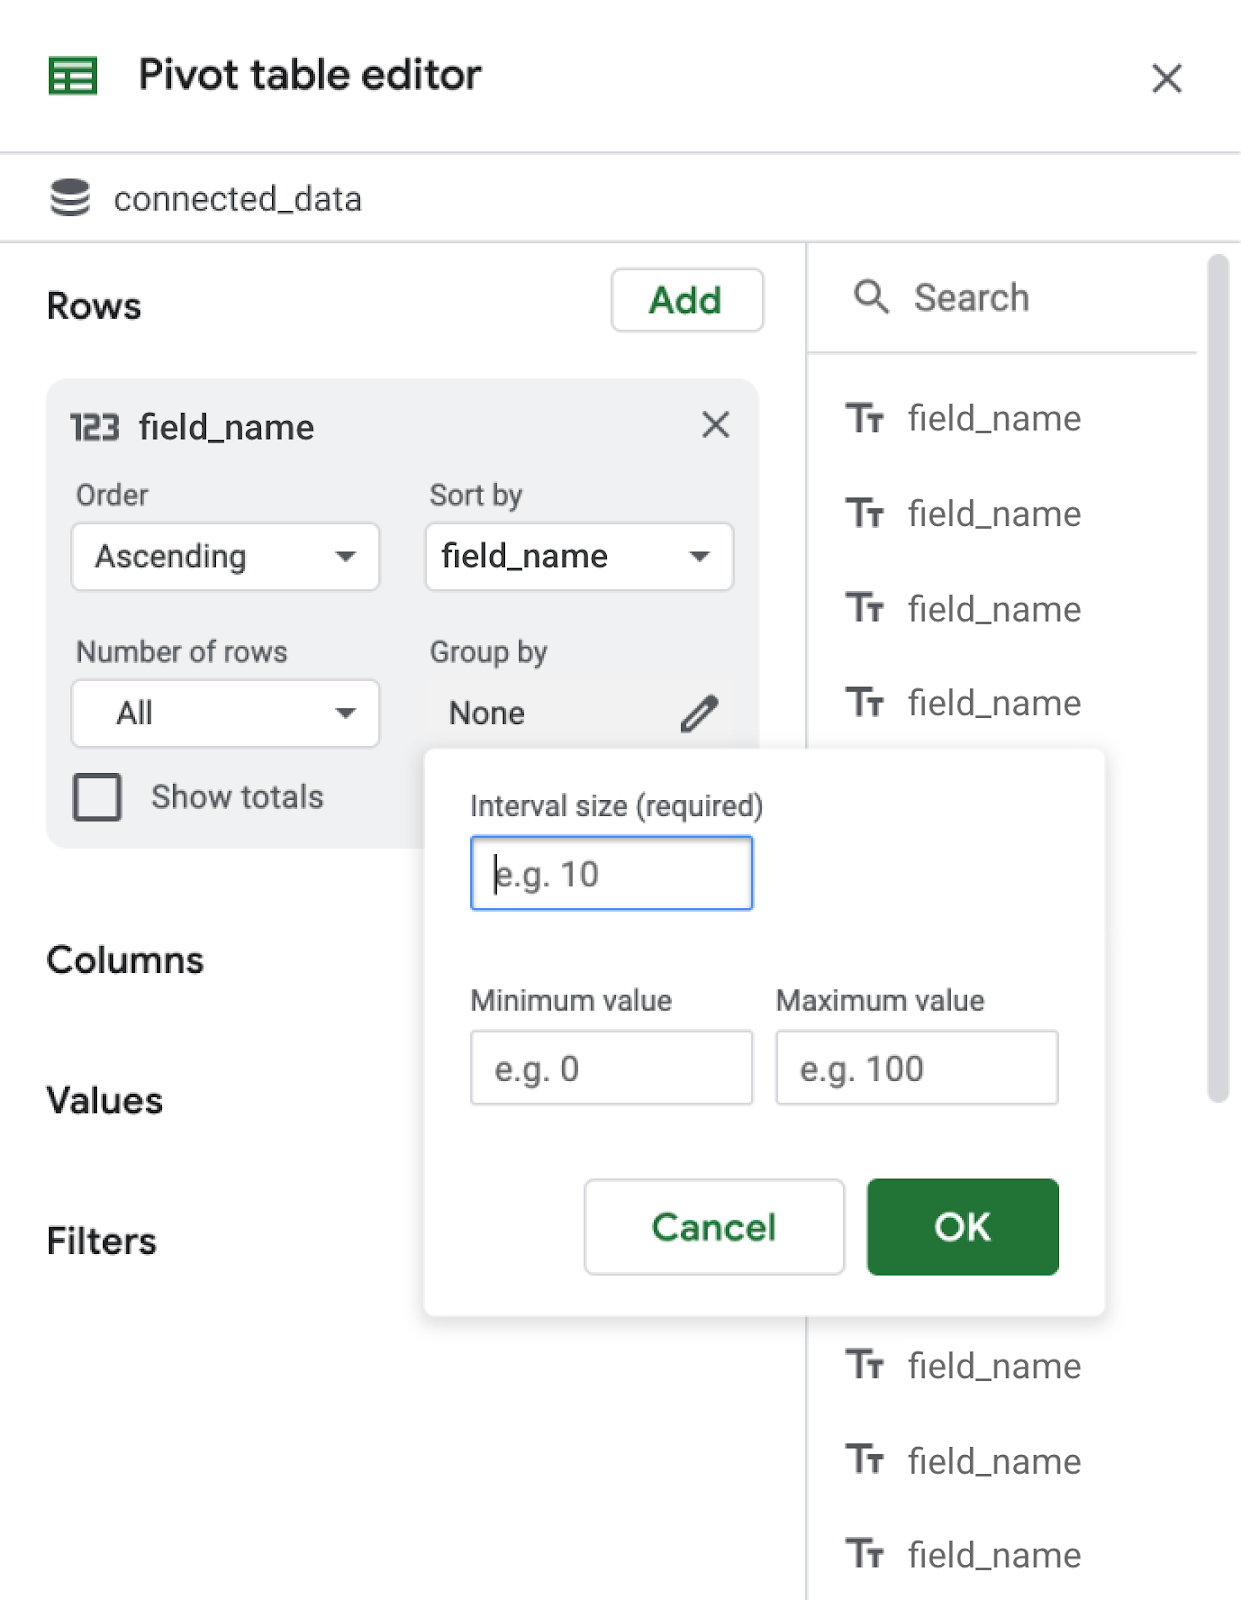
Pivot table grouping
You can now group numeric values from your source data into buckets of equal size in Connected Sheets pivot tables. This is useful when you’re working with a pivot table with numerous unique values—grouping can better narrow down your data by a minimum, maximum, and interval. Use the Help Center to learn more about using pivot table grouping in Google Sheets.

Slicers for Connected Sheets
You can also use a slicer to filter your Connected Sheets tables, charts, and pivot tables. A slicer is based on a column/field from the BigQuery data source. The slicer influences all the Connected Sheets charts, extracts and pivot tables in the same tab. Use the Help Center to learn more about using slicers with Connected Sheets.
Additional details
In the coming weeks, we will introduce improvements for scheduled refresh, allowing you to automate refresh at a specified frequency with more granular scheduling options. These options include:
- Hourly refreshes
- Specific start dates
- Frequency options such as every five days, every two months, etc.
When this feature becomes available, we’ll provide an update on the Workspace Updates Blog.
Getting started
- Admins: Connected Sheets will be ON by default. To use it, you must have set up BigQuery for your organization, and users must have access to tables or views in BigQuery. Use our Help Center to learn more about how to set up Connected Sheets.
- End users: These features will be available by default. Visit the Help Center to learn more about analyzing and refreshing BigQuery data in Google Sheets using Connected Sheets.
Rollout pace
- Rapid and Scheduled Release domains: These features are available now for all users.
- We’ll provide an update when the scheduled refresh improvements become available.
Availability
- Available to Google Workspace Enterprise Essentials, Enterprise Standard, Enterprise Plus, and Education Plus customers
- Not available to Google Workspace Essentials, Business Starter, Business Standard, Business Plus, Education Fundamentals, Frontline, and Nonprofits, as well as G Suite Basic and Business customers