Category Archives: Google Cloud Platform Blog

Product updates, customer stories, and tips and tricks on Google Cloud Platform

Why we migrated to Firebase and GCP: Smash.gg


[Editor’s note: Smash.gg is an esports platform used by players and organizers worldwide, running nearly 2,000 events per month with 60,000+ competitors, and recently hosted brackets for EVO 2017, the world’s largest fighting game tournament. This is its first post in a multi-part series about migrating to Google Cloud Platform (GCP) — what got them interested in GCP, why they migrated to it, and a few of the benefits they’ve seen as a result. Stay tuned for future posts that will cover more technical details about migrating specific services.]

Players in online tournaments running on smash.gg need to be able to interact in real time. Both entrants must confirm that they are present, set up the game, and reach a consensus on the results of the match. They also need a simple chat service to resolve any issues with joining or reporting the match, to talk to one another and to tournament moderators.

We built our initial implementation of online match reporting with an off-the-shelf chat service and UI interactions that weren’t truly real-time. When the chat service failed in a live tournament, it became clear that we needed a better solution. We looked into building our own using a websocket-based approach, and a few services like PubNub and Firebase. Ultimately, we decided to launch with Firebase because it’s widely used, is backed by Google, and is incredibly well-priced.

Two players checking into, setting up, and reporting an online match using the Firebase Realtime Database for real-time interactions. 

We got our start with Firebase in May, 2016. Our first release used the Firebase Realtime Database as a kind of real-time cache to keep match data in sync between both entrants. When matches were updated or reported on our backend, we also wrote the updated match data to Firebase. We use React and Flux so we made a wrapper component to listen to Firebase and dispatch updated match data to our Flux stores. Implementing a chat service with Firebase was similarly easy. Using Firechat as inspiration, it took us about a day to build the initial implementation and another day to make it production-ready.

Compared with rolling our own solution, Firebase was an obvious choice given the ease of development and time/financial cost savings. Ultimately, it reduced the load on our servers, simplified our reporting flow, and made the match experience truly real-time. Later that year, we started using Firebase Cloud Messaging (FCM) to send browser push notifications using Cloud Functions triggers as Firebase data changed (e.g., to notify admins of moderator requests). Like the Realtime Database, Cloud Functions was incredibly easy to use and felt magical the first time we used it. Cloud Functions also gave us a window into how well Firebase interacts with Google Cloud Platform (GCP) services like Cloud Pub/Sub and Google BigQuery.

Migrating to GCP 

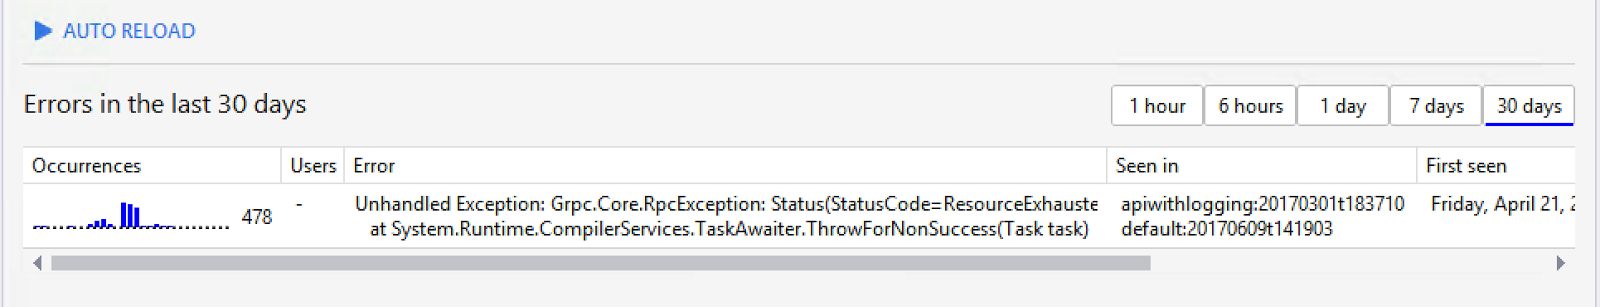
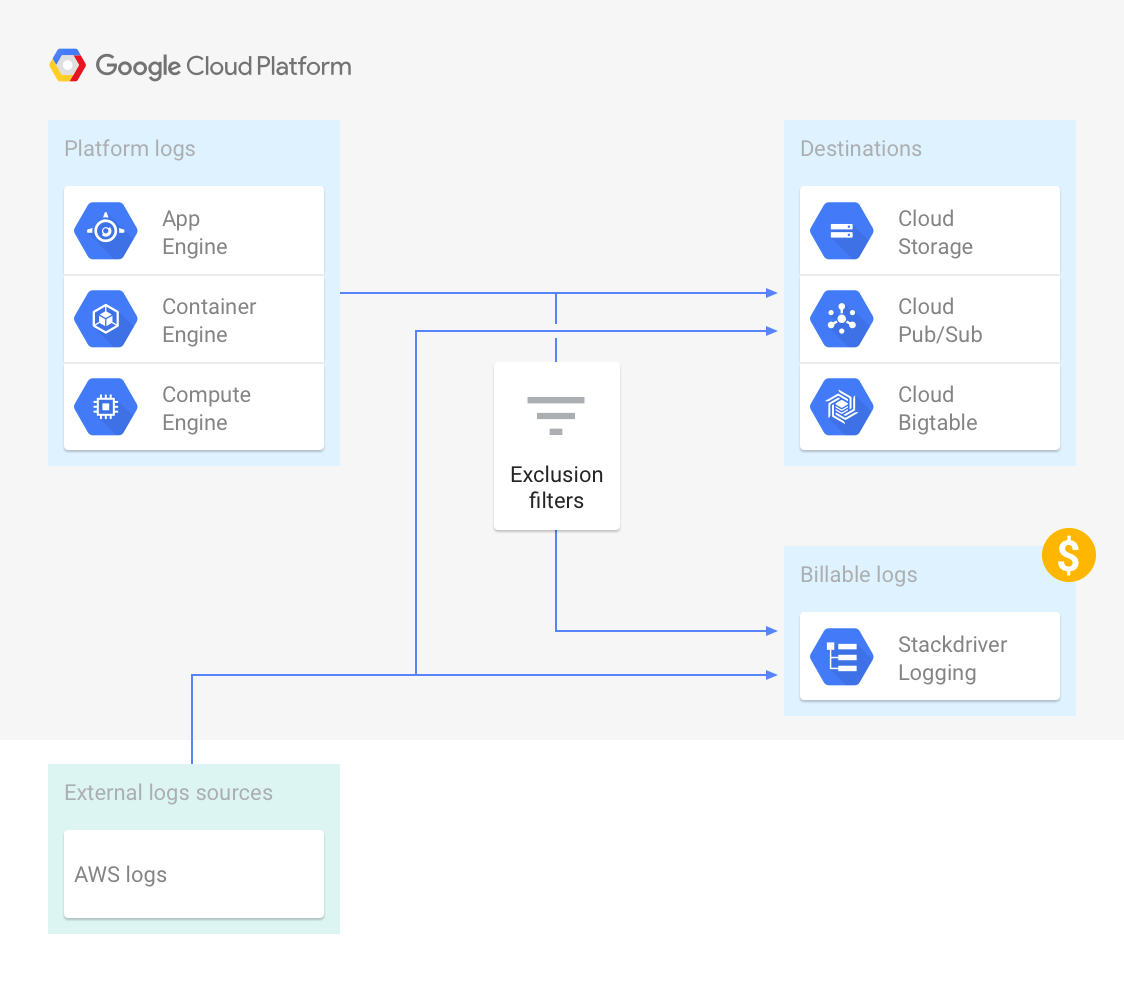
In March of 2017 we attended Google Cloud Next '17 for the Cloud Functions launch. There, we saw that other GCP products had a similar focus on improving the developer experience and lowering development costs. Current products like Pub/Sub, Stackdriver Trace and Logging, and Google Cloud Datastore solved some of our immediate needs. Out of the box, these services gave us things that we were planning to build to supplement products from our existing service provider. And broadly speaking, GCP products seemed to focus on improving core developer workflows to reduce development and maintenance time. After seeing some demos of the products interacting (e.g., Google Container Engine and App Engine with Stackdriver Trace/Logging, Stackdriver with Pub/Sub and BigQuery), we decided to evaluate a full migration.

We started migrating our application in mid May, using the following services: Container Engine, Pub/Sub, Google Cloud SQL, Datastore, BigQuery, and Stackdriver. During the migration, we took the opportunity to re-architect some of our core services and move to Kubernetes. Most of our application was already containerized but had previously been running on a PaaS-like service so Kubernetes was a fairly dramatic shift. While Kubernetes had many benefits (e.g., industry standard, more efficient use of cloud instances, application portability, and immutable infrastructure defined in code), we also lost some top-level application metrics that our previous PaaS service had provided: for instance overall Requests Per Second (RPS), RPS by status, and latency. We were able to easily recreate these graphs from our container logs using log-based metrics and logs export from Stackdriver to BigQuery. You could also do this using other services, but our GCP-only approach was a quick and mostly free way for us to get to parity while experimenting with GCP services.

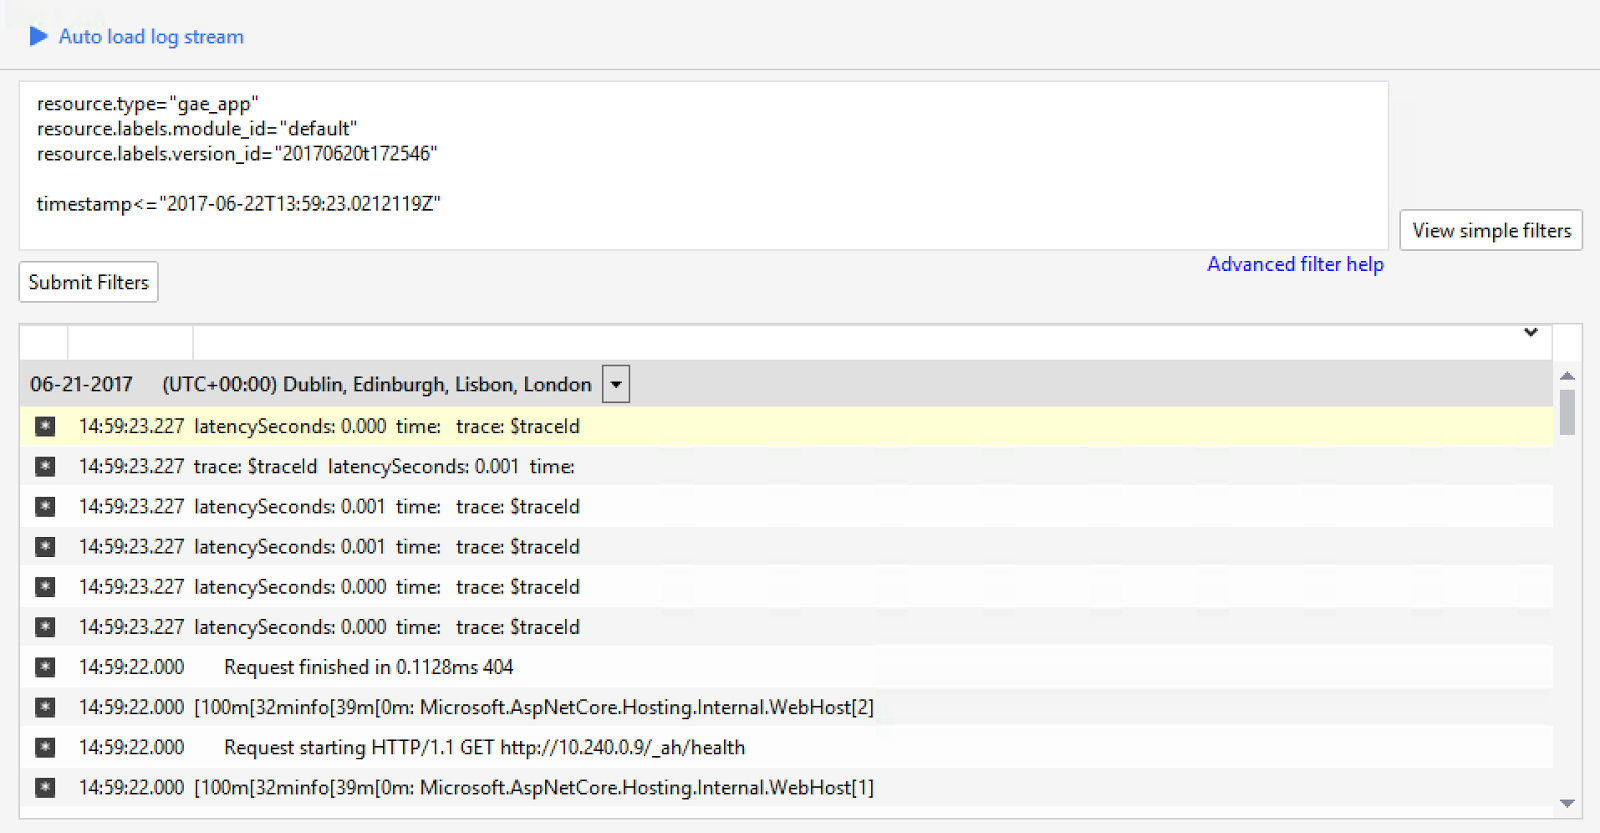
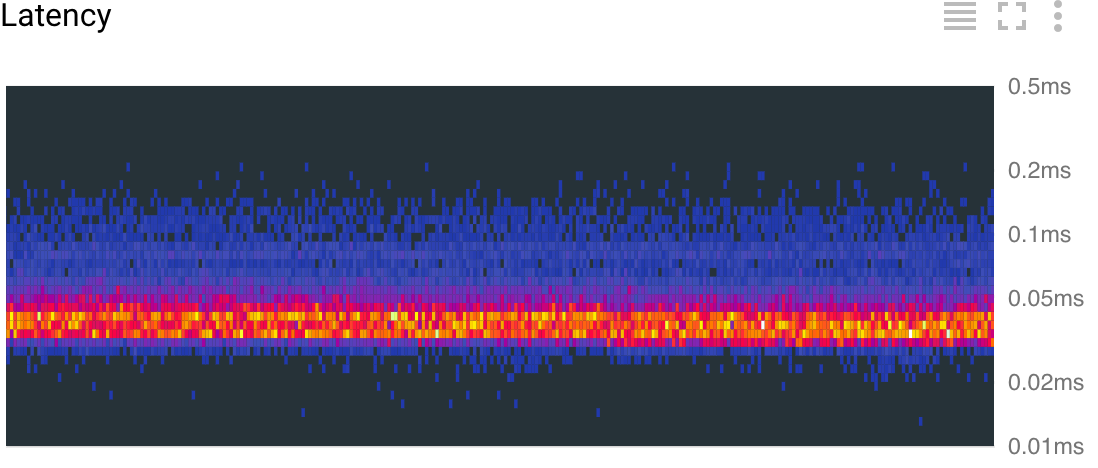
Request timing and analysis using Stackdriver Trace was another selling point in GCP that we didn’t have with our previous service. However, at the time of our migration, the Trace SDK for PHP (our backend services are in PHP, but I promise it’s nice PHP!) didn’t support asynchronous traces. The Google Cloud SDK for PHP has since added async trace support, but we were able to build async tracing by quickly gluing some GCP services together:

  1. We built a trace reporter to log out traces as JSON. 
  2. We then sent the traces to a Pub/Sub topic using Stackdriver log exports. 
  3. Finally, we made a Pub/Sub subscriber in Cloud Functions to report the traces using the REST API. 

The Google Cloud SDK is certainly a more appropriate solution for tracing in production, but the fact that this combination of services worked well speaks to how easy it is to develop in GCP.


Post-migration results 

After running our production environment on GCP for a month, we’ve saved both time and money. Overall costs are ~10% lower without any Committed Use Discounts, with capacity to spare. Stackdriver logging/monitoring, Container Engine, and Kubernetes have made it easier for our engineers to perform DevOps tasks, leveling up our entire team. And being able to search all our logs in one centralized place allows us to easily cross-reference logs from multiple systems, making it possible to track down root causes of issues much faster. This combined with fully-managed, usage-priced services like Datastore and Firebase means development on GCP is easier and more accessible to all of our engineers. We’re really glad we migrated to GCP, and look forward to telling you more about how we did it in future posts. Meanwhile, if you’re a developer who loves competitive play and would like to help us build cool things on top of GCP, we’d love to hear from you. We recently closed our Series A from Spark Capital, Accel, and Horizon Ventures, and we're hiring!

Announcing Dedicated Interconnect: your fast, private on-ramp to Google Cloud


Easy to manage, high bandwidth, private, network connectivity is essential for large enterprises. That’s why today we’re announcing Dedicated Interconnect, a new way to connect to Google Cloud and access the world’s largest cloud network.

Dedicated Interconnect lets you establish a private network connection directly to Google Cloud Platform (GCP) through one of our Dedicated Interconnect locations. Dedicated Interconnect also offers increased throughput and even a potential reduction in network costs.

Companies with data and latency-sensitive services, such as Metamarkets, a real-time analytics firm, benefit from Dedicated Interconnect.

"Accessing GCP with high bandwidth, low latency, and consistent network connectivity is critical for our business objectives. Google's Dedicated Interconnect allows us to successfully achieve higher reliability, higher throughput and lower latency while reducing the total cost of ownership by more than 60%, compared to solutions over the public internet.” 
– Nhan Phan, VP of Engineering at Metamarkets 

Dedicated Interconnect enables you to extend the corporate datacenter network and RFC 1918 IP space into Google Cloud as part of a hybrid cloud deployment. If you work with large or real-time data sets, Dedicated Interconnect can also help you control how that data is routed.

Dedicated Interconnect features 

With Dedicated Interconnect you get a direct connection to GCP VPC networks with connectivity to internal IP addresses in RFC 1918 address space. It’s available in 10 gigabits per second (Gb/s) increments, and you can select from 1 to 8 circuits from the Cloud Console.
Dedicated Interconnect can be configured to offer a 99.9% or a 99.99% uptime SLA. Please see the Dedicated Interconnect documentation for details on how to achieve these SLAs.
Because it combines point and click deployment with ongoing monitoring, Dedicated Interconnect is easy to provision and to manage. Once you have it up and running, you can add an additional VLAN with a point and click configuration — no physical plumbing necessary.

Locations 


Dedicated Interconnect is available today in many locations — with more coming soon. This means you can connect to Google’s network from almost anywhere in the world. For a full list of locations, visit the Dedicated Interconnect locations page. Note that many locations offer service from more than one facility.
Once connected, the Google network provides access to all GCP regions using a private fiber network that connects more than 100 points of presence around the globe. The Google network is the largest cloud network in the world, by several measures, including by the number of points of presence.


Is Dedicated Interconnect right for you? 


Here’s a simple decision tree that can help you determine whether Dedicated Interconnect is right for your organization

Get started with Dedicated Interconnect 

Use Cloud Console to place an order for Dedicated Interconnect.
Dedicated Interconnect will make it easier for more businesses to connect to Google Cloud. We can’t wait to see the next generation of enterprise workloads that Dedicated Interconnect makes possible.

Meet Compute Engine’s new managed instance group updater


A key feature of Google Compute Engine is managed instance groups, which allows you to manage collections of identical instances as a unit, to quickly deploy new VMs and ensure they're consistently configured. Today, we're pleased to announce a new managed instance group updater, to help you update your Compute Engine VMs programmatically and at scale. The updater is in beta and fully integrated into managed instance groups, making it easier than ever to update the software on your instances, patch and update them, and roll out staged and test deployments.

Specifically, the new managed instance group updater allows you to:
  • Programmatically update your instances from one instance template to another 
  • Specify how many instances to update at a time: one, several or all 
  • Deploy additional instances (temporarily) to maintain capacity while old instances are being replaced 
  • Restart, or recreate, all instances in the managed instance group without changing the template 
  • Control the rate of deployment by configuring a pause between instance updates 
At first glance, all these options can be a bit overwhelming. Instead of explaining them one by one, let’s explore three typical use cases:
  • Deploying a simple update 
  • Deploying a canary test update 
  • Recreating all instances 
We’ll show you how to use the managed instance group updater from the UI and gcloud command line, but you can also use it through the API.


Simple update 

Let’s start with the basics and deploy an update to the entire managed instance group, one instance at a time. The instance group my-instance-group starts with every instance running the template myapp-version-a, and we want to deploy myapp-version-b because we're deploying a new version of our software (we could also be doing so to patch/update the underlying OS).
gcloud beta compute instance-groups managed rolling-action 
start-update my-instance-group --version template=myapp-version-b

The managed instance group deploys myapp-version-b by first deleting an instance with myapp-version-a, while simultaneously creating an instance with myapp-version-b, waiting for that new instance to be healthy and then proceeding to the next instance until all of the instances are updated. If you want to roll back the update, just run the same command, but this time specify myapp-version-a as the target template.

gcloud beta compute instance-groups managed rolling-action 
start-update my-instance-group --version template=myapp-version-a
This is the default behavior for the updater, and it works really well for many typical deployments. If your managed instance group is large, however, updating one instance at a time might take too long. Let’s try this again, but this time, let’s update a quarter of the instances at a time.
gcloud beta compute instance-groups managed rolling-action 
start-update my-instance-group --version template=myapp-version-b 
--max-unavailable 25%

Note the new parameter, max-unavailable. It tells the updater how many instances can be taken offline at the same time, to be updated to the new template. Whether you have tens, hundreds or thousands of instances, the update proceeds at the rate you specify. If you’re wondering whether you can update all instances at the same time, the answer is yes. Just set max-unavailable to 100% and the managed instance group updates everything at once. This is a great option when consistent uptime doesn’t matter, for example in a testing environment or for batch computations.

Canary testing 


Now it’s time to consider a more advanced use case. Deploying new software to a subset of instances before committing fully is known as canary testing and is a best practice for managing robust, highly available systems. It allows you to test new software in a real environment while minimizing the impact of any issues.

For our example, let’s deploy myapp-version-b to just one instance.
gcloud beta compute instance-groups managed rolling-action 
start-update my-instance-group --version template=myapp-version-a 
--canary-version template=myapp-version-b,target-size=1

Here, the managed instance group deletes one instance of myapp-version-a and creates one instance of myapp-version-b. The update does not proceed further. If the instance group needs to scale up or down, it retains that one instance of myapp-version-b so that you can test it and make sure that it works as intended. When you’re ready, you can deploy it to a larger group, for example one half of the instances.
gcloud beta compute instance-groups managed rolling-action 
start-update my-instance-group --version template=myapp-version-a 
--canary-version template=myapp-version-b,target-size=50%

The managed instance group replaces instances running myapp-version-a with instances running myapp-version-b until the balance is 50/50. If autoscaling adds or removes instances, the managed instance group maintains this ratio, keeping the canary deployment at the level you set.

When you’re ready to commit to your new deployment, simply tell the updater that you want all of your instances to be running myapp-version-b. This is identical to what we previously did in the simple update.

gcloud beta compute instance-groups managed rolling-action 
start-update my-instance-group --version template=myapp-version-b

Recreating all instances 

Sometimes you don’t want to apply a new template, you just want to replace all of your instances, but keep the current template. This is a common pattern if you're using image families and want to make sure that your instances are using the latest version of an image. Starting a rolling replace of all instances follows the same pattern as starting an update.
gcloud beta compute instance-groups managed rolling-action replace 
my-instance-group --max-unavailable=10%

Notice that the replace action uses the same controls as max-unavailable that our earlier simple update example used to control how many instances to take offline at the same time.

Next steps 


We think these are the most common use cases for the managed instance groups updater, but realistically, we've just scratched the surface of everything that’s possible with it. Thanks to flexible controls like max-unavailable and max-surge, support for canary updates and different actuation commands such as start-update, restart and recreate, you now have a lot of options for maintaining your managed instance groups fleet. For more information, please see the documentation, and feel free to reach out to us with questions and feedback in the GCE discussion group.

You can try out the new managed instance group updater today in the console. If you’re new to Google Cloud Platform (GCP) you can also sign up to automatically get $300 worth of GCP credit to try out Compute Engine and the managed instance group updater.

How Waze tames production chaos using Spinnaker managed pipeline templates and infrastructure as code


“At an abstract level, a deployment pipeline is an automated manifestation of your process for getting software from version control into the hands of your users.” ― Jez Humble, Continuous Delivery: Reliable Software Releases through Build, Test, and Deployment Automation 

At Waze, we’ve been using Spinnaker for simultaneous deployments to multiple clouds since it was open sourced by Netflix in 2015.

However, implementing deployment pipelines can raise issues when your organization has more than 100 microservices (and growing), multiplied by the number of environments/regions/cloud providers.

  • Managing hundreds of clusters and their deployment pipelines can quickly become a major maintenance burden. Once you have a few hundred deployment pipelines or more, keeping them up to date, or making a big change to all of them, is far from trivial. 
  • There’s no code reuse among pipelines, even though many of them are probably identical. For example, bake stages, deploy stages and resize/clone/destroy stages tend to be identical except for some parameters. 
  • Providing a paved road for deployments is easier said than done. Even though each development team should decide on their deployment strategy, it’s important to have a paved road — a way that works for most teams, which saves them time and effort. Start with that, and change as needed. However, there’s no easy way to create such a paved road and maintain it over time across all relevant pipelines in the system. 
Thankfully, Netflix — with contributions from the open-source community, including Google —added pipeline template support to Spinnaker, which solves these pain points and paves the way for multi-cloud infrastructure as code. With some much-appreciated help from the Google Spinnaker team, Waze is now using managed pipeline templates in production, and we plan to use them across our entire production system.

Unlike cloud vendor-specific solutions, Spinnaker managed pipeline templates work on top of all supported providers. (Currently: Azure, GCP, AWS, Kubernetes, OpenStack, App Engine and more are on the way.)

This means that for the first time, we can start realizing the dream of infrastructure as code across multiple clouds, whether you’re deploying to multiple public clouds, to a local Kubernetes on prem or to a mixed environment. We can see a future where automation, or some form of AI, decides to change instance types and other factors to reduce cost, improve utilization or mitigate real-time production incidents.

Runnable pipelines are composed of a pipeline template combined with pipeline configurations (using variables). Multiple configurations can use the same pipeline template as their base. In addition, pipeline templates support inheritance.

The benefits of pipeline templates 


Multi-cloud/provider continuous delivery and infrastructure as code (without vendor lock-in) 

Saving pipeline templates and configs in version control, subjecting them to code review and leaving an audit trail of why each infrastructure change was made are all extremely important for keeping your production system clean. These practices allow each production change to be understood, tracked in case there are any problems, and reproducible.

Being able to reproduce infrastructure enhances existing standards like reproducible builds, provides stability across the system and makes debugging, when required, easier. For example, changing an instance type, or adding a load balancer, is no longer just a “Clone” operation in Spinnaker; it’s now a code commit, a code review and a Jenkins job picking up the pipeline-template config change and publishing it to Spinnaker. After that, you just run the resulting pipeline(s) to apply the infrastructure change. You can easily track the infrastructure’s change history.

All of this is done in a way that supports multiple cloud providers. This may even be relevant for companies using Kubernetes on a single cloud provider, because they're required to interact with two sets of APIs and two control planes to manage their infrastructure. This is also why Kubernetes is treated as a separate cloud provider in Spinnaker. Spinnaker neatly abstracts all of that, while other solutions could lead to vendor lock-in.

Code reuse for pipelines 

In a continuous-delivery environment, many pipelines can contain identical components, except for parameters. Managed pipeline templates provide a perfect way to reduce code duplication and centralize pipeline management, affecting hundreds or thousands of pipelines downstream. This method reduces mistakes, saves time and allows the same template-based configuration to provision multiple identical environments, such as staging, QA and production.


Automated checks and canary analysis on each infrastructure change 


You’re probably familiar with using deployment pipelines to manage application and configuration changes, but now you can use them for infrastructure changes, too — changed instance types, firewall rules, load balancers and so on. Having an official deployment pipeline for each application means you can now run automated testing and canary analysis to even these changes, making infrastructure changes much safer.

Defining a clear paved road for deployments + override capabilities by each application 


We've found that most deployment pipelines follow a very simple pattern:
However, most teams customize these pipelines based on their requirements. Here are just a few examples:

  • Resize previous group to zero instead of destroying. 
  • Lots of parameters for the deploy stage, wait stage. 
  • Two canary analysis stages (first with 1% of traffic, the next with 50% of traffic). 
  • Various parameters passed on to the canary analysis. 
Pipeline templates allow these teams to start off with a paved road, then mix and match stages, specify parameters, and replace or inject stages as needed, while still using the maintained paved road template. If a common stage in the base template is updated, the pipelines inherit the updates automatically. This reduces maintenance considerably for hundreds of pipelines.

Conditional stages use variables to control which stages are enabled. By utilizing conditional stages, you can use a single template for more than one use case. Here’s a video demo showing how it looks in practice.

Injecting stages allows any pipeline child template or configuration to add stages to the pipeline stage graph. For example, if a team uses a basic Bake -> Deploy -> Disable -> Wait -> Destroy pipeline template, they can easily inject a Manual Judgement stage to require a human decision before the previous group is disabled and destroyed. Here’s how this looks in practice.

Automatic deployment pipeline creation for new services 

When a new service comes online — whether in the development, staging or production environments — pipeline templates can be used to create automatic deployment pipelines as a starting point. This reduces the effort of each team as they get a tested and fully working deployment pipeline out of the box (which can later on be customized if needed). Traffic guards and canary analysis give us the confidence to do this completely automatically.


Auto-generate pipelines to perform a rolling OS upgrade across all applications 


Applying OS security updates safely across an entire large scale production system can be quite a challenge. Doing so while keeping the fleet immutable is even harder. Spinnaker pipeline templates combined with canary analysis can provide organizations with a framework to automate this task.

We use a weekly OS upgrade pipeline, which spawns the official deployment pipelines of all production applications, in a rolling manner, from least critical to most critical, spreading the upgrades to small batches which are then cascaded across the entire work week. Each iteration of the pipeline upgrades more applications than it did the day before. We use the official deployment pipelines for each application, sending a runtime parameter which says “Don’t change the binary or configuration — just rebake the base operating system with latest security updates,” and we get a new immutable image unchanged from the previous image except for those security updates. All this while still going through the usual canary analysis safeguards, load balancer health checks and traffic guards.

Pipeline templates can take this pattern one step further. Any new application can be automatically added to this main OS upgrade pipeline, ensuring the entire production fleet is always up to date for OS security updates.

Conclusion 

Spinnaker pipeline templates solve a major issue for organizations running a lot of deployment pipelines. Plus, being able to control infrastructure as code for multiple providers, having it version-controlled and living alongside the application and configuration, removes a major constraint and could be a big step forward in taming operational chaos.

Getting-started references 

To get started with pipeline templates:

  • Set up Spinnaker
  • Read the spec, review the pipeline templates getting started guide
  • Check out the converter from existing pipelines into templates, a good place to start. 
  • roer, the spinnaker thin CLI used to validate and publish templates and configurations to Spinnaker. (Note: Better tooling is on the way.) Remember: roer pipeline-template plan is your friend. Also, orca.log is a great place to debug after publishing a template. 
  • Watch the full demo
  • Try out some example templates
  • Join the Spinnaker slack community and ask questions on the #declarative-pipelines channel.

Building .NET apps in Visual Studio for GCP: better than ever


Google Cloud Platform (GCP) is a great place to run your .NET workloads, and with the latest release of the Cloud Tools for Visual Studio extension, Cloud Tools for Powershell and our ASP.NET Core runtime for App Engine Flexible, it just got even better.

Cloud Tools for Visual Studio 


We integrated the extension viewers for Stackdriver Logging and Stackdriver Error Reporting into Visual Studio to help you diagnose issues and monitor your code. We also enhanced Cloud Explorer with deeper integration into Google Cloud Storage and Google Cloud Pub/Sub so you can manage your resources without leaving Visual Studio.
Stackdriver integration 

Sometimes even the best of code malfunctions in production. To help you diagnose what's going on, we integrated Stackdriver Logging and Stackdriver Error Reporting right into Visual Studio, so you can find the source of the problem while you have your Visual Studio solution open.

Regardless of whether your app is based on ASP.NET 4.x or ASP.NET Core, if you're using Stackdriver Logging to log your .NET app, you can now browse the log entries that your app generated directly in Visual Studio:
You can also query for logs that originate from a particular service and version in Google App Engine (as the above image illustrates) or you can also browse log entries coming from a particular Compute Engine VM.

Even better, if you're using our Google.Cloud.Logging.V2 NuGet package to send the log entries, the extension can match the log entries with the source code lines where they originated. The extension attempts to fetch the exact version of the source code from git, letting you see exactly from where the log entry originated. See the Stackdriver Log viewer documentation for full details on how to use this feature.

What about when your app crashes? Well, that’s where Stackdriver Error Reporting comes into play. If your application uses Stackdriver Error Reporting to send error reports to Stackdriver, you can now browse the error reports directly from within Visual Studio:

You can see the most frequent errors, the full stack trace of the error and even go directly to the source code line where the error originated. See the Stackdriver Error viewer for further details.

Cloud Explorer enhancements 

We understand that you want to stay within Visual Studio when working on your apps, because moving in and out of Visual Studio is a huge context change. To that end, we keep enhancing our very own Cloud Explorer so you can manage the most important resources directly within Visual Studio. In the latest release we added deeper integration with Cloud Storage and added a new node to manage your Cloud Pub/Sub resources.

Let’s look at what you can now do with the Cloud Storage integration. You have always been able to see what buckets existed under the current project right in Cloud Explorer. Now, you can also open the buckets and see what what files are stored inside of them, treating buckets almost like a hard drive:
With the new integration, you can copy files in and out of buckets, rename them and create new directories  in short, manage the contents of your Cloud Storage buckets right inside of Visual Studio. See the documentation for full details on what you can now do with your Cloud Storage buckets.

Next up is the new Google Cloud Pub/Sub resource that we added to Cloud Explorer:
The new Cloud Pub/Sub node allows you to manage your Pub/Sub topics and subscriptions as well as send new messages to existing topics for testing, all within Visual Studio. Read the documentation for full details on what you can do with this new node.

New Powershell cmdlets 


Visual Studio is a really good environment for most development work, but sometimes the right solution is to use Powershell to automate your GCP resources. To this effect we have added new cmdlets to manage even more resources. We added cmdlets to interact with BigQuery that allow you to run queries, create tables and more. We also added cmdlets to manage Google Container Engine clusters and nodes.

Kubernetes, and its GCP-managed variant Google Container Engine, is becoming one of the most popular ways to manage workloads in the cloud. That’s why we added a set of cmdlets to manage your Container Engine clusters from Powershell. For example, to create a new cluster use the following commands:
# Creates a Container Engine Node Config with image type CONTAINER_VM
# and 20 GB disk size for each node.
$nodeConfig = New-GkeNodeConfig -DiskSizeGb 20 `
                                -ImageType CONTAINER_VM

# Creates a cluster named "my-cluster" in the default zone of the
# default project using config $nodeConfig and network "my-network".
Add-GkeCluster -NodeConfig $nodeConfig `
               -ClusterName "my-cluster" `
               -Network "my-network"

For more information on what you can do with the Container Engine cmdlets see the documentation

Then there’s BigQuery, a great data warehousing solution for storing billions of rows and performing queries to extract insights from all that data. Here too we have new cmdlets to manage BigQuery directly from Powershell. For example, here’s how to create a new BigQuery table:
# Creates a schema object to be used in multiple tables.
$schema = New-BqSchema "Page" "STRING" | New-BqSchema "Referrer" "STRING" |
    New-BqSchema "Timestamp" "DATETIME" | Set-BqSchema

# Creates a new table with the Schema object from above.
$table = $dataset | New-BqTable "logs2014" -Schema $schema
For more information about what you can do with the BigQuery cmdlets see the documentation.

We want to hear from you 


We want to work on the features that matter the most to you as we continue to improve .NET and Windows workloads on GCP. Please keep your feedback coming! You can open issues for Cloud Tools for Visual Studio and Cloud Tools for Powershell in their Github repos.

Cloud Identity-Aware Proxy: a simple and more secure way to manage application access


Many businesses are eager to move their internal applications to the cloud, but need to ensure their sensitive data is protected when doing so. While enterprise IT teams are skilled at building innovative apps, they may not be experts on identity and security models for cloud-hosted applications.

That’s why we developed Cloud Identity-Aware Proxy, which is now generally available. Cloud IAP provides granular access controls and is easy to use so that companies can quickly and more securely host their internal apps in the cloud.

Here’s an example of how it works. Say you’re a large consumer goods company with a global data science team that needs access to specific internal data. Your IT team might need to manage an ever-changing list of employees who need access. After moving these applications to Google Cloud Platform (GCP), admins can enable Cloud IAP, add groups to the access control lists, thereby making sure applications are only safely accessible to the users that need them from anywhere on the Internet. This means your enterprise IT team can spend its time doing what they do best — like building a world-class supply chain system — instead of focusing on complex security issues.

Here’s a little more on what Cloud IAP offers:

A zero trust security model for the cloud 

Following the BeyondCorp security model that focuses on building zero trust networks, Cloud IAP shifts access controls from the network perimeter to individual users This means you can evaluate all of an application's access requests by taking into account who the user is and what they want to access, eliminating the need for setting up virtual private clouds and copying access control policies for each new application.


Better, more granular access controls 


Using Cloud IAP for access control and auditing allows enterprises to ensure access is restricted to the right people. This makes it safer than ever to move your data to the cloud.

No more need for VPNs

With Cloud IAP, you can grant access to employees or vendors without worrying about unreliable VPNs that require client-side installs. Admins can now determine who should be able to access each application based on the app’s unique security considerations. Additionally, applications deployed behind Cloud IAP require no code changes — you can simply deploy your existing application, turn on Cloud IAP, and your application is protected.

Interested in giving it a try? Check out the step-by-step instructions on how to get started here. We hope Cloud IAP makes it possible for more organizations to spend less time worrying about security and more time on the things that matter — like developing applications that grow their business.

Announcing new Stackdriver Logging features and expanded free logs limits


When we announced the general availability of Google Stackdriver, our integrated monitoring, logging and diagnostics suite for applications running on cloud, we heard lots of enthusiasm from our user community as well as some insightful feedback:
  • Analysis - Logs based metrics are great, but you’d like to be able to extract labels and values from logs, too. 
  • Exports - Love being able to easily export logs, but it’s hard to manage them across dozens or hundreds of projects. 
  • Controls - Aggregating all logs in a single location and exporting them various places is fantastic, but you want control over which logs go into Stackdriver Logging. 
  • Pricing - You want room to grow with Stackdriver without worrying too much about the cost of logging all that data. 
We heard you, which is why today we’re announcing a variety of new updates to Stackdriver, as well as updated pricing to give you the flexibility to scale and grow.

Here’s a little more on what’s new.

Easier analysis with logs-based metrics 

Stackdriver was created with the belief that bringing together multiple signals from logs, metrics, traces and errors can provide greater insight than any single signal. Logs-based metrics are a great example. That’s why the new and improved logs-based metrics are:
  • Faster - We’ve decreased the time from when a log entry arrives until it’s reflected in a logs-based metric from five minutes to under a minute. 
  • Easier to manage - Now you can extract user-defined labels from text in the logs. Instead of creating a new logs based metric for each possible value, you can use a field in the log entry as a label. 
  • More powerful - Extract values from logs and turn them into distribution metrics. This allows you to efficiently represent many data points at each point in time. Stackdriver Monitoring can then visualize these metrics as a heat map or by percentile. 
The example above shows a heat map produced from a distribution metric extracted from a text field in log entries.

Tony Li, Site Reliability Engineer at the New York Times, explains how they use the new user defined labels applied to proxies help them improve reliability and performance from logs.
“With LBMs [Logs based metrics], we can monitor errors that occur across multiple proxies and visualize the frequency based on when they occur to determine regressions or misconfigurations."
The faster pipeline applies to all logs-based metrics, including the already generally available count-based metrics. Distribution metrics and user labels are now available in beta.


Manage logs across your organization with aggregated exports 


Stackdriver Logging gives you the ability to export logs to GCS, PubSub or BigQuery using log sinks. We heard your feedback that managing exports across hundreds or thousands of projects in an organization can sometimes be tedious and error prone. For example, if a security administrator in an organization wanted to export all audit logs to a central project in BigQuery, she would have to set up a log sink at every project and validate that the sink was in place for each new project.

With aggregated exports, administrators of an organization or folder can set up sinks once to be inherited by all the child projects and subfolders. This makes it possible for the security administrator to export all audit logs in her organization to BigQuery with a single command:

gcloud beta logging sinks create my-bq-sink 
bigquery.googleapis.com/projects/my-project/datasets/my_dataset 
--log-filter='logName= "logs/cloudaudit.googleapis.com%2Factivity"' 
--organization=1234 --include-children

Aggregated exports help ensure that logs in future projects will be exported correctly. Since the sink is set at the organization or folder level, it also prevents an individual project owner from turning off a sink.

Control your Stackdriver Logging pipeline with exclusion filters 

All logs sent to the Logging API, whether sent by you or by Google Cloud services, have always gone into Stackdriver Logging where they're searchable in the Logs Viewer. But we heard feedback that users wanted more control over which logs get ingested into Stackdriver Logging, and we listened. To address this, exclusion filters are now in beta. Exclusion filters allow you to reduce costs, improve the signal to noise ratio by reducing chatty logs and manage compliance by blocking logs from a source or matching a pattern from being available in Stackdriver Logging. The new Resource Usage page provides visibility into which resources are sending logs and which are excluded from Stackdriver Logging.


This makes it easy to exclude some or all future logs from a specific resource. In the example above, we’re excluding 99% of successful load balancer logs. We know the choice and freedom to choose any solution is important, which is why all GCP logs are available to you irrespective of the logging exclusion filters, to export to BigQuery, Google Cloud Storage or any third party tool via PubSub. Furthermore, Stackdriver will not charge for this export, although BigQuery, GCS and PubSub charges will apply.

Starting Dec 1, Stackdriver Logging offers 50GB of logs per project per month for free 


You told us you wanted room to grow with Stackdriver without worrying about the cost of logging all that data, which is why on December 1 we’re increasing the free logs allocation to an industry-leading 50GB per project per month. This increase aims to bring the power of Stackdriver Logging search, storage, analysis and alerting capabilities to all our customers.

Want to keep logs beyond the free 50GB/month allocation? You can sign up for the Stackdriver Premium Tier or the logs overage in the Basic Tier. After Dec 1, any additional logs will be charged at a flat rate of $0.50/GB.


Audit logs, still free and now available for 13 months 

We’re also exempting admin activity audit logs from the limits and overage. They’ll be available in Stackdriver in full without any charges. You’ll now be able to keep them for 13 months instead of 30 days.

Continuing the conversation 


We hope this brings the power of Stackdriver Logging search, storage, analysis and alerting capabilities to all our customers. We have many more exciting new features planned, including a time range selector coming in September to make it easier to get visibility into the timespan of search results. We’re always looking for more feedback and suggestions on how to improve Stackdriver Logging. Please keep sending us your requests and feedback.

Interested in more information on these new features?

Intelligent email categorization with machine learning

You’ve probably heard the words "machine learning" thrown around a lot lately. But what exactly is it and how can it be used to improve your own services or workflows? To demystify this concept, we’ve created a series of articles that look at common problems and the different ways machine learning can be used to solve them. Our first article examines how machine learning can be used to improve customer service.

Let's say you run a company that gets a wide variety of emails to your customer service account. There are numerous ways you can go about using these emails to make inferences about how your customers are feeling about your business. Many companies have a customer service representative manually read and categorize each and every email. But as the volume of emails you receive increases, this approach can be difficult and time consuming. The following is a look at the various ways companies are tackling this problem, and how machine learning presents a solution.

Although we presented a simplified view of how this problem can be solved with and without machine learning, the power it can provide should be evident. But semi-supervised machine learning is just one of many concepts under the machine learning umbrella. In our next post, we’ll explore other models that help solve different problems.

In the meantime, if you’re interested in learning more, you can build you own intelligent email routing model with code we’ve made available in Github. You can download it here.