Tag Archives: Containers & Kubernetes

New Cloud Filestore service brings GCP users high-performance file storage


As we celebrate the upcoming Los Angeles region for Google Cloud Platform (GCP) in one of the creative centers of the world, we’re really excited about helping you bring your creative visions to life. At Google, we want to empower artist collaboration and creation with high-performance cloud technology. We know folks need to create, read and write large files with low latency. We also know that film studios and production shops are always looking to render movies and create CGI images faster and more efficiently. So alongside our LA region launch, we’re pleased to enable these creative projects by bringing file storage capabilities to GCP for the first time with Cloud Filestore.

Cloud Filestorebeta is managed file storage for applications that require a file system interface and a shared file system. It gives users a simple, integrated, native experience for standing up fully managed network-attached storage (NAS) with their Google Compute Engine and Kubernetes Engine instances.

We’re pleased to add Cloud Filestore to the GCP storage portfolio because it enables native platform support for a broad range of enterprise applications that depend on a shared file system.


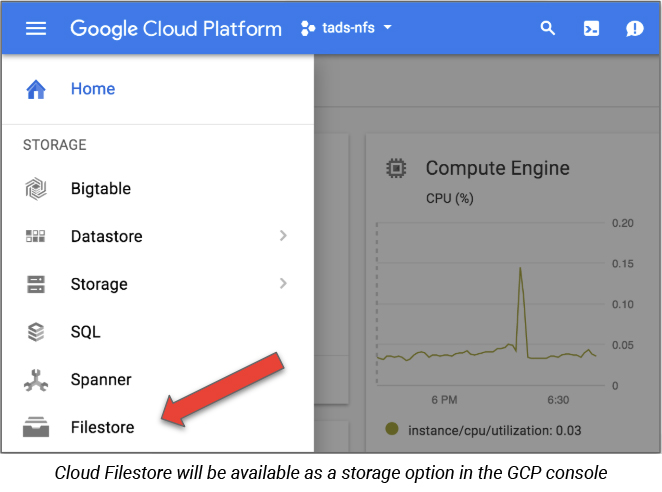
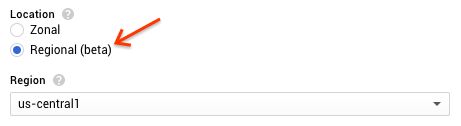
Cloud Filestore will be available as a storage option in the GCP console
We're especially excited about the high performance that Cloud Filestore offers to applications that require high throughput, low latency and high IOPS. Applications such as content management systems, website hosting, render farms and virtual workstations for artists typically require low-latency file operations, high-performance random I/O, and high throughput and performance for metadata-intensive operations. We’ve heard from some of our early users that they’ve saved time serving up websites with Cloud Filestore, cut down on hardware needs and sped up the compute-intensive process of rendering a movie.

Putting Cloud Filestore into practice

For organizations with lots of rich unstructured content, Cloud Filestore is a good place to keep it. For example, graphic design, video and image editing, and other media workflows use files as an input and files as the output. Filestore also helps creators access shared storage to manipulate and produce these types of large files. If you’re a web developer creating websites and blogs that serve file content to your audience, you’ll find it easy to integrate Cloud Filestore with web software like Wordpress. That’s what Jellyfish did.

Jellyfish is a boutique marketing agency focused on delivering high-performance marketing services to their global clients. A major part of that service is delivering a modern and flexible digital web presence.

“Wordpress hosts 30% of the world’s websites, so delivering a highly available and high performance Wordpress solution for our clients is critical to our business. Cloud Filestore enabled us to simply and natively integrate Wordpress on Kubernetes Engine , and take advantage of the flexibility that will provide our team.”
- Ashley Maloney, Lead DevOps Engineer at Jellyfish Online Marketing
Cloud Filestore also provides the reliability and consistency that latency-sensitive workloads need. One example is fuzzing, the process of running millions of permutations to identify security vulnerabilities in code. At Google, ClusterFuzz is the distributed fuzzing infrastructure behind Chrome and OSS-Fuzz that’s built for fuzzing at scale. The ClusterFuzz team needed a shared storage platform to store the millions of files that are used as input for fuzzing mutations.
“We focus on simplicity that helps us scale. Having grown from a hundred VMs to tens of thousands of VMs, we appreciate technology that is efficient, reliable, requires little to no configuration and scales seamlessly without management. It took one premium Filestore instance to support a workload that previously required 16 powerful servers. That frees us to focus on making Chrome and OSS safer and more reliable.”
- Abhishek Arya, Information Security Engineer, Google Chrome
Write once and read many is another type of workload where consistency and reliability are critical. At ever.ai, they’re training an advanced facial recognition platform on 12 billion photos and videos for tens of millions of users in 95 countries. The team constantly needs to share large amounts of data between many servers that will be written once but read a bunch. They faced a challenge in writing this data to a non-POSIX object storage, reading from which required custom code or to download the data. So they turned to Cloud Filestore.
“Cloud Filestore was easy to provision and mount, and reliable for the kind of workload we have. Having a POSIX file system that we can mount and use directly helps us speed-read our files, especially on new machines. We can also use the normal I/O features of any language and don’t have to use a specific SDK to use an object store."
- Charlie Rice, Chief Technology Officer, ever.ai
Cloud Filestore is also particularly helpful with rendering requirements. Rendering is the process by which media production companies create computer-generated images by running specialized imaging software to create one or more frames of a movie. We’ve just announced our newest GCP region in Los Angeles, where we expect there are more than a few of you visual effects artists and designers who can use Cloud Filestore. Let’s take a closer look at an example rendering workflow so you can see how Cloud Filestore can read and write data for this specialized purpose without tying up on-site hardware.

Using Cloud Filestore for rendering

When you render a movie, the rendering job typically runs across fleets ("render farms") of compute machines, all of which mount a shared file system. Chances are you’re doing this with on-premises machines and on-premises files, but with Cloud Filestore you now have a cloud option.

To get started, create a Cloud Filestore instance, and seed it with the 3D models and raw footage for the render. Set up your Compute Engine instance templates to mount the Cloud Filestore instance. Once that's set, spin up your render farm with however many nodes you need, and kick off your rendering job. The render nodes all concurrently read the same source data set from the Network File System (NFS) share, perform the rendering computations and write the output artifacts back to the share. Finally, your reassembly process reads the artifacts from Cloud Filestore and assembles it and writes into the final form.

Cloud Filestore Price and Performance

We offer two price-for-performance tiers. The high-performance Premium tier is $0.30 per GB per month, and the midrange performance Standard tier is $0.20 per GB per month in us-east1, us-central1, and us-west1 (Other regions vary). To keep your bill simple and predictable, we charge for provisioned capacity. You can resize on demand without downtime to a max of 64TB*. We do not charge per-operation fees. Networking is free in the same zone, and cross zone standard egress networking charges apply.

Cloud Filestore Premium instance throughput is designed to provide up to 700 MB/s and 30,000 IOPS for reads, regardless of the Cloud Filestore instance capacity. Standard instances are lower priced and performance scales with capacity, hitting peak performance at 10TB and above. A simple performance model makes it easier to predict costs and optimize configurations. High performance means your applications run faster. As you can see in the image below, the Cloud Filestore Premium tier outperforms the design goal with the specified benchmarks, based on performance testing we completed in-house.

Trying Cloud Filestore for yourself

Cloud Filestore will release into beta next month. To sign up to be notified about the beta release, complete this request form. Visit our Filestore page to learn more.

In addition to our new Cloud Filestore offering, we partner with many file storage providers to meet all of your file needs. We recently announced NetApp Cloud Volumes for GCP and you can find other partner solutions in our launcher.

If you’re interested in learning more about file storage from Google, check out this session at Next 2018 next month. For more information, and to register, visit the Next ‘18 website.

GPUs as a service with Kubernetes Engine are now generally available


[Editor's note: This is one of many posts on enterprise features enabled by Kubernetes Engine 1.10. For the full coverage, follow along here.]

Today, we’re excited to announce the general availability of GPUs in Google Kubernetes Engine, which have become one of the platform’s fastest growing features since they entered beta earlier this year, with core-hours soaring by 10X since the end of 2017.

Together with the GA of Kubernetes Engine 1.10, GPUs make Kubernetes Engine a great fit for enterprise machine learning (ML) workloads. By using GPUs in Kubernetes Engine for your CUDA workloads, you benefit from the massive processing power of GPUs whenever you need, without having to manage hardware or even VMs. We recently introduced the latest and the fastest NVIDIA Tesla V100 to the portfolio, and the P100 is generally available. Last but not least, we also offer the entry-level K80, which is largely responsible for the popularity of GPUs. All our GPU models are available as Preemptible GPUs, as a way to reduce costs while benefiting from GPUs in Google Cloud. Check out the latest prices for GPUs here.

As the growth in GPU core-hours indicates, our users are excited about GPUs in Kubernetes Engine. Ocado, the world’s largest online-only grocery retailer, is always looking to apply state-of-the-art machine learning models for Ocado.com customers and Ocado Smart Platform retail partners, and runs the models on preemptible, GPU-accelerated instances on Kubernetes Engine.
“GPU-attached nodes combined with Kubernetes provide a powerful, cost-effective and flexible environment for enterprise-grade machine learning. Ocado chose Kubernetes for its scalability, portability, strong ecosystem and huge community support. It’s lighter, more flexible and easier to maintain compared to a cluster of traditional VMs. It also has great ease-of-use and the ability to attach hardware accelerators such as GPUs and TPUs, providing a huge boost over traditional CPUs.”
— Martin Nikolov, Research Software Engineer, Ocado
GPUs in Kubernetes Engine also have a number of unique features:
  • Node Pools allow your existing cluster to use GPUs whenever you need.
  • Cluster Autoscaler automatically creates nodes with GPUs whenever pods requesting GPUs are scheduled, and scale down to zero when GPUs are no longer consumed by any active pods.
  • Taint and toleration technology ensures that only pods that request GPUs will be scheduled on the nodes with GPUs, and prevents pods that do not require GPUs from running on them.
  • Resource quota that allows administrators to limit resource consumption per namespace in a large cluster shared by multiple users or teams.
We also heard from you that you need an easy way to understand how your GPU jobs are performing: how busy the GPUs are, how much memory is available, and how much memory is allocated. We are thrilled to announce that you can now monitor those information natively from the GCP Console.You can also visualize these metrics in Stackdriver.
Fig 1. GPU memory usage and duty cycle 

The general availability of GPUs in Kubernetes Engine represents a lot of hard work behind the scenes, polishing the internals for enterprise workloads. Jiaying Zhang, the technical lead for this general availability, led the Device Plugins effort in Kubernetes 1.10, working closely with the OSS community to understand its needs, identify common requirements, and come up with an execution plan to build a production-ready system.

Try them today

To get started using GPUs in Kubernetes Engine using our free-trial of $300 credits, you’ll need to upgrade your account and apply for a GPU quota for the credits to take effect. For a more detailed explanation of Kubernetes Engine with GPUs, for example how to install NVIDIA drivers and how to configure a pod to consume GPUs, check out the documentation.

In addition to GPUs in Kubernetes Engine, Cloud TPUs are also now publicly available in Google Cloud. For example, RiseML uses Cloud TPUs in Kubernetes Engine for a hassle-free machine learning infrastructure that is easy-to-use, highly scalable, and cost-efficient. If you want to be among the first to access Cloud TPUs in Kubernetes Engine, join our early access program today.

Thanks for your feedback on how to shape our roadmap to better serve your needs. Keep the conversation going by connecting with us on the Kubernetes Engine Slack channel.

Time to “Hello, World”: VMs vs. containers vs. PaaS vs. FaaS


Do you want to build applications on Google Cloud Platform (GCP) but have no idea where to start? That was me, just a few months ago, before I joined the Google Cloud compute team. To prepare for my interview, I watched a bunch of GCP Next 2017 talks, to get up to speed with application development on GCP.

And since there is no better way to learn than by doing, I also decided to build a “Hello, World” web application on each of GCP’s compute offerings—Google Compute Engine (VMs), Google Kubernetes Engine (containers), Google App Engine (PaaS), and Google Cloud Functions (FaaS). To make this exercise more fun (and to do it in a single weekend), I timed things and took notes, the results of which I recently wrote up in a lengthy Medium post—check it out if you’re interested in following along and taking the same journey. 

So, where do I run my code?


At a high level, though, the question of which compute option to use is... it depends. Generally speaking, it boils down to thinking about the following three criteria:
  1. Level of abstraction (what you want to think about)
  2. Technical requirements and constraints
  3. Where your team and organization are going
Google Developer Advocate Brian Dorsey gave a great talk at Next last year on Deciding between Compute Engine, Container Engine, App Engine; here’s a condensed version:


As a general rule, developers prefer to take advantage of the higher levels of compute abstraction ladder, as it allows us to focus on the application and the problem we are solving, while avoiding undifferentiated work such as server maintenance and capacity planning. With Cloud Functions, all you need to think about is code that runs in response to events (developer's paradise!). But depending on the details of the problem you are trying to solve, technical constraints can pull you down the stack. For example, if you need a very specific kernel, you might be down at the base layer (Compute Engine). (For a good resource on navigating these decision points, check out: Choosing the right compute option in GCP: a decision tree.)

What programming language should I use?

GCP broadly supports the following programming languages: Go, Java, .NET, Node.js, PHP, Python, and Ruby (details and specific runtimes may vary by the service). The best language is a function of many factors, including the task at hand as well as personal preference. Since I was coming at this with no real-world backend development experience, I chose Node.js.

Quick aside for those of you who might be not familiar with Node.js: it’s an asynchronous JavaScript runtime designed for building scalable web application back-ends. Let’s unpack this last sentence:

  • Asynchronous means first-class support for asynchronous operations (compared to many other server-side languages where you might have to think about async operations and threading—a totally different mindset). It’s an ideal fit for most cloud applications, where a lot of operations are asynchronous. 
  • Node.js also is the easiest way for a lot of people who are coming from the frontend world (where JavaScript is the de-facto language) to start writing backend code. 
  • And there is also npm, the world’s largest collection of free, reusable code. That means you can import a lot of useful functionality without having to write it yourself.


Node.js is pretty cool, huh? I, for one, am convinced!

On your mark… Ready, set, go!

For my interview prep, I started with Compute Engine and VMs first, and then moved up the levels of compute service-abstraction ladder, to Kubernetes Engine and containers, App Engine and apps, and finally Cloud Functions. The following table provides a quick summary along with links to my detailed journey and useful getting started resources.


Getting from point A to point B
Time check and getting started resources
Compute Engine

Basic steps:
  1. Create & set up a VM instance
  2. Set up Node.js dev environment
  3. Code “Hello, World”
  4. Start Node server
  5. Expose the app to external traffic
  6. Understand how scaling works

4.5 hours

Kubernetes Engine

Basic steps:
  1. Code “Hello, World”
  2. Package the app into a container
  3. Push the image to Container Registry
  4. Create a Kubernetes cluster
  5. Expose the app to external traffic
  6. Understand how scaling works

6 hours

App Engine

Basic steps:
  1. Code “Hello, World”
  2. Configure an app.yaml project file
  3. Deploy the application
  4. Understand scaling options

1.5-2 hours

Cloud Functions

Basic steps:
  1. Code “Hello, World”
  2. Deploy the application

15 minutes


Time-to-results comparison

Although this might be somewhat like comparing apples and oranges, here is a summary of my results. (As a reminder, this is just in the context of standing up a “Hello, World” web application from scratch, all concerns such as running the app in production aside.)

Your speed-to-results could be very different depending on multiple factors, including your level of expertise with a given technology. My goal was to grasp the fundamentals of every option in the GCP’s compute stack and assess the amount of work required to get from point A to point B… That said, if there is ever a cross-technology Top Gear fighter jet vs. car style contest on standing up a scalable HTTP microservice from scratch, I wouldn’t be afraid to take on a Kubernetes grandmaster like Kelsey Hightower with Cloud Functions!

To find out more about application development on GCP, check out Computing on Google Cloud Platform. Don’t forget—you get $300 in free credits when you sign up.

Happy building!

Further reading on Medium:

How to deploy geographically distributed services on Kubernetes Engine with kubemci


Increasingly, many enterprise Google Cloud Platform (GCP) customers use multiple Google Kubernetes Engine clusters to host their applications, for better resilience, scalability, isolation and compliance. In addition, their users expect to low-latency access to applications from anywhere around the world. Today we are introducing a new command-line interface (CLI) tool called kubemci to automatically configure ingress using Google Cloud Load Balancer (GCLB) for multi-cluster Kubernetes Engine environments. This allows you to use a Kubernetes Ingress definition to leverage GCLB along with multiple Kubernetes Engine clusters running in regions around the world, to serve traffic from the closest cluster using a single anycast IP address, taking advantage of GCP’s 100+ Points of Presence and global network. For more information on how the GCLB handles cross-region traffic see this link.

Further, kubemci will be the initial interface to an upcoming controller-based multi-cluster ingress (MCI) solution that can adapt to different use-cases and can be manipulated using the standard kubectl CLI tool or via Kubernetes API calls.

For example, in the picture below, we have created three independent Kubernetes Engine clusters and spread them across three continents (Asia, North America, and Europe). We then deployed the same service, “zone-printer”, to each of these clusters and used kubemci to create a single GCLB instance to stitch the services together. In this case, the 1000 requests-per-second (rps) from Tokyo are routed to the cluster in Asia, the New York requests are routed to the North American cluster, and the remaining 1 rps from London is routed to the European cluster. Because each of these requests arrive at the closest cluster to the end user they benefit from low round-trip latency. Additionally, if a region, cluster, or service were ever to become unavailable, GCLB automatically detects that and routes users to one of the other healthy service instances.

The feedback on kubemci has been great so far. Marfeel is a Spanish ad tech platform and has been using kubemci in production to improve their service offering:
“At Marfeel, we appreciate the value that this tool provides for us and our customers. Kubemci is simple to use and easily integrates with our current processes, helping to speed up our Multi-Cluster deployment process. In summary, kubemci offers us granularity, simplicity, and speed.”
-Borja García - SRE Marfeel

Getting started

To get started with kubemci, please check out the how-to guide, which contains information on the prerequisites along with step-by-step instructions on how to download the tool and set up your clusters, services and ingress objects.

As a quick preview, once your applications and services are running, you can set up a multi-cluster ingress by running the following command:
$ kubemci create my-mci --ingress=ingress.yaml \
    --kubeconfig=cluster_list.yaml
To learn more, check out this talk on Multicluster Ingress by Google software engineers Greg Harmon and Nikhil Jindal, at KubeCon Europe in Copenhagen, demonstrating some initial work in this space.

Regional clusters in Google Kubernetes Engine are now generally available


Editor's note: This is one of many posts on enterprise features you’ll find in Kubernetes Engine 1.10. For the full coverage, follow along here.

A highly available Kubernetes cluster is a key requirement for most production applications. However, adding this protection can be complex. We’ve consistently heard from Kubernetes users that creating and managing a high-availability Kubernetes cluster is no small feat. Keeping etcd (the key-value store) replicas in sync across zones, scaling your masters, and ensuring that your control plane is fronted by a resilient load balancer are just some of the challenges users face when maintaining their own highly available cluster.

Today we’re proud to announce the general availability of one of Google Kubernetes Engine's most requested enterprise-grade features: regional clusters. Regional clusters create a multi-master, highly-available Kubernetes cluster that spreads both the control plane and the nodes across multiple zones in the same region, allowing us to increase the control plane uptime to 99.95%. In addition to the increased availability, regional clusters give you a zero-downtime upgrade experience, so that your cluster is always available for deployments.

We’ve seen rapid adoption of regional clusters since we announced the beta, and with many users already running production workloads using regional clusters. In addition, we are pleased to announce today that regional clusters in Kubernetes Engine are available at no additional cost.

Get started with regional clusters

You can quickly create your first regional cluster using the Cloud Console or the gcloud command line tool.
$ gcloud container clusters create my-regional-cluster
--region=us-east1 --num-nodes=2
This creates a regional cluster in us-east1 with two nodes in each of the us-east1 zones.

By creating a regional cluster, you get:
  • Resilience from single zone failure - Because your masters and application nodes are available across a region rather than a single zone, your Kubernetes cluster is still fully functional if an entire zone goes down.
  • No downtime during master upgrades - Kubernetes Engine minimizes downtime during all Kubernetes master upgrades, but with a single master, some downtime is inevitable. By using regional clusters, the control plane remains online and available, even during upgrades.
Regional clusters is just one of the many features that makes Kubernetes Engine a great choice for enterprises seeking to run a production-grade, managed Kubernetes cluster in the cloud. For a more detailed explanation of the regional clusters feature along with additional flags you can use, check out the documentation.

Last month today: GCP in May


When it comes to Google Cloud Platform (GCP), every month is chock full of news and information. We’re kicking off a monthly recap of key moments you may have missed.

What caught your attention this month:

Announcements about open source projects were some of the most-read this month.
  • Open-sourcing gVisor, a sandboxed container runtime was by far your favorite post in May. gVisor is a sandbox that lets you run containers in strongly isolated environments. It’s isolated like a virtual machine, but more lightweight and also more flexible, since it interfaces with the host OS just like another process.
  • Our introduction of Asylo, an open-source framework for confidential computing, also got your attention. As more and more sensitive workloads move to cloud, lots of businesses want to be able to verify that they’re properly isolated, inside a closed environment that’s only available to authorized users. Asylo democratizes trusted execution environments (TEEs) by allowing them to run on generic hardware. With Asylo, developers will be able to run their workloads encrypted in a highly secure environment, whether it’s on-premises or in the cloud.
  • Rounding out the open-source fun for the month was our introduction of the beta availability of Cloud Memorystore, a fully managed in-memory data store service for Redis. Cloud Memorystore gives you the caching power of Redis to reduce latency, without having to manage the details.


Hot topics: Kubernetes, DevOps and SRE

Google Kubernetes Engine 1.10 debuted in May, and we had a lot to say about the new features that this version enables—from security to brand-new monitoring functionality via Stackdriver Kubernetes Monitoring to networking. Start with this post to see what’s new and how customers like Spotify are using Kubernetes Engine on Google Cloud.

And one of our recent posts also struck a chord, as two of our site reliability engineering (SRE) experts delved into the differences—and similarities—between SRE and DevOps. They have similar goals, mostly around creating flexible, agile dev environments, but SRE generally gets much more specific and prescriptive than DevOps in accomplishing them.

Under the radar: GCP adds infrastructure options

As you look for new ways to use GCP to run your business, our engineers are adding features and new releases to give you more power, resources and coverage.

First, we introduced ultramem Google Compute Engine machine types, which offer more memory and compute resources than any other Compute Engine VM instance. These machines types are especially useful for those of you running enterprise workloads that need a lot of memory, like data analytics or high-performance applications.

We’ve also been busy on the back-end in other ways too, as we continue adding new regional cloud computing infrastructure. Our third zone of the Singapore region opened in May, and we’ll open a Zurich region next year.

Stay tuned in June for more on the technologies behind Google Cloud—we’ve got lots up our sleeve.

Kubernetes best practices: upgrading your clusters with zero downtime


Editor’s note: Today is the final installment in a seven-part video and blog series from Google Developer Advocate Sandeep Dinesh on how to get the most out of your Kubernetes environment.

Everyone knows it’s a good practice to keep your application up to date to optimize security and performance. Kubernetes and Docker can make performing these updates much easier, as you can build a new container with the updates and deploy it with relative ease.

Just like your applications, Kubernetes is constantly getting new features and security updates, so the underlying nodes and Kubernetes infrastructure need to be kept up to date as well.

In this episode of Kubernetes Best Practices, let’s take a look at how Google Kubernetes Engine can make upgrading your Kubernetes cluster painless!

The two parts of a cluster

When it comes to upgrading your cluster, there are two parts that both need to be updated: the masters and the nodes. The masters need to be updated first, and then the nodes can follow. Let’s see how to upgrade both using Kubernetes Engine.

Upgrading the master with zero downtime
Kubernetes Engine automatically upgrades the master as point releases are released, however it usually won’t upgrade to a new version (for example, 1.7 to 1.8) automatically. When you are ready to upgrade to a new version, you can just click the upgrade master button in the Kubernetes Engine console.

However, you may have noticed that the dialog box says the following:

“Changing the master version can result in several minutes of control plane downtime. During that period you will be unable to edit this cluster.”

When the master goes down for the upgrade, deployments, services, etc. continue to work as expected. However, anything that requires the Kubernetes API stops working. This means kubectl stops working, applications that use the Kubernetes API to get information about the cluster stop working, and basically you can’t make any changes to the cluster while it is being upgraded.

So how do you update the master without incurring downtime?


Highly available masters with Kubernetes Engine regional clusters

While the standard “zonal” Kubernetes Engine clusters only have one master node backing them, you can create “regional” clusters that provide multi-zone, highly available masters.

When creating your cluster, be sure to select the “regional” option:

And that’s it! Kubernetes Engine automatically creates your nodes and masters in three zones, with the masters behind a load-balanced IP address, so the Kubernetes API will continue to work during an upgrade.

Upgrading nodes with zero downtime

When upgrading nodes, there are a few different strategies you can use. There are two I want to focus on:
  1. Rolling update
  2. Migration with node pools
Rolling update
The simplest way to update your Kubernetes nodes is to use a rolling update. The is the default upgrade mechanism Kubernetes Engine uses to update your nodes.

A rolling update works in the following way. One by one, a node is drained and cordoned so that there are no more pods running on that node. Then the node is deleted, and a new node is created with the updated Kubernetes version. Once that node is up and running, the next node is updated. This goes on until all nodes are updated.

You can let Kubernetes Engine manage this process for you completely by enabling automatic node upgrades on the node pool.

If you don’t select this, the Kubernetes Engine dashboard alerts you when an upgrade is available:

Just click the link and follow the prompt to begin the rolling update.

Warning: Make sure your pods are managed by a ReplicaSet, Deployment, StatefulSet, or something similar. Standalone pods won’t be rescheduled!

While it’s simple to perform a rolling update on Kubernetes Engine, it has a few drawbacks.

One drawback is that you get one less node of capacity in your cluster. This issue is easily solved by scaling up your node pool to add extra capacity, and then scaling it back down once the upgrade is finished.

The fully automated nature of the rolling update makes it easy to do, but you have less control over the process. It also takes time to roll back to the old version if there is a problem, as you have to stop the rolling update and then undo it.

Migration with node pools
Instead of upgrading the “active” node pool as you would with a rolling update, you can create a fresh node pool, wait for all the nodes to be running, and then migrate workloads over one node at a time.

Let’s assume that our Kubernetes cluster has three VMs right now. You can see the nodes with the following command:
kubectl get nodes
NAME                                        STATUS  AGE
gke-cluster-1-default-pool-7d6b79ce-0s6z    Ready   3h
gke-cluster-1-default-pool-7d6b79ce-9kkm    Ready   3h
gke-cluster-1-default-pool-7d6b79ce-j6ch    Ready   3h


Creating the new node pool
To create the new node pool with the name “pool-two”, run the following command:
gcloud container node-pools create pool-two

Note: Remember to customize this command so that the new node pool is the same as the old pool. You can also use the GUI to create a new node pool if you want.

Now if you check the nodes, you will notice there are three more nodes with the new pool name:
$ kubectl get nodes
NAME                                        STATUS  AGE
gke-cluster-1-pool-two-9ca78aa9–5gmk        Ready   1m
gke-cluster-1-pool-two-9ca78aa9–5w6w        Ready   1m
gke-cluster-1-pool-two-9ca78aa9-v88c        Ready   1m
gke-cluster-1-default-pool-7d6b79ce-0s6z    Ready   3h
gke-cluster-1-default-pool-7d6b79ce-9kkm    Ready   3h
gke-cluster-1-default-pool-7d6b79ce-j6ch    Ready   3h

However, the pods are still on the old nodes! Let’s move them over.

Drain the old pool
Now we need to move work to the new node pool. Let’s move over one node at a time in a rolling fashion.

First, cordon each of the old nodes. This will prevent new pods from being scheduled onto them.

kubectl cordon <node_name>
Once all the old nodes are cordoned, pods can only be scheduled on the new nodes. This means you can start to remove pods from the old nodes, and Kubernetes automatically schedules them on the new nodes.

Warning: Make sure your pods are managed by a ReplicaSet, Deployment, StatefulSet, or something similar. Standalone pods won’t be rescheduled!

Run the following command to drain each node. This deletes all the pods on that node.

kubectl drain <node_name> --force


After you drain a node, make sure the new pods are up and running before moving on to the next one.

If you have any issues during the migration, uncordon the old pool and then cordon and drain the new pool. The pods get rescheduled back to the old pool.

Delete the old pool
Once all the pods are safely rescheduled, it is time to delete the old pool.

Replace “default-pool” with the pool you want to delete.

gcloud container node-pools delete default-pool


You have just successfully updated all your nodes!

Conclusion


By using Kubernetes Engine, you can keep your Kubernetes cluster up to date with just a few clicks.

If you are not using a managed service like Kubernetes, you can still use the rolling update or node pools method with your own cluster to upgrade nodes. The difference is you need to manually add the new nodes to your cluster, and perform the master upgrade yourself, which can be tricky.

I highly recommend using Kubernetes Engine regional clusters for the high-availability masters and automatic node upgrades to have a hassle-free upgrade experience. If you need the extra control for your node updates, using node pools gives you that control without giving up the advantages of a managed Kubernetes platform that Kubernetes Engine gives you.

And thus concludes this series on Kubernetes best practices. If you have ideas for other topics you’d like me to address in the future, you can find me on Twitter. And if you’re attending Google Cloud Next ‘18 this July, be sure to drop by and say hi!

Introducing VPC-native clusters for Google Kubernetes Engine


[Editor's note: This is one of many posts on enterprise features enabled by Kubernetes Engine 1.10. For the full coverage, follow along here.]

Over the past few weeks, we’ve made some exciting announcements around Google Kubernetes Engine, starting with the general availability of Kubernetes 1.10 in the service. This latest version has new features that will really help enterprise use cases such as support for Shared Virtual Private Cloud (VPC) and Regional Clusters for high availability and reliability.

Building on that momentum, we are excited to announce the ability to create VPC-native clusters in Kubernetes Engine. A VPC-native cluster uses Alias IP routing built into the VPC network, resulting in a more scalable, secure and simple system that is suited for demanding enterprise deployments and use cases.

VPC-native clusters using Alias IP
VPC-native clusters rely on Alias IP which provides integrated VPC support for container networking. Without Alias IP, Kubernetes Engine uses Routes for Pod networking, which requires the Kubernetes control plane to maintain static routes to each Node. By using Alias IP, the VPC control panel automatically manages routing setup for Pods. In addition to this automatic management, native integration of container networking into the VPC fabric improves scalability and integration between Kubernetes and other VPC features.

Alias IP has been available on Google Cloud Platform (GCP) for Google Compute Engine instances for some time. Extending this functionality to Kubernetes Engine provides the following benefits:
  • Scale enhancements - VPC-native clusters no longer carry the burden of Routes and can scale to more nodes. VPC-native clusters will not be subject to Route quotas and limits, allowing you to seamlessly increase your Cluster size.
  • Hybrid connectivity - Alias IP subnets can be advertised by the Cloud Router over Cloud VPN or Cloud Interconnect, allowing you to connect your hybrid on-premises deployments with your Kubernetes Engine cluster. In addition, Alias IP advertisements with Cloud Router gives you granular control over which subnetworks and secondary range(s) are published to peer routers.
  • Better VPC integration - Alias IP provides Kubernetes Engine Pods with direct access to Google services like Google Cloud Storage, BigQuery and any other services served from the googleapis.com domain, without the overhead of a NAT proxy. Alias IP also enables enhanced VPC features such as Shared VPC.
  • Security checks - Alias IP allows you to enable anti-spoofing checks for the Nodes in your cluster. These anti-spoofing checks are provisioned on instances by default to ensure that traffic is not sent from arbitrary source IPs. Since Alias IP ranges in VPC-native clusters are known to the VPC network, they pass anti-spoofing checks by gidefault.
  • IP address management - VPC-native clusters integrate directly into your VPC IP address management system, preventing potential double allocation of your VPC IP space. Route-based clusters required manually blocking off the set of IPs assigned to your Cluster. VPC-native clusters provide two modes of allocating IPs, providing a full spectrum of control to the user. In the default method, Kubernetes Engine auto-selects and assigns secondary ranges for Pods and Services ranges. And if you need tight control over subnet assignments, you can create a custom subnet and secondary ranges and use it for Node, Pods and Service IPs. With Alias IP, GCP ensures that the Pod IP addresses cannot conflict with IP addresses on other resources.
Early adopters are already benefiting from the security and scale of VPC-native clusters in Kubernetes Engine. Vungle, an in-app video advertising platform for performance marketers, uses VPC-native clusters in Kubernetes Engine for its demanding applications
“VPC-native clusters, using Alias IPs, in Google Kubernetes Engine allowed us to run our bandwidth-hungry applications on Kubernetes without any of the performance degradation that we had seen when using overlay networks."
- Daniel Nelson, Director of Engineering, Vungle
Try it out today!
Create VPC-native clusters in Kubernetes Engine to get the ease of access and scale enterprise workloads require. Also, don’t forget to sign up for our upcoming webinar, 3 reasons why you should run your enterprise workloads on Google Kubernetes Engine.

Stackdriver brings powerful alerting capabilities to the condition editor UI


If you use Stackdriver, you probably rely on our alerting stack to be informed when your applications are misbehaving or aren’t performing as expected. We know how important it is to receive notifications at the right time as well as in the right situation. Imprecisely specifying what situation you want to be alerted on can lead to too many alerts (false positives) or too few (false negatives). When defining a Stackdriver alerting policy, it’s imperative that conditions be made as specific as possible, which is part of the reason that we introduced the ability to manage alerting policies in the Stackdriver Monitoring API last month. This, for example, enables users to create alerting conditions for resources filtered by certain metadata so that they can assign different conditions to parts of their applications that use similar resources but perform different functions.

But what about users who want to specify similar filters and aggregations using the Stackdriver UI? How can you get a more precise way to define the behavior that a metric must exhibit for the condition to be met (for example, alerting on certain resources filtered by metadata), as well as a more visual way of finding the right metrics to alert on for your applications?

We’ve got you covered. We are excited to announce the beta version of our new alerting condition configuration UI. In addition to allowing you to define alerting conditions more precisely, this new UI provides an easier, more visual way to find the metrics to alert on. The new UI lets you use the same metrics selector as used in Stackdriver’s Metrics Explorer to define a broader set of conditions. Starting today, you can use that metrics selector to create and edit threshold conditions for alerting policies. The same UI that you use to select metrics for charts can now be used for defining alerting policy conditions. It’s a powerful and more complete method for identifying your time series and specific aggregations. You’ll be able to express more targeted, actionable alerts with fewer false alerts.

We’ve already seen some great use cases for this functionality. Here are some ways in which our users have used this UI during early testing:

1. Alerting on aggregations of custom metrics and logs-based metrics
The ability to alert on aggregations of custom metrics or logs-based metrics is a common request from our users. This was recently made possible with the introduction of support for alerting policy management in the Stackdriver Monitoring v3 API. However, until this beta launch, there was no visual equivalent. With the introduction of this new UI, you can now visually explore metrics and define their alerting conditions before committing to an alerting policy. This adds a useful visual representation so you’ll have choices when setting up alert policies.

For example, below is a screen recording that shows how to aggregate a sum across a custom metrics grouped by pod:

2. Filter metadata to alert on specific Kubernetes resources
With the recent introduction of Stackdriver Kubernetes Monitoring, you have more out-of-the-box observability into your Kubernetes clusters. Now, with the addition of this new threshold condition UI, you can set up alerts on specific resources defined by metadata fields, instead of having to include the entire cluster.

For example, below is a screen recording showing how to alert when Kubernetes resources with a specific service name (customers-service) cross a certain aggregated threshold of the bytes transmitted. Using the metrics selector, you can configure the specific filters, grouping and aggregations that you’re interested in:

3. Edit metric threshold conditions that were created via the API
Many Stackdriver users utilize both the API and the alerting UI to create and edit alerting conditions. With this release, you can edit directly in the new UI many conditions that were previously created using the API.

Getting started with the new Stackdriver condition editor UI
To use the new UI, you must first opt in. When adding a policy condition, go to the Select condition type page. At the top of this page is an invitation to try a new variant of the UI:

Note that the new condition editor does not support process-health and uptime-check conditions, which continue to use the existing UI. The new UI supports all other condition types.

If you prefer to go back to the current UI, you can do so at any time by opting out. We’re looking forward to hearing more from users about what you’re accomplishing with the new UI.

To learn more, check out some specifics here on using the alerting UI.

Please send us feedback either via the feedback widget (click on your avatar -> Send Feedback), or by emailing us.

Related content:
New ways to manage and automate your Stackdriver alerting policies
Extracting value from your logs with Stackdriver logs-based metrics
Announcing Stackdriver Kubernetes Monitoring: Comprehensive Kubernetes observability from the start