If you use Stackdriver, you probably rely on our alerting stack to be informed when your applications are misbehaving or aren’t performing as expected. We know how important it is to receive notifications at the right time as well as in the right situation. Imprecisely specifying what situation you want to be alerted on can lead to too many alerts (false positives) or too few (false negatives). When defining a Stackdriver alerting policy, it’s imperative that conditions be made as specific as possible, which is part of the reason that we introduced the ability to manage alerting policies in the Stackdriver Monitoring API last month. This, for example, enables users to create alerting conditions for resources filtered by certain metadata so that they can assign different conditions to parts of their applications that use similar resources but perform different functions.
But what about users who want to specify similar filters and aggregations using the Stackdriver UI? How can you get a more precise way to define the behavior that a metric must exhibit for the condition to be met (for example, alerting on certain resources filtered by metadata), as well as a more visual way of finding the right metrics to alert on for your applications?
We’ve got you covered. We are excited to announce the beta version of our new alerting condition configuration UI. In addition to allowing you to define alerting conditions more precisely, this new UI provides an easier, more visual way to find the metrics to alert on. The new UI lets you use the same metrics selector as used in Stackdriver’s Metrics Explorer to define a broader set of conditions. Starting today, you can use that metrics selector to create and edit threshold conditions for alerting policies. The same UI that you use to select metrics for charts can now be used for defining alerting policy conditions. It’s a powerful and more complete method for identifying your time series and specific aggregations. You’ll be able to express more targeted, actionable alerts with fewer false alerts.
We’ve already seen some great use cases for this functionality. Here are some ways in which our users have used this UI during early testing:
1. Alerting on aggregations of custom metrics and logs-based metrics
The ability to alert on aggregations of custom metrics or logs-based metrics is a common request from our users. This was recently made possible with the introduction of support for alerting policy management in the Stackdriver Monitoring v3 API. However, until this beta launch, there was no visual equivalent. With the introduction of this new UI, you can now visually explore metrics and define their alerting conditions before committing to an alerting policy. This adds a useful visual representation so you’ll have choices when setting up alert policies.
For example, below is a screen recording that shows how to aggregate a sum across a custom metrics grouped by pod:
2. Filter metadata to alert on specific Kubernetes resources
With the recent introduction of Stackdriver Kubernetes Monitoring, you have more out-of-the-box observability into your Kubernetes clusters. Now, with the addition of this new threshold condition UI, you can set up alerts on specific resources defined by metadata fields, instead of having to include the entire cluster.
For example, below is a screen recording showing how to alert when Kubernetes resources with a specific service name (customers-service) cross a certain aggregated threshold of the bytes transmitted. Using the metrics selector, you can configure the specific filters, grouping and aggregations that you’re interested in:

3. Edit metric threshold conditions that were created via the API
Many Stackdriver users utilize both the API and the alerting UI to create and edit alerting conditions. With this release, you can edit directly in the new UI many conditions that were previously created using the API.
Getting started with the new Stackdriver condition editor UI
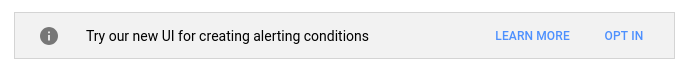
To use the new UI, you must first opt in. When adding a policy condition, go to the Select condition type page. At the top of this page is an invitation to try a new variant of the UI:
Note that the new condition editor does not support process-health and uptime-check conditions, which continue to use the existing UI. The new UI supports all other condition types.
If you prefer to go back to the current UI, you can do so at any time by opting out. We’re looking forward to hearing more from users about what you’re accomplishing with the new UI.
To learn more, check out some specifics here on using the alerting UI.
Please send us feedback either via the feedback widget (click on your avatar -> Send Feedback), or by emailing us.
Related content:
New ways to manage and automate your Stackdriver alerting policies
Extracting value from your logs with Stackdriver logs-based metrics
Announcing Stackdriver Kubernetes Monitoring: Comprehensive Kubernetes observability from the start
