Tag Archives: Announcements

Introducing QUIC support for HTTPS load balancing


For four years now, Google has been using QUIC, a UDP-based encrypted transport protocol optimized for HTTPS, to deliver traffic for our products – from Google Web Search, to YouTube, to this very blog. If you’re reading this in Chrome, you’re probably using QUIC right now. QUIC makes the web faster, particularly for slow connections, and now your cloud services can enjoy that speed: today, we’re happy to be the first major public cloud to offer QUIC support for our HTTPS load balancers.

QUIC’s key features include establishing connections faster, stream-based multiplexing, improved loss recovery, and no head-of-line blocking. QUIC is designed with mobility in mind, and supports migrating connections from WiFi to Cellular and back.

Benefits of QUIC


If your service is sensitive to latency, QUIC will make it faster because of the way it establishes connections. When a web client uses TCP and TLS, it requires two to three round trips with a server to establish a secure connection before the browser can send a request. With QUIC, if a client has talked to a given server before, it can start sending data without any round trips, so your web pages will load faster. How much faster? On a well-optimized site like Google Search, connections are often pre-established, so QUIC’s faster connections can only speed up some requests—but QUIC still improves mean page load time by 8% globally, and up to 13% in regions where latency is higher.

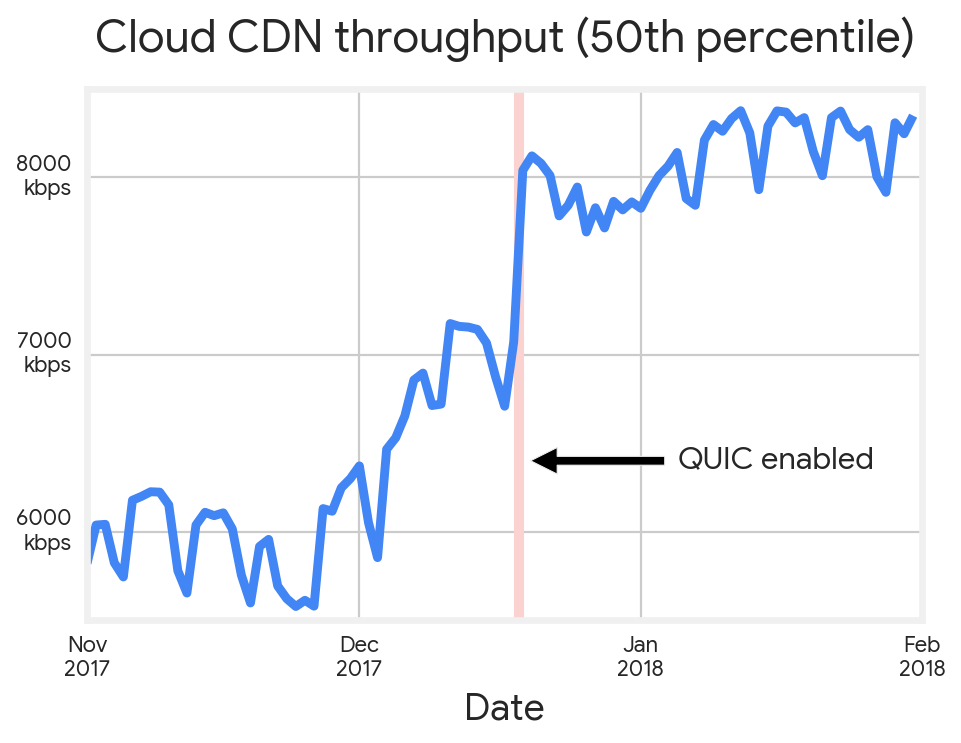
Cedexis benchmarked our Cloud CDN performance using a Google Cloud project. Here’s what happened when we enabled QUIC.

Encryption is built into QUIC, using AEAD algorithms such as AES-GCM and ChaCha20 for both privacy and integrity. QUIC authenticates the parts of its headers that it doesn’t encrypt, so attackers can’t modify any part of a message.

Like HTTP/2, QUIC multiplexes multiple streams into one connection, so that a connection can serve several HTTP requests simultaneously. But HTTP/2 uses TCP as its transport, so all of its streams can be blocked when a single TCP packet is lost—a problem called head-of-line blocking. QUIC is different: Loss of a UDP packet within a QUIC connection only affects the streams contained within that packet. In other words, QUIC won’t let a problem with one request slow the others down, even on an unreliable connection.

Enabling QUIC

You can enable QUIC in your load balancer with a single setting in the GCP Console. Just edit the frontend configuration for your load balancer and enable QUIC negotiation for the IP and port you want to use, and you’re done.

You can also enable QUIC using gcloud:
gcloud compute target-https-proxies update proxy-name 
--quic_override=ENABLE
Once you’ve enabled QUIC, your load balancer negotiates QUIC with clients that support it, like Google Chrome and Chromium. Clients that do not support QUIC continue to use HTTPS seamlessly. If you distribute your own mobile client, you can integrate Cronet to gain QUIC support. The load balancer translates QUIC to HTTP/1.1 for your backend servers, just like traffic with any other protocol, so you don’t need to make any changes to your backends—all you need to do is enable QUIC in your load balancer.

The Future of QUIC

We’re working to help QUIC become a standard for web communication, just as we did with HTTP/2. The IETF formed a QUIC working group in November 2016, which has seen intense engagement from IETF participants, and is scheduled to complete v1 drafts this November. QUIC v1 will support HTTP over QUIC, use TLS 1.3 as the cryptographic handshake, and support migration of client connections. At the working group’s most recent interop event, participants presented over ten independent implementations.

QUIC is designed to evolve over time. A client and server can negotiate which version of QUIC to use, and as the IETF QUIC specifications become more stable and members reach clear consensus on key decisions, we’ve used that version negotiation to keep pace with the current IETF drafts. Future planned versions will also include features such as partial reliability, multipath, and support for non-HTTP applications like WebRTC.

QUIC works across changing network connections. QUIC can migrate client connections between cellular and Wifi networks, so requests don’t time out and fail when the current network degrades. This migration reduces the number of failed requests and decreases tail latency, and our developers are working on making it even better. QUIC client connection migration will soon be available in Cronet.

Try it out today

Read more about QUIC in the HTTPS load balancing documentation and enable it for your project(s) by editing your HTTP(S) load balancer settings. We look forward to your feedback!

Now, you can deploy your Node.js app to App Engine standard environment


Developers love Google App Engine’s zero-config deployments, zero server management and auto-scaling capabilities. At Google Cloud, our goal is to help you be more productive by supporting more popular programming languages. Starting today, you can now deploy your Node.js 8 applications to App Engine standard environment. App Engine is a fully-managed application platform that lets you deploy web and mobile applications without worrying about the underlying infrastructure.

Support for Node.js in App Engine standard environment brings a number of benefits:
  • Fast deployments and automatic scaling - With App Engine standard environment, you can expect short deployment times. For example, it takes under a minute to deploy a basic Express.js application. Further, your Node.js apps will scale instantaneously depending on web traffic; App Engine automatically scales to zero when there are no incoming requests and quickly scales up the number of instances when traffic increases.
  • Idiomatic developer experience - When designing the new runtime, we focused on providing a delightful and idiomatic developer experience. For example, the new Node.js runtime has no language or API restrictions. You can use your favorite Node.js modules, including native ones, by simply declaring your npm dependencies in your package.json, and App Engine installs them in the cloud after deploying your app. Out of the box, you will find your application logs and key performance indicators in Stackdriver. Finally, the base image contains the OS packages you need to run headless Chrome, which you can easily control using the Puppeteer module. Read more in the documentation.
  • Strong security - With our automated one-click certificate generation, you can serve your application under a secure HTTPS URL with your own custom domain. In addition, we take care of security updates so that you don't have to, automatically updating the operating system and Node.js minor and patch versions.

Node.js and Google Cloud Platform

We’ve also crafted our Node.js client libraries so you can easily use Google Cloud Platform (GCP) products from your Node.js application. For example, Cloud Datastore is a great match for App Engine, and you can easily set up live production debugging or tracing by importing the modules. These client libraries are made possible by direct code contributions that our engineers make to Node.js.

Of course, Google's relationship with Node.js goes beyond GCP: Node.js is based on V8, Google's open source high-performance JavaScript engine. And as of last year, Google is a Platinum Sponsor of the Node.js foundation.

Try it now

Node.js has become a very popular runtime environment, and App Engine customers are excited by its availability on the platform.

"Once we deploy to node.js standard, we never have to manage that deployment again. It is exactly the kind of minimal configuration, zero maintenance experience we love about the rest of App Engine."
- Ben Kraft, senior engineer, Khan Academy.
“Node.js has offered Monash University a very flexible framework to build and develop rapid prototypes and minimal viable products that provide our stakeholders and users with scalable solutions for their needs. The launch of Node.js on App Engine standard has added the bonus of being a fully managed platform, ensuring our teams can focus their efforts on developing products.”
-Eric Jiang, Monash University

App Engine is ready and waiting to host your Node.js apps, with very minimal changes. You can even try it out using the App Engine free tier—just follow our Quickstart to learn how to deploy your app, or check out this short video:


Introducing improved pricing for Preemptible GPUs


Not everyone needs the extra performance that GPUs bring to a compute workload, but those who do, really do. Earlier this year, we announced that you could attach GPUs to Preemptible VMs on Google Compute Engine and Google Kubernetes Engine, lowering the price of using GPUs by 50%. Today, Preemptible GPUs are generally available (GA) and we’ve lowered preemptible prices on our entire GPU portfolio to be 70% cheaper than GPUs attached to on-demand VMs.

Preemptible GPUs are ideal for customers with short-lived, fault-tolerant and batch workloads such as machine learning (ML) and high-performance computing (HPC). Customers get access to large-scale GPU infrastructure, predictable low pricing, without having to bid on capacity. GPUs attached to Preemptible VMs are the same as equivalent on-demand resources with two key differences: Compute Engine may shut them down after providing you a 30-second warning, and you can use them for a maximum of 24 hours. Any GPUs attached to a Preemptible VM instance will be considered Preemptible and will be billed at the lower rate.

We offer three different GPU platforms to choose from, making it easy to pick the right GPU for your workload.


GPU Hourly Pricing *
GPU
Standard
(Prices vary by location)
Previous Preemptible
(All Locations)
New Preemptible
(All Locations)
$2.48
$1.24
$0.74
$1.46
$0.73
$0.43
$0.45
$0.22
$0.135
* GPU prices listed as hourly rate, per GPU attached to a VM that are billed by the second. Prices listed are for US regions. Prices for other regions may be different. Additional Sustained Use Discounts of up to 30% apply to GPU non-preemptible usage only.


Combined with custom machine types, Preemptible VMs with Preemptible GPUs let you build your compute stack with exactly the resources you need—and no more. Attaching Preemptible GPUs to custom Preemptible VMs allows you to reduce the amount of vCPU or host memory for your GPU VM, to save even further over  pre-defined VM shapes. Additionally, customers can use Preemptible Local SSD for a low-cost, high-performance storage option with our Preemptible GPUs. Check out this pricing calculator to configure your own preemptible environment.

The use-case for Preemptible GPUs
Hardware-accelerated infrastructure is in high demand among innovators, researchers, and academics doing machine learning research, particularly when coupled with the low, predictable pricing of Preemptible GPUs.

“Preemptible GPUs have been instrumental in enabling our research group to process large video collections at scale using our Scanner open-source platform. The predictable low cost makes it feasible for a single grad student to repeatedly deploy hundreds of GPUs in ML-based analyses of 100,000 hours of TV news video. This price drop enables us to perform twice the amount of processing with the same budget."
- Kayvon Fatahalian, Assistant Professor, Stanford University

Machine Learning Training and Preemptible GPUs
Training ML workloads is a great fit for Preemptible VMs with GPUs. Kubernetes Engine and  Compute Engine’s managed instance groups allow you to create dynamically scalable clusters of Preemptible VMs with GPUs for your large compute jobs. To help deal with Preemptible VM terminations, Tensorflow’s checkpointing feature can be used to save and restore work progress. An example and walk-through is provided here.

Getting Started
To get started with Preemptible GPUs in Google Compute Engine, simply append --preemptible to your instance create command in gcloud, specify scheduling.preemptible to true in the REST API or set Preemptibility to "On" in the Google Cloud Platform Console, and then attach a GPU as usual. You can use your regular GPU quota to launch Preemptible GPUs or, alternatively, you can request a special Preemptible GPUs quota that only applies to GPUs attached to Preemptible VMs. Check out our documentation to learn more. To learn how to use Preemptible GPUs with Google Kubernetes Engine, head over to our Kubernetes Engine GPU documentation.

For a certain class of workloads, Google Cloud GPUs provide exceptional compute performance. Now, with new low Preemptible GPU pricing, we invite you to see for yourself how easy it is to get the performance you need, at the low, predictable price that you want.

Doing DevOps in the cloud? Help us serve you better by taking this survey


The promise of higher service availability, reduced costs, and faster delivery is driving organizations to adopt public cloud services at a rapid pace. This includes organizations in highly regulated domains like financial services, healthcare, and government. However, the benefits promised by a well-designed cloud platform cannot be achieved with poor implementations that simply move traditional data center operations to the cloud, with no other changes in practices or systems architecture.

But we can’t improve what we don’t understand, and to this end we’re working with DevOps Research (DORA) on a project to help us all level up. To get better as an industry, we have to understand the use of cloud services and the impact of these practices on our ability to deliver high-quality software with speed and stability. Many of us have seen this first-hand. To get involved in the project, please take our survey.

I love working with developers and operators because I’ve seen how DevOps and Continuous Delivery practices work across multiple industries. How changing tooling can change culture, and create an environment of respect, accountability, and truth-telling. In so many organizations, the migration to the cloud isn’t just about changing where a workload runs. It’s an attempt to change IT culture, and DevOps practices are at the center of that transformation.

And now, we’d like to hear from you: what’s important to you when it comes to implementing and managing cloud services? We’ve teamed with DORA to research the impact of DevOps practices on organizations. And we need your insights and expertise to help shape this work. (Also, by participating, you could win some great prizes from DevOps.)

In collaboration with DORA, this program will study development and delivery practices that help make cloud computing reliable, available, and secure. We’re asking for 20 minutes of your time so we can better understand which practices are most effective for delivering software on cloud infrastructure. Click here to take the survey.

Introducing sole-tenant nodes for Google Compute Engine — when sharing isn’t an option


Today we are excited to announce beta availability of sole-tenant nodes on Google Compute Engine. Sole-tenant nodes are physical Compute Engine servers designed for your dedicated use. Normally, VM instances run on physical hosts that may be shared by many customers.  With sole-tenant nodes, you have the host all to yourself.

You can launch instances using the same options you would use for regular compute instances, except on server capacity dedicated to you. You can launch instances of any shape (i.e., vCPU and memory). A placement algorithm automatically finds the optimal location to launch your instance across all your nodes. If you prefer more control, you can manually select the location upon which to launch your instances. Instances launched on sole-tenant nodes can take advantage of live migration to avoid downtime during proactive maintenance. Pricing remains simple--pay only for the nodes you use on a per-second basis with a one-minute minimum charge. Sustained use discounts automatically apply, as do any new or existing committed use discounts.

Sole-tenant nodes enable a number of valuable use cases:

  • Compliance and regulation - Organizations with strict compliance and regulatory requirements can use sole-tenant nodes with VM placement to facilitate physical separation of their compute resources in the cloud. 
  • Isolation and utilization - Control instance placement directly via user-defined labels, or let Compute Engine automatically handle instance placement across nodes. You can also create and launch different machine types, or “shapes” on your nodes, in order to achieve the highest level of utilization. 


It’s easy to get started with sole-tenant nodes. You can launch a VM onto a sole-tenant node from the Google Cloud SDK, as well as from the Compute Engine APIs (support for Google Cloud Console coming soon):

// CREATE A NODE TEMPLATE
gcloud beta compute sole-tenancy node-templates create mynodetemplate
--node-type n1-node-96-624 --region us-central1 

// PROVISION A NODE GROUP OF SIZE TWO
gcloud beta compute sole-tenancy node-groups create mynodegroup
--node-template mynodetemplate --target-size 2 --zone us-central1-a

// CREATE INSTANCE WITH 4vCPUS AND 8GB OF MEMORY ON A NODE
gcloud beta compute instances create my-vm --node-group
mynodegroup --custom-cpu 4 --custom-memory 8 --zone us-central1-a
For guidance on manual placements and more, check out the documentation. Visit the pricing page to learn more about the offering, as well as regional availability.

A closer look at the HANA ecosystem on Google Cloud Platform


Since we announced our partnership with SAP in early 2017, we’ve rapidly expanded our support for SAP HANA, SAP’s in-memory, column-oriented, relational database management system. From the beginning, we knew we’d need to build tools that integrate SAP HANA with Google Cloud Platform (GCP) that make it faster and easier for developers and administrators to take advantage of the platform.

In this blog post, we’ll walk you through the evolution of SAP HANA on GCP and take a deeper look at the ecosystem we’ve built to support our customers.

The evolution of SAP HANA on GCP


For many enterprise customers running SAP HANA databases, instances with large amounts of memory are essential. That’s why we’ve been working to make virtual machines with larger memory configurations available for SAP HANA workloads.

Our initial work with SAP on the certification process for SAP HANA began in early 2017. In that 15 month period, we’ve rapidly evolved from instances with 208GB memory to 4TB memory. This has allowed us to support larger single-node SAP HANA installations of up to 4TB.

Smart Data Access — Google BigQuery

Google BigQuery, our serverless data warehouse, enables low cost, high performance analytics at petabyte scale. We’ve worked with SAP to natively integrate SAP HANA with BigQuery through smart data access which allows you to extend SAP HANA’s capabilities and query data stored within BigQuery by means of virtual tables. This support has been available since SAP HANA 2.0 SPS 03, and you can try it out by following this step-by-step codelabs tutorial.

Fully automated deployment of SAP HANA

In many cases, the manual deployment process can be time consuming, error prone and cumbersome. It’s very important to reduce or eliminate the margin of error and make the deployment conform to SAP’s best practices and standards.


To address this, we’ve launched deployment templates that fully automate the deployment of single node and scale-out SAP HANA configurations on GCP. In addition, we’ve also launched a new deployment automation template that creates a high availability SAP HANA configuration with automatic failover.

With these templates, you have access to fully configured, ready-to-go SAP HANA environments in a matter of minutes. You can also see the resources you created, and a complete catalog of all your deployments, in one location through the GCP console. We’ve also made the deployment process fully visible by providing deployment logs through Google Stackdriver.

Monitoring SAP HANA with Stackdriver

Visibility into what’s happening inside your SAP HANA database can help you identify factors impacting your database, and prepare accordingly. For example, a time series view of how resource utilization or latency within the SAP HANA database changes over time can help administrators plan in advance, and in many cases successfully troubleshoot issues.

Stackdriver provides monitoring, logging, and diagnostics to better understand the health, performance, and availability of cloud-powered applications. Stackdriver’s integration with SAP HANA helps administrators monitor their SAP HANA databases, notifying and alerting them so they can proactively fix issues.

More information on this integration is available in our documentation.

TensorFlow support in SAP HANA

SAP has offered support for TensorFlow Serving beginning with SAP HANA 2.0. This lets you directly build inference into SAP HANA through custom machine learning models hosted in TensorFlow serving applications running on Google Compute Engine.

You can easily build a continuous training pipeline by exporting data in your SAP HANA database to Google Cloud Storage and then using Cloud TPUs to train deep learning models. These models can then be hosted with TensorFlow Serving to be used for inference within SAP HANA.

SAP Cloud Platform, SAP HANA as a Service

SAP HANA as a Service is now also deployable to the Google Cloud Platform. The fully managed cloud service makes it possible for developers to leverage the power of SAP HANA, without spending time on operational and administrative tasks. The service is especially well suited to customers who have the goal of rapid innovation, reducing time to value.

SAP HANA, express edition on Google Cloud Launcher

SAP HANA, express edition is meant for developers and technologists who prefer a hands-on learning experience. A free license is included, allowing users to use a large catalog of tutorial content, online courses and samples to get started with SAP HANA. The Google Launcher provides users a fast and effective provisioning experience for SAP HANA, express edition.

Conclusion

These developments are all part of our continuing goal to make Google Cloud the best place to run SAP applications. We’ll continue listening to your feedback, and we’ll have more updates to share in the coming months. In the meantime, you can learn more about SAP HANA on GCP by visiting our website. And if you’d like to learn about all our announcements at SAPPHIRE NOW, read our Google Cloud blog post.

Regional clusters in Google Kubernetes Engine are now generally available


Editor's note: This is one of many posts on enterprise features you’ll find in Kubernetes Engine 1.10. For the full coverage, follow along here.

A highly available Kubernetes cluster is a key requirement for most production applications. However, adding this protection can be complex. We’ve consistently heard from Kubernetes users that creating and managing a high-availability Kubernetes cluster is no small feat. Keeping etcd (the key-value store) replicas in sync across zones, scaling your masters, and ensuring that your control plane is fronted by a resilient load balancer are just some of the challenges users face when maintaining their own highly available cluster.

Today we’re proud to announce the general availability of one of Google Kubernetes Engine's most requested enterprise-grade features: regional clusters. Regional clusters create a multi-master, highly-available Kubernetes cluster that spreads both the control plane and the nodes across multiple zones in the same region, allowing us to increase the control plane uptime to 99.95%. In addition to the increased availability, regional clusters give you a zero-downtime upgrade experience, so that your cluster is always available for deployments.

We’ve seen rapid adoption of regional clusters since we announced the beta, and with many users already running production workloads using regional clusters. In addition, we are pleased to announce today that regional clusters in Kubernetes Engine are available at no additional cost.

Get started with regional clusters

You can quickly create your first regional cluster using the Cloud Console or the gcloud command line tool.
$ gcloud container clusters create my-regional-cluster
--region=us-east1 --num-nodes=2
This creates a regional cluster in us-east1 with two nodes in each of the us-east1 zones.

By creating a regional cluster, you get:
  • Resilience from single zone failure - Because your masters and application nodes are available across a region rather than a single zone, your Kubernetes cluster is still fully functional if an entire zone goes down.
  • No downtime during master upgrades - Kubernetes Engine minimizes downtime during all Kubernetes master upgrades, but with a single master, some downtime is inevitable. By using regional clusters, the control plane remains online and available, even during upgrades.
Regional clusters is just one of the many features that makes Kubernetes Engine a great choice for enterprises seeking to run a production-grade, managed Kubernetes cluster in the cloud. For a more detailed explanation of the regional clusters feature along with additional flags you can use, check out the documentation.

Last month today: GCP in May


When it comes to Google Cloud Platform (GCP), every month is chock full of news and information. We’re kicking off a monthly recap of key moments you may have missed.

What caught your attention this month:

Announcements about open source projects were some of the most-read this month.
  • Open-sourcing gVisor, a sandboxed container runtime was by far your favorite post in May. gVisor is a sandbox that lets you run containers in strongly isolated environments. It’s isolated like a virtual machine, but more lightweight and also more flexible, since it interfaces with the host OS just like another process.
  • Our introduction of Asylo, an open-source framework for confidential computing, also got your attention. As more and more sensitive workloads move to cloud, lots of businesses want to be able to verify that they’re properly isolated, inside a closed environment that’s only available to authorized users. Asylo democratizes trusted execution environments (TEEs) by allowing them to run on generic hardware. With Asylo, developers will be able to run their workloads encrypted in a highly secure environment, whether it’s on-premises or in the cloud.
  • Rounding out the open-source fun for the month was our introduction of the beta availability of Cloud Memorystore, a fully managed in-memory data store service for Redis. Cloud Memorystore gives you the caching power of Redis to reduce latency, without having to manage the details.


Hot topics: Kubernetes, DevOps and SRE

Google Kubernetes Engine 1.10 debuted in May, and we had a lot to say about the new features that this version enables—from security to brand-new monitoring functionality via Stackdriver Kubernetes Monitoring to networking. Start with this post to see what’s new and how customers like Spotify are using Kubernetes Engine on Google Cloud.

And one of our recent posts also struck a chord, as two of our site reliability engineering (SRE) experts delved into the differences—and similarities—between SRE and DevOps. They have similar goals, mostly around creating flexible, agile dev environments, but SRE generally gets much more specific and prescriptive than DevOps in accomplishing them.

Under the radar: GCP adds infrastructure options

As you look for new ways to use GCP to run your business, our engineers are adding features and new releases to give you more power, resources and coverage.

First, we introduced ultramem Google Compute Engine machine types, which offer more memory and compute resources than any other Compute Engine VM instance. These machines types are especially useful for those of you running enterprise workloads that need a lot of memory, like data analytics or high-performance applications.

We’ve also been busy on the back-end in other ways too, as we continue adding new regional cloud computing infrastructure. Our third zone of the Singapore region opened in May, and we’ll open a Zurich region next year.

Stay tuned in June for more on the technologies behind Google Cloud—we’ve got lots up our sleeve.

Google is named a leader in the 2018 Gartner Infrastructure as a Service Magic Quadrant


We’re pleased to announce that Gartner recently named Google as a Leader in the 2018 Gartner Infrastructure as a Service Magic Quadrant (report available here).

With an increasing number of enterprises turning to the cloud to build and scale their businesses, research from organizations like Gartner can help you evaluate and compare cloud providers.

We believe being recognized by Gartner as one of the three leading cloud providers demonstrates our commitment to building innovative technology that helps customers run their businesses at scale. It also highlights our goal to help customers transform their businesses through open source and deep investments in analytics and machine learning.

Here are a few takeaways from the report:

A solid compute foundation
Gartner identifies our core IaaS and PaaS capabilities as a strength, and noted that we’re increasingly offering a number of innovative capabilities. From custom machine types and sustained use discounts, to the next generation of cloud-native containerized development and operations through tools like Kubernetes and Istio, we work hard to deliver a cloud that can run your most demanding applications.

Our investments in analytics and ML
The report recognizes the investments we’ve made in advanced analytics and machine learning. Our Google Cloud AI team has been making good progress towards this goal. In 2017, we introduced Cloud Machine Learning Engine, to help developers with machine learning expertise easily build ML models that work on any type of data, of any size. We showed how modern machine learning services, i.e., APIs—including Vision, Speech, NLP, Translation, and Dialogflow—could be built upon pre-trained models to bring scale and speed to business applications. Kaggle, our community of data scientists and ML researchers, has grown to more than one million members. And today, more than 10,000 businesses are using Google Cloud AI services, including companies like Kewpie, and Ocado. Recently introduced Cloud AutoML to help businesses with limited ML expertise start building their own high-quality custom models.

Our commitment to openness
Our strong grounding in the open source ecosystem, with an emphasis on portability, was highlighted in the report. Our goal is to help more organizations take advantage of cloud services, which means offering the tools to build, scale, and quickly move to the cloud. Our dedication to portability and open source gives you the flexibility to build on your own terms.

Sharing our best practices with customers
Our Customer Reliability Engineering (CRE) program is an approach that can help customers succeed while running their operations on Google Cloud Platform (GCP). We built CRE to provide a shared operational fate between you and Google, giving you more control over the critical applications you’ve entrusted with us.

Google Cloud continues to be adopted by enterprises who are looking to achieve greater availability, scalability, and security in the cloud. Gartner’s IaaS Magic Quadrant is now the sixth report from a leading analyst firm that has identified Google Cloud as a Leader. You can download a complimentary copy of the Gartner Cloud Infrastructure as a Service Magic Quadrant report on our website.

Gartner does not endorse any vendor, product or service depicted in its research publications, and does not advise technology users to select only those vendors with the highest ratings or other designation. Gartner research publications consist of the opinions of Gartner's research organization and should not be construed as statements of fact. Gartner disclaims all warranties, expressed or implied, with respect to this research, including any warranties of merchantability or fitness for a particular purpose.

Gain visibility and take control of Stackdriver costs with new metrics and tools


A few months back, we announced new simplified Stackdriver pricing that will go into effect on June 30. We’re excited to bring this change to our users. To streamline this change, you’ll receive advanced notifications and alerting on the performance and diagnostics data you track for cloud applications, plus flexibility in creating dashboards, without having to opt in to the premium pricing tier.

We’ve added new metrics and views to help you understand your Stackdriver usage now as you prepare for the new pricing to take effect. We’ve got some tips to help you maximize value while minimizing costs for your monitoring, logging and application performance management (APM) solutions.

Getting visibility into your monitoring and logging usage

In anticipation of the pricing changes, we’ve added new metrics to make it easier than ever to understand your logs and metrics volume. There are three different ways to view your usage, depending on which tool you prefer: the billing console; updated summary pages in the Stackdriver console; or metrics available via the API and Metrics Explorer.

1. Analyzing Stackdriver costs using the billing console
Stackdriver is now reporting logging and monitoring usage on the new SKUs (fancy name for something you can buy—in this case, volume of metrics or logs), which are visible in the billing console. Don’t worry—until June 30, the costs will still be $0, but you can view your existing volume across your billing account by going to the new reports page in the billing console. To view your current Stackdriver logging and monitoring usage volume, select group by SKU, filter for Log Volume, Metric Volume or Monitoring API Requests, and you’ll see your usage across your billing account. (See more in our documentation). You can also analyze your usage by exporting your billing data to BigQuery. Once you understand your usage, you can easily estimate what your cost will be after June 30 using the pricing calculator under the Upcoming Model tab.

2. Analyzing Stackdriver costs using the Stackdriver console
We’ve also updated the tools for viewing and managing volumes of logs and metrics within Stackdriver itself.


The Logs Ingestion page, above, now shows last month’s volume in addition to the current month’s volume for the project and by resource type. We’ve also added handy links to view detailed usage in Metrics Explorer right from this page as well.

The Monitoring Resource Usage page, above, now shows your metrics volume month-to-date vs. the last calendar month (note that these metrics are brand-new, so they will take some time to populate). All projects in your Stackdriver account are broken out individually. We’ve also added the capability to see your projected total for the month and added links to see the details in Metrics Explorer.

3. Analyzing Stackdriver costs using the API and Metrics Explorer
If you’d like to understand which logs or metrics are costing the most, you’re in luck—we now have even better tools for viewing, analyzing and alerting on metrics. For Stackdriver Logging, we’ve added two new metrics:
  • logging.googleapis.com/billing/bytes_ingested provides real-time incremental delta values that can be used to calculate your rates of log volume ingestion. It does not cover excluded logs volume. This metric provides a resource_type label to analyze log volume by various monitored resource types that are sending logs.
  • logging.googleapis.com/billing/monthly_bytes_ingested provides your usage as a month-to-date sum every 30 minutes and resets to zero every month. This can be useful for alerting on month-to-date log volume so that you can create or update exclusions as needed.
We’ve also added a new metric for Stackdriver Monitoring to make it easier to understand your costs:
  • monitoring.googleapis.com/billing/bytes_ingested provides real-time incremental deltas that can be used to calculate your rate of metrics volume ingestion. You can drill down and group or filter by metric_domain to separate out usage for your agent, AWS, custom or logs-based metrics. You can also drill down by individual metric_type or resource_type.
You can access these metrics via the monitoring API, create charts for them in Stackdriver or explore them in real time in Metrics Explorer (shown below), where you can easily group by the provided labels in each metric, or use Outlier mode to detect top metric or resource type with the highest usage. You can read more about aggregations in our documentation.

If you’re interested in an even deeper analysis of your logs usage, check out this post by one of Google’s Technical Solutions Consultants that will show you how to analyze your log volume using logs-based metrics in Datalab.


Controlling your monitoring and logging costs
Our new pricing model is designed to make the same powerful log and metric analysis we use within Google accessible to everyone who wants to run reliable systems. That means you can focus on building great software, not on building logging and monitoring systems. This new model brings you a few notable benefits:
  • Generous allocations for monitoring, logging and trace, so many small or medium customers can use Stackdriver on their services at no cost.
    • Monitoring: All Google Cloud Platform (GCP) metrics and the first 150 MB of non-GCP metrics per month are available at no cost.
    • Logging: 50 GB free per month, plus all admin activity audit logs, are available at no cost.
  • Pay only for the data you want. Our pricing model is designed to put you in control.
    • Monitoring: When using Stackdriver, you pay for the volume of data you send, so a metric sent once an hour costs 1/60th as much as a metric sent once a minute. You’ll want to keep that in mind when setting up your monitoring schedules. We recommend collecting key logs and metrics via agents or custom metrics for everything in production; development environments may not need the same level of visibility. For custom metrics, you can write points at a smaller time granularity. Another way is to reduce the number of time series sent by avoiding unnecessary labels for custom and logs-based metrics that may have high cardinality.
    • Logging: The exclusion filter in Logging is an incredible tool for managing your costs. The way we’ve designed our system to manage logs is truly unique. As the image below shows, you can choose to export your logs to BigQuery, Cloud Storage or Cloud Pub/Sub without needing to pay to ingest them into Stackdriver.
      You can even use exclusion filters to collect a percentage of logs, such as 1% of successful HTTP responses. Plus, exclusion filters are easy to update, so if you’re troubleshooting your system, you can always temporarily increase the logs you’re ingesting.

Putting it all together: managing to your budget
Let’s look at how to combine the visibility from the new metrics with the other tools in Stackdriver to follow a specific monthly budget. Suppose we have $50 per month to spend on logs, and we’d like to make that go as far as possible. We can afford to ingest 150 GB of logs for the month. Looking at the Log Ingestion page, shown below, we can easily get an idea of our volume from last month—200 GB. We can also see that 75 GB came from our Cloud Load Balancer, so we’ll add an exclusion filter for 99% of 200 responses.

To make sure we don’t go over our budget, we’ll also set a Stackdriver alert, shown below, for when we reach 145 GB on the monthly log bytes ingested. Based on the cost of ingesting log bytes, that’s just before we’ll reach the $50 monthly budget threshold.

Based on this alerting policy, suppose we get an email near the end of the month that our volume is at 145 GB for the month to date. We can turn off ingestion of all logs in the project with an exclusion filter like this:
logName:*

Now only admin activity audit logs will come through, since they don’t count toward any quota and can’t be excluded. Let’s suppose we also have a requirement to save all data access logs on our project. Our sinks to BigQuery for these logs will continue to work, even though we won’t see those logs in Stackdriver Logging until we disable the exclusion filter. So we won’t lose that data during that period of time.


Like managing your household budget, running out of funds at the end of the month isn’t a best practice. Turning off your logs should be considered a last option, similar to turning off your water in your house toward the end of the month. Both these scenarios run the risk of making it harder to put out fires or incidents that may come up. One such risk is that if you have an issue and need to contact GCP support, they won’t be able to see your logs and may not be able to help you.


With these tools, you’ll be able to plan ahead to help ensure you’re avoiding ingesting less useful logs throughout the month. You might turn off unnecessary logs based on use, rejigger production and development environment monitoring or logging, or decide to offload data to another service or database. Our new metrics, views and dashboards give you a lot more tools to see how much you’re spending in both resources and IT budget in Stackdriver. You’ll be able to bring flexibility and efficiency to logging and monitoring, and avoid unpleasant surprises. 


To learn more about Stackdriver, check out our documentation or join in the conversation in our discussion group.


Related content