Tag Archives: Analytics 360 Suite

New: Streaming Google Analytics Data for BigQuery

Streaming data for BigQuery export is here.

Today we're happy to announce that data for the Google Analytics BigQuery export can be streamed as often as every 10 minutes into Google Cloud.

If you're a Google Analytics 360 client who wants to do current-day analysis, this means you can choose to send data to BigQuery up to six times per hour for almost real-time analysis and action. That’s a 48x improvement over the existing three-times-per-day exports.

What can I do with streaming data delivery?
Many businesses use faster access to their data to identify and engage with clients who show an intent to convert.

For example, it's well known that a good time to offer a discount to consumers is just after they've shown intent (like adding a product to their cart) but then abandoned the conversion funnel. An offer at that moment can bring back large numbers of consumers who then convert. In a case like this, it's critical to use the freshest data to identify those users in minutes and deploy the right campaign to bring them back.

More frequent updates also help clients recognize and fix issues more quickly, and react to cultural trends in time to join the conversation. BigQuery is an important part of the process: it helps you join other datasets from CRM systems, call centers, or offline sales that are not available in Google Analytics today to gain greater context into those clients, issues, or emerging trends.

When streaming data is combined with BigQuery's robust programmatic and statistical tools, predictive user models can capture a greater understanding of your audience ― and help you engage those users where and when they’re ready to convert. That means more sales opportunities and better returns on your investment.

What's changing?
Those who opt in to streaming Google Analytics data into BigQuery will see data delivered to their selected BigQuery project as fast as every 10 minutes.

Those who don't opt-in will continue to see data delivered just as it has been, arriving about every eight hours.

Why is opt-in required?
The new export uses Cloud Streaming Service, which costs a little extra: $0.05 per GB (that is, "a nickel a gig"). The opt-in is our way of making sure nobody gets surprised by the additional cost. If you don't take any action, your account will continue to run as it does now, and there will be no added cost.

What data is included?
Most data sent directly to Google Analytics is included. However, data pulled in from other sources like AdWords and DoubleClick, also referred to as “integration sources”, operate with additional requirements like fraud detection. That means that this data is purposefully delayed for your benefit and therefore exempt from this new streaming functionality.

For further details on what is supported or not supported, please read the help center article here.

How do I get started?
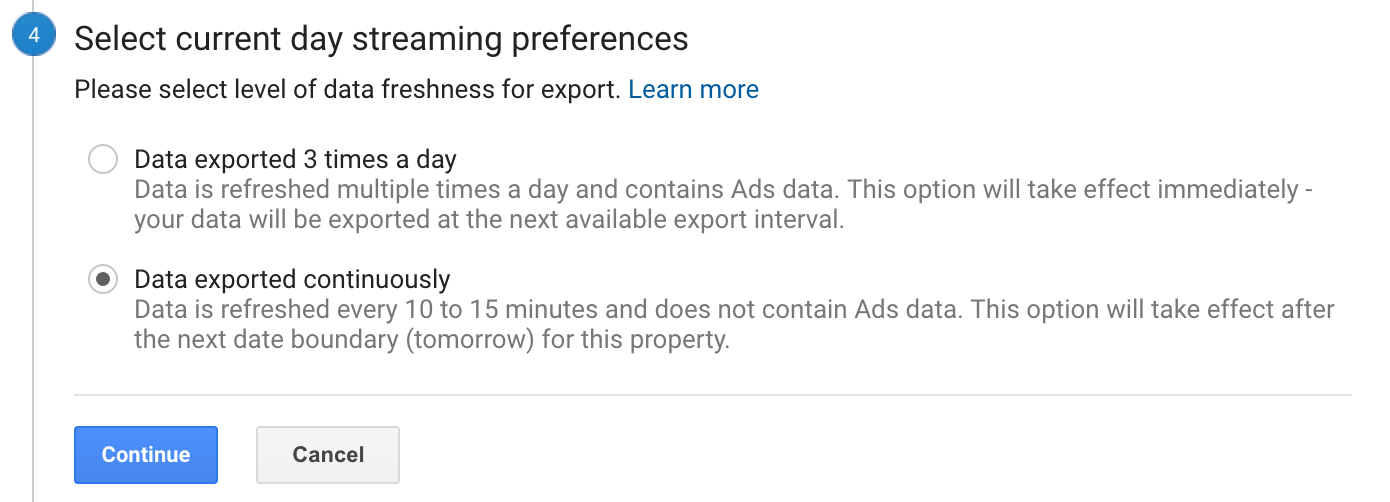
You can start receiving the more frequent data feeds by opting in. To do so, just visit the Google Analytics BigQuery linking page in the Property Admin section and choose the following option:

You can also visit our Help Center for full details on this change and opt-in instructions.

Marketing with a Heart of Data

At top companies, data drives strategies and daily decisions. Our new research with Econsultancy shows that 60% of leading marketers routinely take action based on analytics, and are also 48% more likely than mainstream marketers to say their strategy is strongly data-driven.1

So, how can you help your organization feel data in its pulse? Move beyond instinct and intuition and put data at the heart of your marketing strategy to drive smarter decisions and produce better results. 


Get over your gut — and take data to heart

As a confident decision-maker, it’s natural to trust your gut. But unless your instincts are right every time, why not consult another source? According to our report, nearly 60% of leading marketers agree that decisions made with data have better outcomes than those made with gut instinct or experience, compared to just 36% of mainstream marketers.2

Data tells us things we may not want to hear. For example, maybe you thought last quarter’s campaign strategy would work again, but the data tells a different story. That’s why it’s important to take data to heart — in other words, to accept and trust what your analytics tell you. Marketing with a heart of data also means being comfortable enough with change to act on those insights. Leading marketers are 44% more likely than mainstream ones to say their company is “quite open to change.”3 Is yours?

Let data flow freely

It’s not enough for you to trust your data. For your data-driven marketing strategy to succeed, everyone’s heart has to be in it. Companies that invest in data and analytics at every level empower their marketing organizations to make more informed choices and provide better customer experiences.

But this alignment is impossible if only analysts have access to data. The solution? Help get everyone comfortable with using data in their decision-making. When data flows freely and everyone understands how to use it, analytics can pump insight and value into every decision, strategy, and team.

It’s no wonder 93% of survey respondents agree that collaboration across marketing and analytics teams is essential to driving results.4 In organizations where data is valued and accessible, anyone — and everyone — can uncover insights and drive the business forward.


Don’t forget your head

Even when your marketing organization has a healthy core, you’ll need the support of the C-suite to succeed and lead. After all, what good is a heart of data without a head of marketing?

To secure executive buy-in, bring data insights to your meetings, calls, and conversations — use data to back up everything from big-idea budgets to email campaign optimizations. When executives receive recommendations based on analytics, they start to expect it.

Two-thirds of survey respondents at leading companies say that being a more data-driven organization is a top goal for their CEO, compared to just half of respondents at mainstream organizations.5 While your C-suite can set the right beat to propel innovation and collaboration, you can help keep the systems functioning to ensure data remains at the heart of your strategy.

Download the full Econsultancy research report here to learn how to build a truly data-driven culture.


1-5 Econsultancy/Google, "Customer Experience is Written in Data", May 2017, U.S. (n=677 marketing and measurement executives at companies with over $250M in revenues, primarily in North America; n=199 leading marketers who reported marketing significantly exceeded top business goal in 2016, n=478 mainstream marketers (remainder of the sample)

Three Ways to Get Data Out of Silos and Into Your Marketing Strategy

There are a lot of ways to organize information. And the bigger a company is, the more complicated it can be for employees to find the right data, let alone know how best to use or share that information to make more-informed decisions.

Chances are that some data is “hidden” in silos across your company. According to new research from Econsultancy in partnership with Google, 86% of senior executives agree: eliminating organizational silos is critical to expanding the use of data and analytics in decision-making.1

If teams don’t talk, or if your organization doesn’t have an integrated data strategy to harness marketing, customer, and advertising data, information and ideas won’t flow freely. Here are three ways to break down data silos and get your organization on the path to a more collaborative, data-driven culture.

1. Make data accessible — to everyone
If you have work to do to get your data house in order, you’re not alone: 61% of marketing decision-makers struggled to access or integrate data they needed last year.2

The first step to making data more accessible is to outline a data strategy that identifies data owners and key points of contact for each information source. Next, define how to integrate data and related technologies, and provide standards and processes related to data security and privacy. Include guidelines for sharing data internally.

Democratizing access to data and insights enables employees at all levels to check their gut — and that leads to better results. The same Econsultancy study found that marketing leaders are 1.6X as likely as their mainstream counterparts to strongly agree that open access to data leads to higher business performance.3

Watch our on-demand webinar featuring new research and best practices in marketing data and analytics strategy from Google and MIT Sloan School of Management. 

2. Champion the value of data-driven insights over gut feelings
Once data is made available to marketing managers and business decision-makers, make sure you champion a data-first mindset with your team. Using data effectively is a key differentiator for marketers who are ahead of the curve.

While a documented data and analytics strategy can provide a guide for all employees, support from the top helps set the tone. Nearly two-thirds of leading organizations say that their executives treat data-driven insights as more valuable than gut instinct.4

C-suite buy-in and other champions across the company help reinforce a data-driven culture by giving teams stuck in silos a nudge to collaborate and share analytic insights. Even better, this environment should give teams the incentive to align or share goals since data is core to campaign plans and marketing strategy.


3. Educate stakeholders on how to interpret the data
Having access to data is great, but if employees don’t know how to use it, the insights will remain isolated and unused. Consider this: 75% of marketers agree that lack of education and training on data and analytics is the biggest barrier to more business decisions being made based on data insights.5
If a team is empowered with the right learnings, it will proactively integrate data rather than push it aside. Set up brown bag sessions or internal trainings, or provide employees access to self-paced learning modules.

Finally, consider pairing the “data evangelists” and data storytellers within your organization with different team members to identify areas of focus based on relevant business goals and the biggest opportunities.


Download the Econsultancy report, “The customer experience is written in data,” to learn how successful brands put data at the center of their marketing strategies. 


1, 3, 4, 5 Google/Econsultancy, "The Customer Experience Is Written in Data", U.S., n=677 marketing and measurement executives at companies with over $250M in revenues, primarily in North America; n=199 leading marketers who reported marketing significantly exceeded top business goal in 2016; n=478 mainstream marketers (remainder of sample); May 2017. 2 Google Surveys, U.S., "2016–2017 Marketing Analytics Challenges and Goals," Base: 203, marketing executives who have analytics or data-driven initiatives, Dec. 2016.
2 Google Surveys, U.S., "2016–2017 Marketing Analytics Challenges and Goals," Base: 203, marketing executives who have analytics or data-driven initiatives, Dec. 2016.

Sigma Sport spins up 28% higher revenue with Google Optimize 360

If you’re a road cyclist or triathlete, chances are you know Sigma Sport. This global retailer sells bikes, clothing, energy bars, anti-chafe balm and everything else you need to power your way through your next big event — or just enjoy your next friendly ride in the country.

Recently Sigma Sport set out to address a vital need: to find more customers with high potential lifetime value. “Growth with high-value customers is key to our success,” says Nik Hill, the company’s Head of Digital. “We knew we needed to change our website experience to better engage these customers.”

To reach its goal, Sigma Sport turned to its agency, the digital conversion specialists Merkle | Periscopix. And together they turned to Google Optimize 360, part of the Google Analytics 360 Suite.

Using Optimize 360, Merkle | Periscopix created an experiment where they replaced Sigma Sport’s homepage carousel with brand-specific images of the site’s three top-performing brands: Castelli, Specialized, and Assos. Then they targeted the experiment to the audiences they had already built in Analytics.

This allowed Merkle | Periscopix to serve personalized experiences to fans of each brand. “We used the Analytics audience targeting feature in Optimize 360 to serve bespoke experiences to subsets of users,” says Shahina Meru, Associate Analytics Lead at Merkle | Periscopix. “We created three distinct Analytics audiences who had earlier bought or interacted with the top three brands, then used these as targeting rules in Optimize 360. Anyone who had looked at or bought a Specialized bike in the past, for instance, now saw Specialized products in their carousel.”


When Sigma Sport tested its new personalized home page, they saw right away that it was a hit with users. The experiment drove a 28% rise in revenue and a 32% increase in e-commerce conversion rate during the experiment. In fact, Sigma Sport saw uplift across the entire customer journey with a 90%+ probability to beat the baseline.

The bottom line: Personalization worked, both for bike-shopping customers and for Sigma Sport. Now Merkle | Periscopix is looking for more ways to enhance user experience with personalization from Analytics and Optimize 360.


Ask a question, get an answer in Google Analytics

What if getting answers about your key business metrics was as easy as asking a question in plain English? What if you could simply say, "How many new users did we have from organic search on mobile last week?" ― and get an answer right away?

Today, Google Analytics is taking a step toward that future.  Know what data you need and want it quickly? Just ask Google Analytics and get your answer.
This feature, which uses the same natural language processing technology available across Google products like Android and Search, is rolling out now and will become available in English to all Google Analytics users over the next few weeks.
The ability to ask questions is part of Analytics Intelligence, a set of features in Google Analytics that use machine learning to help you better understand and act on your analytics data. Analytics Intelligence also includes existing machine learning capabilities like automated insights (now available on both web and the mobile app), smart lists, smart goals, and session quality.

How it Works
We've talked to web analysts who say they spend half their time answering basic analytics questions for other people in their organization. In fact, a recent report from Forrester found that 57% of marketers find it difficult to give their stakeholders in different functions access to their data and insights. Asking questions in Analytics Intelligence can help everyone get their answers directly in the product ― so team members get what they need faster, and analysts can spend their valuable time on deeper research and discovery.
Try it! This short video will give you a feel for how it works:
“Analytics Intelligence enables those users who aren’t too familiar with Google Analytics to access and make use of the data within their business’ account. Democratising data in this way can only be a good thing for everyone involved in Google Analytics!”
Joe Whitehead, Analytics Consultant, Merkle | Periscopix


Beyond answering your questions, Analytics Intelligence also surfaces new opportunities for you through automated insights, now available in the web interface as well as in the mobile app. These insights can show spikes or drops in metrics like revenue or session duration, tipping you off to issues that you may need to investigate further. Insights may also present opportunities to improve key metrics by following specific recommendations. For example, a chance to improve bounce rate by reducing a page's load time, or the potential to boost conversion rate by adding a new keyword to your AdWords campaign.

To ask questions and get automated insights from Analytics Intelligence in our web interface, click the Intelligence button to open a side panel. In the Google Analytics mobile app for Android and iOS, tap the Intelligence icon in the upper right-hand corner of most screens. Check out this article to learn more about the types of questions you can ask today.

Help us Learn
Our Intelligence system gets even smarter over time as it learns which questions and insights users are interested in. In that spirit, we need your help: After you ask questions or look at insights, please leave feedback at the bottom of the card.

Your answers will help us train Analytics Intelligence to be more useful.

Our goal is to help you get more insights to more people, faster. That way everyone can get to the good stuff: creating amazing experiences that make customers happier and help you grow your business.
Happy Analyzing!

MercadoLibre uses unique audience insights from Analytics 360 to raise ad RPMs by 60%

Washing machines and welding masks, comic books and baby strollers: just about everything is for sale on MercadoLibre. It's one of Latin America's biggest e-commerce sites, with 130 million registered users and an average of 4.6 purchases made every second of the day. What better place for an advertiser to reach a huge audience with sure-fire purchase intent?

To help their advertisers improve their programmatic direct campaigns, MercadoLibre used Google Analytics 360, part of the Google Analytics 360 Suite, to turn their first-party data into tailored audience segments.

"We want to help our advertisers do well," says Valeria Vinitski, Advertising Business Unit Director at MercadoLibre. "So we made use of our biggest media asset: our data. With over 150 million users, we have unique insights into the shopper journey. Integrating with DoubleClick for Publishers and Google Analytics 360 helped us create precise audience segments that are perfect for our clients' campaigns."

MercadoLibre started by creating audience segments for popular product lines like cell phones, cameras, and cars, and then made those Analytics 360 segments available to advertisers. Advertisers using DoubleClick Bid Manager could then negotiate the impression volumes they wanted at fixed CPMs for each of their priority segments.

With these Programmatic Guaranteed deals, advertisers are guaranteed reach and precision, as their ads are targeted to well-defined audiences that are more likely to buy their products. Ads can be tailored for each segment, boosting their effectiveness even more.

The results have been a win-win all around. The new campaigns have produced revenue per 1,000 sessions (RPMs) that are 60% higher than standard campaigns. Thanks to this new premium audience strategy, programmatic deals now account for 35% of MercadoLibre’s programmatic revenue.

MercadoLibre’s clients are also seeing great results. Magazine Luiza — one of the largest retailers in Brazil — found during a recent multi-publisher campaign that 23% of all its conversions could be attributed to MercadoLibre, and more than 25% of all revenue generated was from audiences exposed to the targeted Programmatic Guaranteed ads on MercadoLibre. The campaign drove a great deal of new customer acquisition for Magazine Luiza, with 40% of those new customers being first-time visitors.

"If we want to deliver better ad experiences, we need to use all our capabilities, data, and ad formats, no matter the sales channel," says Valeria. "Programmatic deals help us optimize our resources and save time while reaching marketing budgets from main brands that we otherwise wouldn't be able to gain."

Your site may not have 150 million users (yet), but whatever its size, Analytics 360 can help you boost revenues. Curious to learn more? See the full MercadoLibre story.

Why Your Testing and Optimization Team Needs a Data Storyteller

If a test happens on your website and nobody hears about it, does it make a sound?

Not to get too philosophical, but that's one of the big challenges of building a culture of growth and optimization: getting the word out. That's why a data storyteller is one of the key members of any testing team.

In fact, “communication and data storytelling” was noted as a critical skill for a person who leads testing and optimization efforts, according to a survey of marketing leaders who conduct tests and online experiments.1 The must-have skills rounding out the top three were leadership and, the obvious, analytics.


A data storyteller is part numbers-cruncher, part internal marketer, and part ace correspondent from the testing trenches. He or she is someone who can take the sheer data of testing — the stacks of numbers, the fractional wins and losses, the stream of daily choices — and turn it into a narrative that will excite the team, the office, and (especially) the C-suite.

Storytelling doesn't just mean bragging about successes. It can also mean sharing failures and other less-than-optimal outcomes. The point is not just to highlight wins: it's to reinforce a culture of growth, to generate interest in experimentation, and to explain why testing is so good for the company.

"Our test success rate is about 10%," says Jesse Nichols, Head of Growth for Nest. "We learn something from all our tests, but only one in 10 results in some kind of meaningful improvement." That means that a big part of the data storyteller's job is to keep people interested in testing and show them the value.

Watch our on-demand webinar “Test with success — even when you fail” to hear more testing and optimization tips.


If you're the data storyteller for your team, here are three points to remember:
  • Take the long view.  Gaining support for testing is like rolling a rock up a hill: slow going at first, but once you cross the summit the momentum will take over fast. It takes time, so lay the groundwork with lots of short reports. Don't wait to make formal presentations: Look for chances to drop your message into weekly wrap-ups and other group forums. In short, don’t be afraid to over-communicate. 
  • Be specific. It's better to present one great number than 10 so-so ones. Think mosaic rather than mural: Look for specific stories that can represent your larger efforts and broader plans. 
  • Keep your eye on the bottom line. In the end, that's what it's all about. You may be thrilled that a call-to-action change from "see more" to "learn more" increased clicks by .03%, but what will really get the CMO and other executives interested is moving the profit needle. As a litmus test, ask yourself, “So what?” If your story doesn’t clearly answer the question in terms the audience cares about, consider giving it a rewrite. 
And remember that it won't always be small victories. "The things you're so sure are going to work are the ones that go nowhere," says Jesse. "Then you do a throwaway test and it makes the company an extra $500,000." That's a story that everyone will want to hear.


Download our eBook How to Build a Culture of Growth to learn more best practices on testing and optimization.


1Source: Google Surveys, U.S., "Marketing Growth and Optimization," Base: 251 marketing executives who conduct A/B tests or online experiments, Oct. 2016.

Happy 1st Birthday, Google Analytics 360 Suite! It’s an insights party, everyone’s invited

Time flies (and data mounts) when you’re having fun with measurement. One year ago today, we announced our enterprise suite of marketing measurement and analytics solutions, the Google Analytics 360 Suite. Today we wanted to reflect on this first year. Because, well, a lot has changed. 


Where we started

As marketers know, in today’s mobile-first world, people expect more from brands. They want questions answered quickly, and they want a relevant, engaging experience.

That’s a tall order. So on March 15, 2016, we introduced the world to the Google Analytics 360 Suite, an enterprise measurement solution comprising analytics, tagging, site optimization, data visualization, attribution, and audience management. It helps marketers get more insights — not more data — and deliver more meaningful experiences to customers. Built from the ground up with modern technology and cross-product integrations, it does the heavy lifting for marketers.

Last fall, we welcomed Google Surveys 360 to the suite family, allowing marketers to gauge brand health, get user feedback on site experiences, and understand marketing impact with fast, reliable insights. A great addition to the 360 Suite, Surveys makes getting performance marketing insights and market research to better answer the “why” really easy.


It’s just the beginning: we’re on a journey together

This past year we’ve continued to check in with marketing decision-makers to see what challenges they still face in their data-driven transformations (so we know where to make product enhancements), and here’s what we’re hearing:

  • Building a culture of growth
    Leading marketers are embracing data and testing to continually improve the customer experience — or simply, make a website better — day by day. This growth mindset requires a willingness to experiment. And with that comes the challenge of getting comfortable with failure. Remember: There’s still a lot to be learned from (and celebrate in) a success rate of 1 in 10.
  • Dealing with data
    When we surveyed marketing decision-makers at the end of last year, 61% said they struggled to access or integrate the data they needed in 2016. And 26% of marketers said they didn't have the right analytics talent or enough of it.1 If marketers spend too much time wrangling with data, that means measurement is not always top of mind.
  • Measurement is sometimes an afterthought
    Only 5 out of 10 marketers said they think about measurement while developing campaign strategy.2 When data keeps pouring in, thinking about what campaign information you need to collect may be the last thing on your mind. But if you don't define your measurement goals from the beginning, you may not collect the right data to understand what's working and what isn't.

Big plans for the year ahead

Marketers who rethink measurement for a multi-screen world are reaping the benefits. In fact, leading marketers are 75% more likely than the mainstream to have moved to a more holistic model of measurement in the last two years, according to a recent study from Econsultancy and Google.3 But, getting a handle on all your data can take time. And that’s OK.

Google has some exciting product developments in the works that will help marketers automatically uncover insights and make smarter, faster decisions. In fact, we recently shared an Analytics 360 update that gives our customers the fastest access to the freshest first-party data we've ever offered.

The party’s just getting started. Stay tuned in for another exciting year.

Happy analyzing!

1 Google Surveys, U.S., "2016–2017 Marketing Analytics Challenges and Goals," Base: 203, marketing executives who have analytics or data-driven initiatives, Dec. 2016. 
2 Google Surveys, "Measurement in Campaign Timeline", Base: 1,092 marketing executives, U.S., August 2016. 
3 Econsultancy and Google, Analytics and Measurement Survey, 2016, Base: n=500 marketing and measurement executives at North American companies with over $250MM in revenues

Real-time just got real: Google Analytics 360 offers fresher insight

You’ve just launched a website or feature. Your toe is already tapping. Wait, wait, wait — you can hardly wait one hour to see exactly how it’s performing. Sound familiar? If you’ve been there, we have exciting news for you.

Google Analytics 360 can now provide updated insights as quickly as every 10 minutes. We’re proud to give our customers the fastest access to the freshest first party data Google Analytics has ever offered.

What did you just say?!
If you need to know how your sites, microsites, or digital engagements are doing right now, we’ve got you covered. Most first-party data in Analytics 360 can now be collected, processed, and available — via our UI, API, and BigQuery integration (coming soon) — in as fast as 10 minutes. This means you can move faster to:
  • Fix things when they’re broken
  • Detect trends and react when things are popular
  • Understand and take action on the impact of cultural events or social memes
To see how fresh the data is in your report at any time, just look for this icon in the upper right:
When you see this icon, it means you’re looking at today’s data and the report is supported and super fresh. Hover over the icon to see how fresh the data is!

This new level of freshness is only available to Analytics 360 users. To learn more about which reports, views, and properties support fresher data, and the factors affecting data freshness, check out our help center.

Some site owners just can’t wait
Brands and sites in the business of capitalizing on momentary consumer attention are excited about fresher insights. Take the case of publishers and retailers as an example.

Publishers strive to put the richest, most interesting content in front of users at any given point in time. The trick is understanding what’s rich and interesting right now — and that’s a constantly moving target.

Publishers have long referenced our real-time Google Analytics reports to make decisions, but sometimes they’re looking for deeper insight than what is provided in those reports. Fresher insights across additional Google Analytics reports help our publishers make even more informed content decisions, paving the way to better user acquisition, user engagement, and a stronger relationship between content consumer and publisher brand.

Online retailers are in the same boat. When celebrities wear a product or mention a brand on social media, product interest may spike. Retailers may have just minutes to capitalize on purchase intent before it wanes.

When a product’s popularity is on the rise, retailers can react by upping its prominence to capture interest, running focused promotions or recommending related products to expand consideration. With fresh insights available as soon as every 10 minutes, retailers move faster and turn trending interest into sales.

Speed is good, but safety comes first
As you know, Google Analytics has the ability to pull in data from other sources like AdWords and DoubleClick. We refer to these as “integration sources” and these sources operate with additional requirements, like fraud detection, that mean that the data in these reports are exempt from our enhanced freshness capabilities.

For example, any report with Ads data, including a dimension widened by an Ads integration, will continue to be made available within hours. For further details on which reports are supported or not supported, please read the help center article here.

A Love Story for the Ages: Marketing Commits to Measurement

Marketing and Measurement have been flirting for a long time now. But if these two finally get past the awkward stage and form a lasting bond, beautiful things can happen.

Working together, Marketing and Measurement can uncover insights that will improve your marketing, your customer experiences, and ultimately your business. To reach that next relationship level, Marketing can’t just casually date Measurement when it’s convenient. They need a real commitment.


The secret to a strong relationship
“For growth-driven marketers, measurement isn't an afterthought. It's one of the key reasons they’re succeeding and growing in an ever-changing, mobile-first world,” said Matt Lawson, Google's Director of Performance Ads Marketing.

Leading marketers are 75% more likely than the mainstream to have moved to a more holistic model of measurement in the last two years.1

When Marketing and Measurement “put a ring on it,” the future looks bright. Leading marketers are 75% more likely than the mainstream to have moved to a more holistic model of measurement in the last two years, according to a recent study from Econsultancy and Google. What’s more, the same study shows leading marketers were more than twice as likely to have significantly exceeded their top business goal in 2015.2

Don’t expect ‘happily ever after’
Engagement isn't where the story ends, of course.

Along the way, Marketing and Measurement may experience setbacks or failures as they test and learn from each other. In a recent survey of marketing decision makers with analytics initiatives, 61% of respondents said they struggled to access or integrate the data they needed last year.3

As with any relationship, Marketing and Measurement will need to “work on it.” And as this love story evolves, they will need to let go of traditional measurement practices and embrace a growth mindset that rethinks and remakes marketing measurement for the future.

If Marketing and Measurement are ready for a serious commitment at your company, here are three keys to a successful partnership:

  1. Collaborate to identify and measure what really matters to your business
  2. Communicate key insights uncovered from your data to help support decision making
  3. Take action to ensure those insights lead to better customer experiences


Download “Driving growth with marketing measurement in a mobile world,” a new report from Econsultancy and Google, for more best practices for marketing leaders.

1,2 Econsultancy and Google, Analytics and Measurement Survey, 2016, Base: n=500 marketing and measurement executives at North American companies with over $250MM in revenues 
3 Google Surveys, U.S., "2016–2017 Marketing Analytics Challenges and Goals," Base: 203, marketing executives who have analytics or data-driven initiatives, Dec. 2016.