Category Archives: Google Cloud Platform Blog

Product updates, customer stories, and tips and tricks on Google Cloud Platform

Better VM Rightsizing Recommendations with the Stackdriver Agent


We launched the VM Rightsizing Recommendations beta in July of 2016 and since then many users have taken advantage of it to achieve savings or more optimal machine shapes.
Until recently, Rightsizing Recommendations were based solely on the CPU and memory statistics visible to the Compute Engine virtual machine manager. This approach works well for CPUs that can be accurately monitored, but is fairly limited for memory. There, the challenge is that the virtual machine manager has no insight into how the guest operating system manages the memory and what part is allocated for processes and caches, etc. Without understanding what exactly is happening inside a VM instance, a recommendation can’t be tailored to the real memory usage.
Recommendations without visibility to how the accessed RAM is used
This is where the Stackdriver Agent comes in. When you install it on your VM instance, the Stackdriver Agent exports additional metrics to our monitoring system. These metrics allow the Rightsizing Recommendations system to accurately determine how much memory is allocated by processes vs. operating system caches and how much memory it freed up. This, in turn, allows us to calculate recommendations that more closely match the real workload.
Stackdriver Agent-based recommendations with a look through to the used RAM
Is there a real benefit to the user? Absolutely! When comparing RAM recommendations made with and without the Stackdriver Agent, we see that on average the Agent-based recommendations save 50% more memory, and in some cases, even more. The agent provides better visibility, giving the Rightsizing Recommendations system more and better data to work with, which results in tangible savings to users.

If you wish to get started with Stackdriver Agent-based recommendations, just install the agent on your VMs. The additional metrics will be automatically used for Rightsizing Recommendations and you don’t even need a Stackdriver account.

Manage your gRPC APIs with Google Cloud Endpoints


For the last two years, we at Google have put heavy investment in gRPC  in both the open source framework itself and in our own gRPC-based APIs. We see it as an essential component for microservices, but also for many public-facing APIs (especially those with low latency tolerance, the need for bi-directional streaming or heavy mobile use). And now, you can define and run a gRPC API and serve both gRPC and JSON-HTTP/1.1 to your clients using Google Cloud Endpoints!

Most of the APIs that we’ve released recently serve both a gRPC and an HTTP/1.1-JSON interface. Starting with Cloud Pub/Sub release in March 2016, we’ve announced a steady stream of APIs that use gRPC: Cloud Bigtable, Cloud Pub/Sub, Cloud Vision API, Cloud Datastore, Cloud Speech API and of course the recently announced Cloud Spanner API among others.

Serving a gRPC interface gives us the latency and bandwidth characteristics we need at scale and ensures all clients are using a compatible client library.

However, we still serve a JSON-HTTP/1.1 interface for these APIs. Why? Well, millions of developers are comfortable with JSON. It offers a really easy getting started experience (call it with curl, or just paste a request into any browser). There are great JSON libraries in every language available on essentially every platform. So even though the world is moving to gRPC for APIs that require streaming and high performance, supporting JSON-HTTP/1.1 remains a high priority.

Now you too can offer both gRPC and JSON-HTTP/1.1 for your APIs. Cloud Endpoints fully supports gRPC-based APIs (including all the same great Endpoints features it offers for HTTP/1.1 APIs: authentication, monitoring, logging, tracing, API keys, etc). And the Extensible Service Proxy will also translate JSON-HTTP/1.1 calls, so you can write your API once and serve both interfaces.

Getting started is simple. Define a gRPC service using a .proto file, then add a YAML config file to map that gRPC interface to REST JSON.

For example, you may have a simple service that defines a Bookshelf:
import "google/protobuf/empty.proto";

// A simple Bookstore API.
//
// The API manages shelves and books resources. Shelves contain books.
service Bookstore {
  // Returns a list of all shelves in the bookstore.
  rpc CreateShelf(CreateShelfRequest) returns (Shelf) {}
  // Returns a specific bookstore shelf.
  rpc GetShelf(GetShelfRequest) returns (Shelf) {}
}

// A shelf resource.
message Shelf {
  // A unique shelf id.
  int64 id = 1;
  // A theme of the shelf (fiction, poetry, etc).
  string theme = 2;
}

// Request message for CreateShelf method.
message CreateShelfRequest {
  // The shelf resource to create.
  Shelf shelf = 1;
}

// Request message for GetShelf method.
message GetShelfRequest {
  // The ID of the shelf resource to retrieve.
  int64 shelf = 1;
}

Your service configuration YAML tells Endpoints how to map that RPC interface to RESTful paths:

code>type: google.api.Service
config_version: 3

name: bookstore.endpoints..cloud.goog

title: Bookstore gRPC API
apis:
- name: endpoints.examples.bookstore.Bookstore


Http:
  rules:
  # 'CreateShelf' can be called using the POST HTTP verb and the '/shelves' URL
  # path. The posted HTTP body is the JSON respresentation of the 'shelf' field
  # of 'CreateShelfRequest' protobuf message.
  #
  # Client example:
  #   curl -d '{"theme":"Music"}' http://DOMAIN_NAME/v1/shelves
  #
  - selector: endpoints.examples.bookstore.Bookstore.CreateShelf
    post: /v1/shelves
    body: shelf
  #
  # 'GetShelf' is available via the GET HTTP verb and '/shelves/{shelf}' URL
  # path, where {shelf} is the value of the 'shelf' field of 'GetShelfRequest'
  # protobuf message.
  #
  # Client example - returns the first shelf:
  #   curl http://DOMAIN_NAME/v1/shelves/1
  #
  - selector: endpoints.examples.bookstore.Bookstore.GetShelf
    get: /v1/shelves/{shelf}

Your service configuration YAML can also specify authentication (for example, only permit a specified service account to call the API):

#
# Request authentication.
#
authentication:
  providers:
  - id: google_service_account
    # Replace SERVICE-ACCOUNT-ID with your service account's email address.
    issuer: SERVICE-ACCOUNT-ID
    jwks_uri: https://www.googleapis.com/robot/v1/metadata/x509/SERVICE-ACCOUNT-ID
  rules:
  # This auth rule will apply to all methods.
  - selector: "*"
    requirements:
      - provider_id: google_service_account

For full docs on how to create the transcoding mapping, see the docs at https://cloud.google.com/endpoints/docs/transcoding.

We have gRPC/Endpoints samples in four different languages: Python, Go, Java and Node.js. Better yet, we’ve got lots of customers using gRPC and Endpoints together already. So try the sample, head over to our Google Group to ask a question, and go make APIs!

NAB 2017: Rendering updates to GCP


Google Cloud Platform (GCP) is leading the way in cloud rendering solutions, and we're excited to make several announcements at the NAB 2017 show relating to our suite of solutions.

For our SaaS users, we've made several additions and price reductions to our Zync Render platform including:
  • Added rendering support for the popular Arnold Render for Cinema 4D. Arnold is a renderer used in countless feature film, advertising, VR and television projects and support in Cinema 4D allows Zync users to scale to tens of thousands of cores on demand when rendering a scene with Arnold.
  • We’ve also cut pricing for many Zync applications (Maya, Cinema 4D & Houdini) by up to 31%.
For our IaaS large studio customers who set up a custom rendering pipeline on GCP, we understand that establishing a secure connection to our platform is critical to ensure that sensitive pre-release content is protected at all times. We’ve worked with the leading Hollywood production studios to develop a Securing Rendering Workloads Solution that our customers can follow when building their rendering solution with us.

Going multi-cloud with Google Cloud Endpoints and AWS Lambda


A multi-cloud strategy can help organizations leverage strengths of different cloud providers and spread critical workloads. For example, maybe you have an existing application on AWS but want to use Google’s powerful APIs for Vision, Cloud Video Intelligence and Data Loss Prevention, or its big data and machine learning capabilities to analyze and derive insights from your data.

One pattern (among many) to integrate workloads on Google Cloud Platform (GCP) and Amazon Web Services (AWS) is to use Google Cloud Endpoints and AWS Lambda. The pattern has the following architecture.
Cloud Endpoints enables you to develop, deploy, protect and monitor APIs based on the OpenAPI specification. Further, the API for your application can run on backends such as App Engine, Google Container Engine or Compute Engine.

AWS Lambda can automatically run code in response to events in other AWS services. For example, you can configure an AWS Lambda function to fire when an object is added to an Amazon S3 bucket, when a notification comes into an Amazon SNS topic or to process records in a DynamoDB Stream.
In this blog, we'll create a Cloud Endpoints API and invoke it from an AWS Lambda function. You can download the complete source code for this sample from GitHub. Read on to learn how to implement this solution.

Setting up Cloud Endpoints

The first step toward implementing the solution is to deploy Cloud Endpoints APIs on App Engine flexible environment. GCP documentation contains excellent Quick Start topics with information to deploy APIs on App Engine flexible environment, Container Engine and more.

Create a GCP Project, if you don’t already have one:
  • Use the GCP Console to create a new GCP project and an App Engine application.
  • When prompted, select the region where you want to run your App Engine application located and then enable billing.
  • Note the ID of your project, because you'll need it later.
  • Activate Google Cloud Shell

Retrieving source code

In Google Cloud Shell:
This example uses Python to implement the API backend.

Implementing application code

Next, you’ll need to implement code for your API backend. The aeflex-endpoints example is a Flask application. The main.py file defines the application code that should be executed when the processmessage endpoint is invoked.

     @app.route('/processmessage', methods=['POST'])
     def process():
         """Process messages with information about S3 objects"""
         message = request.get_json().get('inputMessage', '')
         # add other processing as needed
         # for example, add event to PubSub or 
         # download object using presigned URL, save in Cloud Storage, invoke ML APIs
         return jsonify({'In app code for endpoint, received message': message})

Configuring and deploying the Cloud Endpoints API

Use the OpenAPI specification to define your API. In the aeflex-endpoints example, the openapi.yaml file contains the OpenAPI specification for the API. For more information about each field, see documentation about the Swagger object.

The openapi.yaml file declares that the host that will be serving the API.
     host: "echo-api.endpoints.aeflex-endpoints.cloud.goog"

The /processmessage endpoint is defined in the paths section. The inputMessage parameter contains the details about the Amazon S3 object to be processed.
paths:
      # This section configures the processmessage endpoint.
       "/processmessage":
         post:
           description: "Process the given message."
           operationId: "processmessage"
           produces:
           - "application/json"
           responses:
             200:
               description: "Return a success response"
               schema:
                 $ref: "#/definitions/successMessage"
           parameters:
           - description: "Message to process"
             in: body
             name: inputMessage
             required: true
             schema:
               $ref: "#/definitions/inputMessage"
           security:
           - api_key: []

     definitions:
       successMessage:
         properties:
           message:
             type: string
       inputMessage:
         # This section contains information about the S3 bucket and object to be processed.
         properties:
           Bucket: 
             type: string
           ObjectKey:
             type: string
           ContentType:
             type: string
           ContentLength:
             type: integer
           ETag:
             type: string
           PresignedUrl:
             type: string

Then, deploy the Open API specification:
     gcloud service-management deploy openapi.yaml

This command returns the following information about the deployed Open API specification:
     Service Configuration [2017-03-05r2] uploaded for service
     "echo-api.endpoints.aeflex-endpoints.cloud.goog"

Update the service configuration in the app.yaml file:
     endpoints_api_service:
       # The following values are to be replaced by information from the output of
       # 'gcloud service-management deploy openapi.yaml' command.
       name: echo-api.endpoints.aeflex-endpoints.cloud.goog
       config_id: 2017-03-05r2

Deploy the API:
     gcloud app deploy

Create an API Key to Authenticate Clients:

  • In the GCP Console, on the Products & services menu, click API Manager > Credentials.
  • Click Create Credentials > API key. Note the API key.


Setting up the AWS Lambda function


This section describes how to set up and trigger a Lambda function when a file is uploaded to an Amazon S3 bucket. In this example, the Lambda function is written in Python. The complete source code for the Lambda function is available in
blogs/endpointslambda/lambdafunctioninline.py.

Creating the S3 Bucket for your files

In the S3 Management Console in AWS, create an S3 bucket called images-bucket-rawdata. Your Lambda function will be triggered when files are added to this bucket.

Creating an IAM Role

In the IAM Management Console, create an IAM role that has the permissions for the Lambda function to access the S3 bucket, SQS queue and CloudWatch logs as follows:
  • In the IAM Management Console, click Roles in the navigation pane.
  • Create a new role called LambdaExecRole.
  • Select AWS Lambda Role Type, and then select the following policies:
    • AWSLambdaExecute: This policy gives the Lambda function Put and Get access to S3 and full access to CloudWatch Logs.
    • AmazonSQSFullAccess: This policy gives the Lambda function permissions to send messages to the dead-letter queue (DLQ).
  • Review the settings and create the role.

Creating an SQS queue

  • In the SQS Management Console, create an SQS queue called IntegrationDLQ that will act as the dead-letter queue for your Lambda function. AWS Lambda automatically retries failed executions for asynchronous invocations. In addition, you can configure Lambda to forward payloads that were not processed to a dead-letter queue.

Creating a Lambda function in the AWS Console

In the Lambda Management Console, create a Lambda function as follows:
  • In the Select blueprint page, use the s3-get-object-python blueprint.
  • In the Configure triggers page, specify the following:
    • Bucket: images-bucket-rawdata
    • Event-type: Object-Created (All)
  • Enable the trigger.
  • In the Configure Function page, specify the following:
    • Name: CallEndpoint
    • Runtime: Python 2.7
    • Code entry type: Edit code inline
    • Environment variable key: ENDPOINT_API_KEY
    • Environment variable: . Note: For production environments, consider securing the API key using encryption helpers in AWS.
    • Handler: lambda_function.lambda_handler
    • Role: Choose an existing role
    • Existing role: LambdaExecRole (that you created earlier)
    • In Advanced settings, DLQ resource: IntegrationDLQ
  • In the inline code editor for the Lambda function, replace the original code with the following code. The Lambda function retrieves the bucket and object information from the event, retrieves object metadata, generates a pre-signed url for the object, and finally invokes the Cloud Endpoints API.

    from __future__ import print_function
    
    import boto3
    import json
    import os
    import urllib
    import urllib2
    
    
    print('Loading function')
    
    s3 = boto3.client('s3')
    endpoint_api_key = os.environ['ENDPOINT_API_KEY']
    endpoint_url = "https://aeflex-endpoints.appspot.com/processmessage"
    
    def lambda_handler(event, context):
        #print("Received event: " + json.dumps(event, indent=2))
    
        # Get the object information from the event
        bucket = event['Records'][0]['s3']['bucket']['name']
        object_key = urllib.unquote_plus(event['Records'][0]['s3']['object']['key'].encode('utf8'))
        try:
            # Retrieve object metadata
            response = s3.head_object(Bucket=bucket, Key=object_key)
            # Generate pre-signed URL for object
            presigned_url = s3.generate_presigned_url('get_object', Params = {'Bucket': bucket, 'Key': object_key}, ExpiresIn = 3600)
            data = {"inputMessage": {
                        "Bucket": bucket,
                        "ObjectKey": object_key,
                        "ContentType": response['ContentType'],
                        "ContentLength": response['ContentLength'],
                        "ETag": response['ETag'],
                        "PresignedUrl": presigned_url
                }
            }
    
            headers = {"Content-Type": "application/json",
                        "x-api-key": endpoint_api_key
            }
            # Invoke Cloud Endpoints API
            request = urllib2.Request(endpoint_url, data = json.dumps(data), headers = headers)
            response = urllib2.urlopen(request)
            
            print('Response text: {} \nResponse status: {}'.format(response.read(), response.getcode()))
    
            return response.getcode()
        except Exception as e:
            print(e)
            print('Error integrating lambda function with endpoint for the object {} in bucket {}'.format(object_key, bucket))
            raise e
  • Review the Lambda function configuration and create the function.

Testing the integration

Now for the moment of truth! To test the integration between your AWS Lambda function and Cloud Endpoints API, follow the steps below:
  • In the AWS S3 Management Console, upload a file to images-bucket-rawdata.
  • In the Lambda Management Console, navigate to the CallEndpoint function, and view the Monitoring tab. The CloudWatch graphs show that the function was invoked successfully.
  • Click View Logs in CloudWatch and view the details for the function’s log stream. The log shows that the Lambda function received a success response code (200) from the API as well as details about the S3 event that the API received from the Lambda function.
You've now successfully integrated AWS Lambda with Cloud Endpoints to perform real-time processing of files uploaded to your S3 bucket! This is just one of the many patterns you can use to create a multi-cloud environment with GCP. Stay tuned for other examples down the road.

Solutions guide: How to secure rendering workloads on GCP


In the world of visual effects, security and content protection is on everyone's mind. Ensuring the security of intellectual property as it moves through your production pipeline is essential to being awarded jobs from major Hollywood studios. Data must be encrypted at all times, access to resources must be carefully controlled, and any changes must be logged, both on-premises and in the cloud.

Today, we're happy to present a best practices guide to Securing Rendering Workloads on Google Cloud Platform (GCP). This guide, coupled with Google Cloud’s security, core compliance and MPAA best practices, is aimed at visual effects facilities that need to pass security compliance audits. That said, any organization concerned with cloud security will benefit from its recommendations.

This document will evolve along with GCP's security features. We'll add and update content as we update and introduce products to help secure your data.

We hope you find this guide useful and concise. Please tell us what you think, and be sure to sign up for a trial at no cost to learn more about securing your workloads on the cloud.

Getting started with Cloud Identity-Aware Proxy


At Google Cloud Next '17, we announced the beta of Cloud Identity-Aware Proxy (Cloud IAP). Cloud IAP lets you control access to your web applications running on Google Cloud Platform (GCP). You can learn more about it and why it’s a simpler and more secure method than traditional perimeter-based access controls such as LANs and VPNs, in our previous post about Cloud IAP. In this post, we go into the internals of how Cloud IAP works and some of the engineering decisions we made in building it.

How does Cloud IAP work?

When a request comes into App Engine or Cloud Load Balancing HTTP(S), code inside the serving infrastructure for those products checks whether Cloud IAP is enabled for the App Engine app or Google Compute Engine backend service. If it is, the serving infrastructure calls out to the Cloud IAP auth server with some information about the protected resource, such as the GCP project number, the request URL and any Cloud IAP credentials present in the request headers or cookies.

If the request has valid credentials, the auth server can use those credentials to get the identity (email address and user ID) of the user. Using that identity information, the auth server calls Cloud Identity & Access Management (Cloud IAM) to check whether the user is authorized for the resource.

Authenticating with OpenID Connect

The credential that Cloud IAP relies on is an OpenID Connect (OIDC) token. That token can come from either a cookie (GCP_IAAP_AUTH_TOKEN1) or an Authorization: bearer header. To initiate the flow needed to get this token, Cloud IAP needs an OAuth2 client ID and secret. When you turn on Cloud IAP from Cloud Console, we silently create an OAuth2 client in your project and configure Cloud IAP to use it. If you use GCP APIs or the Cloud SDK to enable Cloud IAP, you’ll need to configure an OAuth2 client manually.

Anyone who interacts with a Cloud IAP-secured application from a web browser receives a cookie with their credentials. When the Cloud IAP auth server sees a request with missing or invalid credentials, it redirects the user into Google’s OpenID Connect flow. By using the OIDC flow, users get control over which applications can see their identity. The auth server handles the OAuth redirect and completes the OpenID Connect flow.

To protect against Cross-Site Request Forgery attacks, the auth server also generates a random nonce when redirecting the user into the OAuth flow. Auth server stores that nonce in a GCP_IAAP_XSRF_NONCE cookie, as well as signed with a key private to the auth server in the OAuth flow state parameter (along with the original URL requested by the user, also signed.) When processing an OAuth redirect, the auth server verifies the signature on the state parameter and checks that its nonce value matches the one from the cookie.

Robot parade

To support access from scripts and programs, the auth server also looks for an OIDC token in an Authorization header. The process to obtain an OIDC token given an OAuth2 access token or a service account private key is a bit complex; the IAP documentation provides sample code for authenticating from a service account or mobile app. If you want to know what’s going on behind the scenes there, or want to roll your own, the steps automated by that sample code are:
  1. Create a JWT with the following claims:
    1. aud: https://www.googleapis.com/oauth2/v4/token
    2. exp: Some time in the future.
    3. iat: The current time.
    4. iss: Your service account’s email address.
    5. target_audience: Either the base URL (protocol, domain and optional port; no path) or OAuth2 client ID for your Cloud IAP-protected application. (This controls the aud claim in the resulting OpenID Connect token. Cloud IAP validates this claim to prevent a token intended for use in one application from being used with another application.)
  2. If you have a service account private key, use it to sign the JWT. If you only have an access token, use the App Engine standard environment App Identity API or Cloud IAM signBlob API to sign it.
  3. POST it to the URL in the aud claim by Using OAuth 2.0 for Server to Server Applications.

Authorization with Cloud IAM

The Cloud IAP access list displayed in Cloud Console is really just part of your project’s Cloud IAM policy. You can use all standard Cloud IAM capabilities to manipulate it, including the IAM API and granting the Cloud IAP role at the folder and organization levels of the Cloud IAM hierarchy.

The role that grants access to Cloud IAP is roles/iap.httpsResourceAccessor. Unlike many other Cloud IAM roles, none of the broad roles like Owner or Editor grant the permissions associated with this role. This was done to better enable scenarios where security administrators are responsible for configuring the access policy, but they're not intended to use the application. (Yes, they can always grant themselves access, but this way it’s something they have to go out of their way to do. If application owners got access automatically, they might unintentionally access the application.)

Propagating identity

Many applications protected by Cloud IAP will want to know the user’s identity, either to perform additional access control or as part of a user preferences system. Cloud IAP provides a few ways to do this. Two of them are straightforward:
  1. For applications using the Google App Engine standard environment, Cloud IAP supports the App Engine Users API. Existing code using this API typically works with no modifications, and Cloud IAP even uses the same user IDs as Users API.
  2. Cloud IAP sends the user’s email address and ID in two HTTP headers.
The third way requires a few additional steps to ensure maximum security for your application. For applications that can’t use the Users API and so have to go with option 2, relying on unauthenticated HTTP headers is a security risk2. If you accidentally disable Cloud IAP, anyone could potentially connect to your application and set those headers to arbitrary values! If your application runs on Compute Engine or Google Container Engine, anyone who can connect directly to a VM running your application could then bypass Cloud IAP and set those headers to whatever they want. As discussed earlier, Cloud IAP access control is enforced inside the HTTP(S) load balancer, so if someone can bypass the load balancer, they can bypass Cloud IAP! This could happen if you’ve misconfigured your firewall rules, or because the attacker was able to SSH into the instance or another instance on the network.

So, Cloud IAP provides a third HTTP header, which contains a JSON Web Token (JWT) signed with a Cloud IAP private key. This JWT closely resembles the OpenID Connect token, but it’s signed by Cloud IAP instead of by the Google account service. We considered just passing through the OpenID Connect token that Cloud IAP used to authenticate the user, but by minting our own token, we’re free to add additional methods for users to authenticate to Cloud IAP in the future.

We hope this provides you a solid understanding of how Cloud IAP works behind the scenes, as well as some of the simplicity it offers. Spend a few minutes reading the IAP quickstarts to learn how to use it, and stay tuned for a steady stream of security and identity content.


1 Yes, there’s an extra A.
2 The Users API, on the other hand, is safe. Cloud IAP uses a protected internal channel to set the identity information consumed by this API.

220,000 cores and counting: MIT math professor breaks record for largest ever Compute Engine job


An MIT math professor recently broke the record for the largest ever Compute Engine cluster, with 220,000 cores on Preemptible VMs, the largest known high-performance computing cluster to ever run in the public cloud.

Andrew V. Sutherland is a computational number theorist and Principal Research Scientist at MIT, and is using Compute Engine to explore generalizations of the Sato-Tate Conjecture and the conjecture of Birch and Swinnerton-Dyer to curves of higher genus. In his latest run, he explored 1017 hyperelliptic curves of genus 3 in an effort to find curves whose L-functions can be easily computed, and which have potentially interesting Sato-Tate distributions. This yielded about 70,000 curves of interest, each of which will eventually have its own entry in the L-functions and Modular Forms Database (LMFDB).


Finding suitable genus 3 curves “is like searching for a needle in a fifteen-dimensional haystack,” Sutherland said. “Sometimes I like to describe my work as building telescopes for mathematicians.”

It also requires a lot of compute cycles: For each curve that's examined, its discriminant must be computed; the discriminant of a curve serves as an upper bound on the complexity of computing its L-function. This task is trivial in genus 1, but in genus 3 may involve evaluating a 50 million term polynomial in 15 variables. Each curve that's a candidate for inclusion in the LMFDB must also have many other of its arithmetic and geometric invariants computed, including an approximation of its L-function and Sato-Tate distribution, as well as information about any symmetries it may possess. The results can be quite large, and some of this information is stored as Cloud Storage nearline objects. Researchers can browse summaries of the results on the curve’s home page in the LMFDB, or download more detailed information to their own computer for further examination. The LMFDB provides an online interface to some 400 gigabytes of metadata housed in a MongoDB database that also runs on Compute Engine.

Sutherland began using Compute Engine in 2015. For his first-ever job, he fired up 2,250 32-core instances and completed about 60 CPU-years of computation in a single afternoon.

Before settling on Compute Engine, Sutherland ran jobs on his own 64-core machine, which could take months, or wrangled for compute time on one of MIT’s clusters. But getting the number of cores he needed often raised eyebrows, and he was limited by the software configurations he could use. By running on Compute Engine, Sutherland can install exactly the operating system, libraries and applications he needs, and thanks to root access, he can update his environment at will.

Sutherland considered running his jobs on AWS before choosing Google but was dissuaded by its Spot Instances model, which forces you to name your price up front, with prices that can vary significantly by region and fluctuate over time. A colleague encouraged him to try Compute Engine Preemptible VMs. These are full-featured instances that are priced up to 80% less than regular equivalents, but can be interrupted by Compute Engine. That was fine with Sutherland. His computations are embarrassingly parallel 
 they can be easily separated into multiple, independent tasks  and he grabs available instances across any and all Google Cloud Regions. An average of about 2-3% of his instances are typically preempted in any given hour, but a simple script automatically restarts them as needed until the whole job is complete.

To coordinate the instances working on a job, Sutherland uses a combination of Cloud Storage and Datastore. He used the python client API to implement a simple ticketing system in Datastore that assigns tasks to instances. Instances periodically checkpoint their progress on their local disks from which they can recover if preempted, and they store their final output data in a Cloud Storage bucket, where it may undergo further post-processing once the job has finished.

All told, having access to the scale and flexibility of Compute Engine has freed Sutherland up to think much bigger with his research. For his next run, he hopes to expand his search to non-hyperelliptic curves of genus 3, breaking his own record with a 400,000-core cluster. “It changes your whole outlook on research when you can ask a question and get an answer in hours rather than months,” he said. “You ask different questions.”

Distributed tracing for Go


The Go programming language has emerged as a popular choice for building distributed systems and microservices. But troubleshooting Go-based microservices can be tough if you don’t have the right tooling. Here at Google Cloud, we’re big fans of Go, and we recently added a native Go client library to Stackdriver Trace, our distributed tracing backend to help you unearth (and resolve) difficult performance problems for any Go application, whether it runs on Google Cloud Platform (GCP) or some other cloud.

The case for distributed tracing

Suppose you're trying to troubleshoot a latency problem for a specific page. Suppose your system is made of many independent services and the data on the page is generated through many downstream services. You have no idea which of those services are causing the slowdown. You have no clear understanding of whether it’s a bug, an integration issue, a bottleneck due to poor choice of architecture or poor networking performance.

Solving this problem becomes even more difficult if your services are running as separate processes in a distributed system. We cannot depend on the traditional approaches that help us diagnose monolithic systems. We need to have finer-grained visibility into what’s going on inside each service and how they interact with one another over the lifetime of a user request.

In monolithic systems, it's relatively easy to collect diagnostic data from the building blocks of a program. All modules live within one process and share common resources to report logs, errors and other diagnostics information. Once your system grows beyond a single process and starts to become distributed, it becomes harder to follow a call starting from the front-end web server to all of its back-ends until a response is returned back to the user.
To address this problem, Google developed the distributed tracing system Dapper to instrument and analyze its production services. The Dapper paper has inspired many open source projects, such as Zipkin, and Dapper-style tracing has emerged as an industry-wide standard.

Distributed tracing enabled us to:
  • Instrument and profile application latency in a large system.
  • Track all RPCs within the lifecycle of a user request and see integration issues that are only visible in production.
  • Figure out performance improvements that can be applied to our systems. Many bottlenecks are not obvious before the collection of tracing data.

Tracing concepts

Tracing works on the basic principle of propagating tracing data between services. Each service annotates the trace with additional data and passes the tracing header to other services until the user request is served. Services are responsible for uploading their traces to a tracing backend. Then, the tracing backend puts related latency data together like the pieces of a puzzle. Tracing backends also provide UIs to analyze and visualize traces.

In Dapper-style tracing, each trace is a call tree, beginning with the entry point of a user request and ending with the server’s response, including all RPCs along the way. Each trace consists of small units called spans.
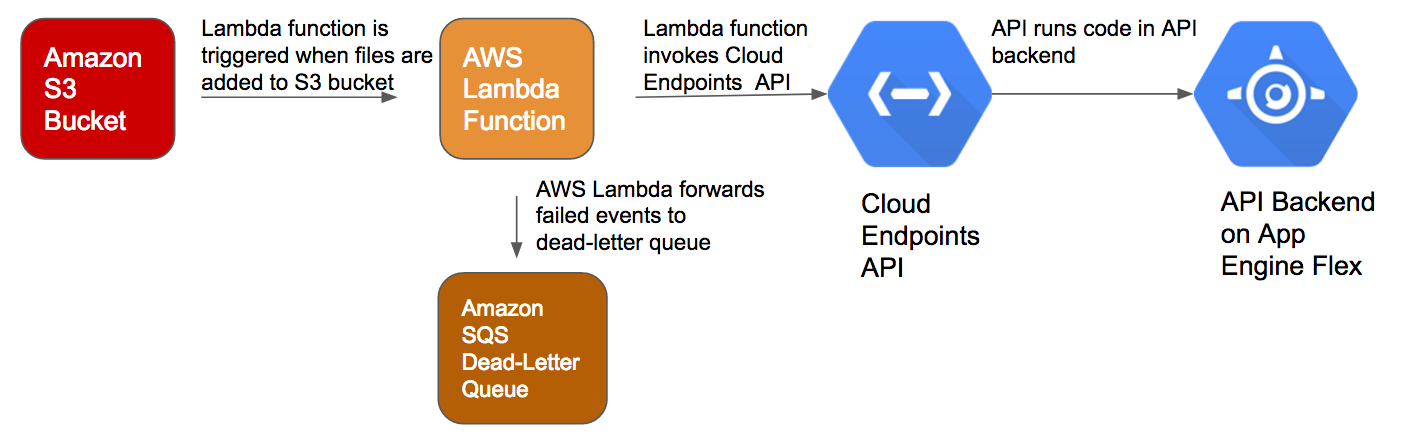
Above, you see a trace tree for a TaskQueue.Stats request. Each row is labelled with the span name. Before the system can serve TaskQueue.Stats, five other RPCs have been made to other services. First, TaskQueue.Auth checks if we're authorized for the request. Then, QueueService is queried for two reports. In the meantime, System.Stats is retrieved from another service. Once reports and system stats are retrieved, the Graphiz service renders a graph. In total, TaskQueue.Stats returns in 581 ms, and we have a good picture of what has happened internally to serve this call. By looking at this trace, maybe we'll learn that rendering is taking more time than we expect.

Each span name should be carefully chosen to represent the work it does. For example, TaskQueue.Stats is easily identified within the system and, as its name implies, reads stats from the TaskQueue service.

Spans can start new spans where a span depends on other spans to be completed. These spans are visualized as children spans of their starter span in a trace tree.

Spans can also be annotated with labels to convey more fine-grained information about a specific request. Request ID, user IDs and RPC parameters are good examples of labels commonly attached to traces. Choose labels by determining what else you want to see in a particular trace tree and what you would like to query from the collected data.

Working with Stackdriver Trace

One of the exciting things about GCP is that customers can use the same services and tools we use daily at Google-scale. We launched Stackdriver Trace to provide a distributing tracing backend for our customers. Stackdriver Trace collects latency data from your applications, lists and visualizes it on Cloud Console, and allows you to analyze your application’s latency profile. Your code doesn’t have to run on GCP to use Stackdriver Trace  we can upload your trace data to our backends even if your production environment doesn’t run on our cloud.

To collect latency data, we recently released the cloud.google.com/go/trace package for Go programmers to instrument their code with marking spans and annotations. Please note that the trace package is still in alpha and we're looking forward to improving it over time. At this stage, please feel free to file bugs and feature requests.

To run this sample, you’ll need Google Application Default Credentials. First, use the gcloud command line tool to get application default credentials if you haven’t already.

Then, import the trace package:
import "cloud.google.com/go/trace"

Create a new trace client with your project ID:
traceClient, err = trace.NewClient(ctx, "project-id")
if err != nil {
 log.Fatal(err)
}

We recommend you have a long-living trace.Client instance. You can create a client once and keep using it until your program terminates.

The sample program makes an outgoing HTTP request. In this example, we attach tracing information to the outgoing HTTP request so that the trace can be propagated to the destination server:
func fetchUsers() ([]*User, error) {
 span := traceClient.NewSpan("/users")
 defer span.Finish()

 // Create the outgoing request, a GET to the users endpoint.
 req, _ := http.NewRequest("GET", "https://userservice.corp/users", nil)

 // Create a new child span to identify the outgoing request,
 // and attach tracing information to the request.
 rspan := span.NewRemoteChild(req)
 defer rspan.Finish()

 res, err := http.DefaultClient.Do(req)
 if err != nil {
  return nil, err
 }

 // Read the body, unmarshal, and return a slice of users.
 // ...
}

The User service extracts the tracing information from the incoming request, and creates and annotates any additional child spans. In this way, the trace of a single request can be propagated between many different systems:

func usersHandler(w http.ResponseWriter, r *http.Request) {
 span := traceClient.SpanFromRequest(r)
 defer span.Finish()

 req, _ := http.NewRequest("GET", "https://meta.service/info", nil)
 child := span.NewRemoteChild(req)
 defer child.Finish()

 // Make the request…
}

Alternatively, you can also use the HTTP utilities to easily add tracing context to outgoing requests via HTTPClient, and extract the spans from incoming requests with HTTPHandler.

var tc *trace.Client // initiate the client
req, _ := http.NewRequest("GET", "https://userservice.corp/users", nil)

res, err := tc.NewHTTPClient(nil).Do(req)
if err != nil {
 // TODO: Handle error.
}

And on the receiving side, you can use our handler wrapper to access the span via the incoming request’s context:

handler := http.HandlerFunc(func(w http.ResponseWriter, r *http.Request) {
    span := trace.FromContext(r.Context())
    // TODO: Use the span.
})
http.Handle("/foo", tc.HTTPHandler(handler))

A similar utility to enable auto-tracing is also available for gRPC Go clients and servers.

Please note that not all services need to be written in Go  propagation works across all services written in other languages as long as they rely on the Stackdriver header format to propagate the tracing context. See the Stackdriver Trace docs to learn about the header format.


Future work

Even though we currently provide a solution for GCP, our goal is to contribute to the Go ecosystem beyond GCP. There are many groups working on tracing for Go, and there's a lot of work to do to ensure it's aligned. We look forward to working with these groups to make tracing accessible and easy for Go programmers.

One particular problem we want to solve is enabling third-party library authors to provide out-of-the-box tracing without depending on a particular tracing backend. Then, open-source library developers can instrument their code by marking spans and annotating them to be traced by the user's choice of tracing backend. We also want to work on reusable utilities to automatically enable tracing anywhere without requiring Go programmers to significantly modify their code.

We're currently working with a large group of industry experts and examining already-established solutions to understand their requirements and provide a solution that will foster our integrations with tracing backends. With these first-class building blocks and utilities, we believe distributed tracing can be a core and accessible tool to diagnose Go production systems.

Guest post: Supercharging container pipelines with Codefresh and Google Cloud


[Editor’s note: Today we hear from Codefresh, which makes a Docker-native continuous integration/continuous delivery (CI/CD) platform. Read on to learn how Codefresh’s recent integrations with Kubernetes and Google Container Registry will make it easier for you to build, test and deploy your cloud-native applications to Google Cloud, including Container Engine and Kubernetes.]

Traditional pipelines weren’t designed with containers and cloud services in mind. At Codefresh, we’ve built our platform specifically around Docker and cloud services to simplify the entire pipeline and make it easier to build, test and deploy web apps. We recently partnered with Google Cloud to add two key features into our platform: an embedded registry (powered by Google’s own Container Registry) and one-click deploy to Google Container Engine.

Advantages of an embedded registry

Codefresh’s embedded registry doesn’t replace production registries but rather provides a developer-focused registry for testing and development. The production registry becomes a single source of truth for production grade images, while Codefresh’s embedded registry maintains the images needed for development.

This approach has a couple of other big advantages:
  • Image quality control is higher since it’s built right into the test flow
  • Build-assist images (for example, those used with Java and other compiled languages) stay nicely organized in the dev space
  • Codefresh extends the images with valuable metadata (e.g., test results, commit info, build SHA, logs, issue id, etc.), creating a sandbox-like registry for developers
  • Build speed is faster since the embedded registry is "closer" to the build machines
The embedded registry also allows developers to call images by tag and extended metadata from the build flow. For example, if you want to test a service based on how it works with different versions of another service, you can reference images based on their git commit ID (build SHA).

To try out the embedded registry, you’ll need to join the beta.

One-click deploy to Kubernetes

We manage the Codefresh production environment with Kubernetes running on Container Engine. Because we use Codefresh to build, test and deploy Codefresh itself, we wanted to make sure there was a simple way to deploy to Kubernetes. To do that, we’re adding Kubernetes deployment images to Codefresh, available both in the UI and Codefresh YAML. The deploy images contain a number of scripts that make pushing new images a simple matter of passing credentials. This makes it easy to automate the deployments, and when paired with branch permissions, makes it easy for anyone authorized to approve and push code to production.

To try this feature in Codefresh, just select the deploy script in the pipeline editor and add the needed build arguments. For more information checkout our documentation on deploying to Kubernetes.

Or add this code to your Codefresh.yml

deploy-to-kubernetes-staging:
    image: codefreshio/kubernetes-deployer:master
    tag: latest
    working-directory: ${{initial-clone}}
commands:
      - /deploy/bin/deploy.sh ./root
    environment:
      - ENVIRONMENT=${{ENVIRONMENT}}
      - KUBERNETES_USER=${{KUBERNETES_USER}}
      - KUBERNETES_PASSWORD=${{KUBERNETES_PASSWORD}}
      - KUBERNETES_SERVER=${{KUBERNETES_SERVER}}
      - DOCKER_IMAGE_TAG=${{CF_REVISION}}

Migrating to Google Cloud’s Container Engine

For those migrating to Container Engine or another Kubernetes environment, the Codefresh deploy images simplify everything. Pushing to Kubernetes is cloud agnostic  just point it at your Kubernetes deployment, and you’re good to go.

About Codefresh, CI/CD for Docker

Codefresh is CI for Docker used by open source and business. We automatically deploy and scale build and test infrastructure for each Docker image. We also deploy shareable environments for every code branch. Check it out https://codefresh.io/ and join the embedded registry beta.

Cloud Speech API is now generally available


Last summer, we launched an open beta for Cloud Speech API, our Automatic Speech Recognition (ASR) service. Since then, we’ve had thousands of customers help us improve the quality of service, and we’re proud to announce that as of today Cloud Speech API is now generally available.

Cloud Speech API is built on the core technology that powers speech recognition for other Google products (e.g., Google Search, Google Now, Google Assistant), but has been adapted to better fit the needs of Google Cloud customers. Cloud Speech API is one of several pre-trained machine-learning models available for common tasks like video analysis, image analysis, text analysis and dynamic translation.

With great feedback from customers and partners, we're happy to share that we have new features and performance to announce:
  • Improved transcription accuracy for long-form audio
  • Faster processing, typically 3x faster than the prior version for batch scenarios
  • Expanded file format support, now including WAV, Opus and Speex

Among early adopters of Cloud Speech API, we have seen two main use cases emerge: speech as a control method for applications and devices like voice search, voice commands and Interactive Voice Response (IVR); and also in speech analytics. Speech analytics opens up a hugely interesting set of capabilities around difficult problems e.g., real-time insights from call centers.

Houston, Texas based InteractiveTel is using Cloud Speech API in solutions that track, monitor and report on dealer-customer interactions by telephone.
“Google Cloud Speech API performs highly accurate speech-to-text transcription in near-real-time. The higher accuracy rates mean we can help dealers get the most out of phone interactions with their customers and increase sales.” — Gary Graves, CTO and Co-Founder, InterActiveTel
Saitama, Japan-based Clarion uses Cloud Speech API to power its in-car navigation and entertainment systems.
“Clarion is a world-leader in safe and smart technology. That’s why we work with Google. With high-quality speech recognition across more than 80 languages, the Cloud Speech API combined with the Google Places API helps our drivers get to their destinations safely.” — Hirohisa Miyazawa, Senior Manager/Chief Manager, Smart Cockpit Strategy Office, Clarion Co., Ltd.
Cloud Speech API is available today. Please click here to learn more.