Category Archives: Google Cloud Platform Blog

Product updates, customer stories, and tips and tricks on Google Cloud Platform

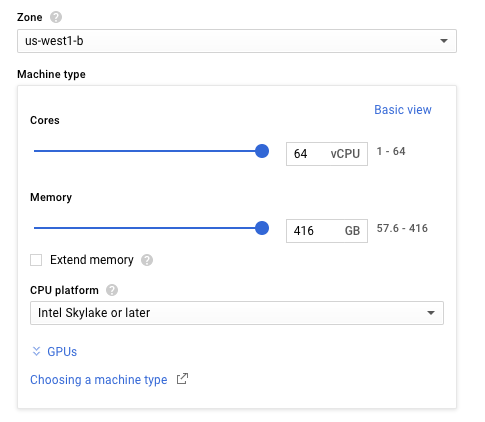
Compute Engine updates bring Skylake GA, extended memory and more VM flexibility


We’re pleased to announce several updates to Google Compute Engine that give you more powerful and flexible instances. Google Cloud is the first and only public cloud to deliver Intel’s next-generation Xeon server processor (codenamed Skylake), and starting today, it’s generally available (GA). In addition, we’ve made several other enhancements to Compute Engine:
  • Increased total amount of memory per instance by removing memory caps
  • Increased variety of machine shapes
  • Simple process to select a baseline processor type
  • Availability of 64-core processors in all regions
  • Broadwell CPUs available in all regions
These improvements help you get the performance from Compute Engine that you need, in the configuration you want.

Skylake is generally available

With up to 64 vCPUs and 455GB of RAM, Skylake-based instances support a wide range of compute-intensive workloads, including scientific modeling, genomic research, 3D rendering, data analytics and engineering simulations. Since we first launched Skylake for Compute Engine in February, GCP customers have run millions of hours of compute on Skylake VMs, seeing increased performance for a variety of applications.

With this GA release, you can create new VMs with Skylake across Compute Engine’s complete family of VM instance types  standard, highmem, highcpu, Custom Machine Types, as well as Preemptible VMs. You can provision Skylake VMs using Cloud Console, the gcloud command line tool, or our APIs. Skylake is available in three GCP regions: Western US, Western Europe and Eastern Asia Pacific. Customer demand for Skylake has been very strong; we have more capacity arriving every day, and support for additional regions and zones coming in the near future.

To help you experience Skylake, we're offering Skylake VMs at no additional cost for a limited time. After a 60-day promotional period, Skylake VMs will be priced at a 6-10% premium depending on the specific machine configuration. Given the significant performance increase over previous generations of Intel processors, this continues our record of providing a leading price-performance cloud computing platform.

CPU platform selector

Google Cloud Platform (GCP) regions and zones are equipped with a diverse set of Intel Xeon-based host machines, with CPUs including Sandy Bridge, Ivy Bridge, Haswell, Broadwell and now Skylake microarchitectures. In addition to fundamental systems features like clock speed and memory access time, these CPU platforms also support unique features like AVX-2 and AVX-512.

Now, with our Minimum CPU Platform feature, you can select a specific CPU platform for VMs in that zone, and Compute Engine will always schedule your VM to that CPU family or above. You can assign a minimum CPU platform to a VM from the Cloud Console, Google Cloud SDK, or API, with full flexibility to choose the CPU features that work best for your applications.

Enabling this enhanced flexibility also allows us to now offer Broadwell CPU support in every region, as well as the ability to create VMs up to 64 vCPUs in size.
In the gcloud command line tool, use the instances create subcommand, followed by the --min-cpu-platform flag to specify a minimum CPU platform.

For example, the following command creates an n1-standard-1 instance with the Intel Broadwell (or later) CPU platform.

gcloud beta compute instances create example-instance --machine-type 
n1-standard-1 --min-cpu-platform “Intel Broadwell”

To see which CPUs are available in different GCP zones, check our Available Regions and Zones page. For complete instructions for using --min-cpu-platform, please refer to our documentation.

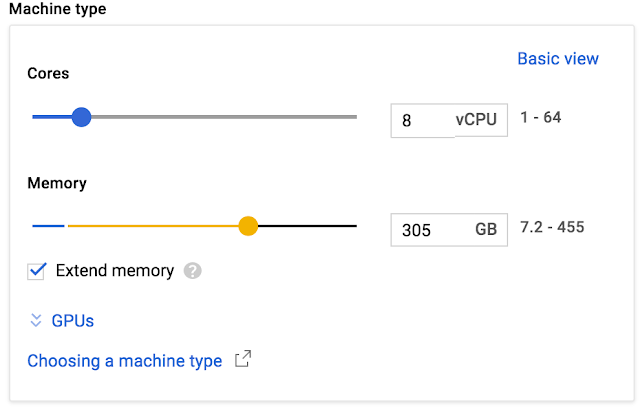
Extended memory, where you want it

Compute Engine Custom Machine Types allow you to create virtual machines with the vCPU and memory ratios to fit your application needs. Now, with extended memory, we’ve removed memory ratio restrictions for a vCPU (previously set at 6.5GB), for a maximum of 455GB of memory per VM instance. This is great news for applications like in-memory databases (e.g. Memcached & Redis), high-performance relational databases (e.g. Microsoft SQL Server) and NoSQL databases (e.g. MongoDB) that benefit from flexible memory configurations to achieve optimum price-performance. To learn more about the pricing for extended memory please take a look at our pricing page.

You can create a VM with extended memory using the Cloud Console, Cloud SDK or APIs.


For example, this command creates a 2 vCPU, 15GB memory instance (including an extended memory of 2GB):

gcloud beta compute instances create example-instance 
--custom-cpu 2 --custom-memory 15 --custom-extensions

Complete instructions for using extended memory are available in our documentation.

Get started today

The minimum CPU platform selector, extended memory to 455GB, availability of 64-core machines, Broadwell processors in all regions and the GA of Skylake processors are now all available for you and your applications. If you’re new to GCP you can try all of this out when you sign up for $300 free trial. We’d love to hear about the amazing things you do with these Compute Engine enhancements in the comments below.

Oregon region (us-west1) adds third zone, Cloud SQL and Regional Managed Instance Groups


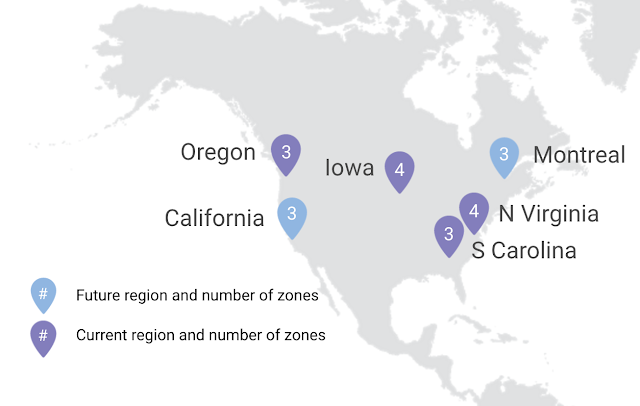
Last summer we launched the Oregon region (us-west1) with two zones and a number of Google Cloud Platform (GCP) services. The region quickly became popular with developers looking to place applications close to users along the west coast of North America.
Today we’re opening a third zone in Oregon (us-west1-c) and two additional services: Cloud SQL and Regional Managed Instance Groups (MIGs). Cloud SQL is a fully managed service supporting relational PostgreSQL BETA and MySQL databases in the cloud. Regional MIGs make it easy to improve application availability by spreading virtual machine instances across three zones.

All three zones in Oregon (us-west1) contain the following services:
  • Compute Engine
  • Container Engine
  • Dataflow
  • Dataproc
  • Datalab

As with all GCP zones, the following services are available to support compute workloads:
In addition to Oregon, we'll soon be opening new regions in North America in Montreal and California. Our locations page provides the latest updates to GCP regions, zones and the services available in each. Give us a shout to request early access to new regions and help us prioritize what we build for you next.


RailsConf 2017: a round-up


A few weeks ago the Google Cloud Ruby team attended RailsConf in Phoenix, Arizona. RailsConf is one of the largest conferences for Ruby programmers in the world and we were happy to spend three days learning and sharing with our community. We enjoyed hearing from folks that are currently using Google Cloud Platform (GCP) and we're working diligently to integrate their feedback into our future products.

About half of our team had never attended a Ruby conference before. Luckily they were in good company since about half of the attendees at the event were new to Ruby, conferences, tech, or all of the above.

All of us enjoyed the keynotes including Rails core contributor Aaron Patterson's crap data joke and Rails creator DHH's discussion of how community values are reflected in programming languages and frameworks. He used Python and Ruby as his examples and showed how while they both share some values like "Readability Counts" they also differ on values like whether there should only be one way to do something.

Daniel Azuma, an engineer on the Google Ruby team, gave a talk titled "What’s my app *really* doing in production?" With so many new Rubyists at the conference this was a fine opportunity to teach people about some of the tools for debugging and profiling that are built in to Ruby and Rails. Among other things, he discussed how you can use ActiveSupport::Notifications to get more information when specific methods are called.

Remi Taylor, another engineer on the Google Ruby team, gave a talk called "Google Cloud <3 Ruby" showing off the new features GCP has for Rubyists. I gave a talk called "Syntax Isn't Everything: NLP for Rubyists” which showed off Google’s Cloud Natural Language API. Both of our talks generated interest in Google's Machine Learning APIs and dozens of people tried out the Cloud Vision codelab back at our booth. In the past, Rubyists haven't been interested in machine learning so it was great to see all the excitement.

At our booth we had great conversations with both new and veteran Rubyists. Many people took advantage of our codelabs to try out Google Cloud with Ruby while there was someone to help available. It was also a chance to have one-on-one conversations with developers from all over the world. Many of the people who stopped by are trying or using Kubernetes for their Rails apps. Others are using App Engine, Cloud Storage or other Google products. This was my third RailsConf since I started at Google, and I'm happy to see that more and more community members are trying Google Cloud products and giving us feedback so we can continue our goal of creating tools that feel good to Rubyists and help them build and run amazing applications.

Cloud Source Repositories: now GA and free for up to five users and 50GB of storage


Developers creating applications for App Engine and Compute Engine have long had access to Cloud Source Repositories (CSR), our hosted Git version control system. We’ve taken your feedback to get it ready for the enterprise, and are excited to announce that it's leaving beta and is now generally available.

The new CSR includes a number of changes. First off, we’ve increased the supported repository size from 1GB to 50GB, which should give your team plenty of room for large projects.

Second, CSR has a new pricing model, complete with a robust free tier that should allow many of you to use it at no cost. Customers can use CSR associated with their billing accounts for free each month, provided that the repos meet the following criteria:
  • Up to five project-users accessing repositories
  • Source repos consume less than 50GB in storage
  • Access to repos uses less than 50GB of network egress bandwidth
Beyond that, pricing for CSR is $1/project-user/month (where a project-user represents each user working on each project) plus $0.10/GB/month for storage and $0.10/GB for network egress. Network ingress is offered at no cost and you can still create an unlimited number of repositories.

For further details, visit the Cloud Source Repositories pricing page.

Getting started with Cloud Source Repositories

To get started with CSR, go to https://console.cloud.google.com/code/ or choose Source Repositories from the Cloud Console menu:

Creating a CSR repo is as easy as pressing the "Get started" button in the Cloud Console and providing a name:
Or if you prefer, you can create a new repo from the gcloud command line tool, either from your local shell (make sure to execute “gcloud init” first) or from the Cloud Shell:
Once you’ve created your repo, browse it from the Source Repositories section of the Cloud Console or clone it to your local machine (making sure you’ve executed “gcloud init” first) or into the Cloud Shell:
Or, if you’re using Cloud Tools for IntelliJ (and soon our other IDE extensions), you can access your CSR repos directly from inside your favorite IDE:
As you’d expect, you can use standard git tooling to commit changes and otherwise manage your new repos. Or, if you’ve already got your source code hosted on GitHub or BitBucket, you can mirror your existing repo into your GCP project, like so
Once you’ve created your repos, manage them with the Repositories section in the Cloud Console:
If you prefer using command line tools, there’s a full set of CLI commands available:
You’ll also notice the reference to Permissions in the Cloud Console and IAM policies at the command line; that’s because IAM roles are fully-supported in CSR and can be applied at any level in the resource hierarchy.

And as if all of that weren’t enough, there’s a CSR management API as well, which is what we use ourselves to implement the gcloud CSR commands. If you’d like to get a feel for it, you can access the CSR API interactively in the Cloud API Explorer:

Full documentation for the CSR API is available for your programming pleasure.

Where are we?

Like our Cloud Shell and it’s new code editor, the new CSR represents a larger push toward web-based experience for GCP developers. We’re thrilled with the feedback we’ve already gotten and look forward to hearing how you’re using CSR in your developer workflow.

If you’ve got questions about Cloud Source Repositories, feel free to drop them onto StackOverflow. If you’ve got feedback or suggestions, feel free to join in the discussion on Google Groups or Slack.

Istio: a modern approach to developing and managing microservices


Today Google, IBM and Lyft announced the alpha release of Istio: a new open-source project that provides a uniform way to help connect, secure, manage and monitor microservices.

Istio encapsulates many of the best practices Google has been using to run massive-scale services in production for years. We're happy to contribute this to the community as an open solution that works with Kubernetes; on-premises or in any cloud, to help solve challenges in modern application development. Istio provides developers and devops fine-grained visibility and control over traffic without requiring any changes to application code and provides CIOs and CSOs the tools needed to help enforce security and compliance requirements across the enterprise.

"Based on years of practical experience running container-based systems and working with enterprise clients, I've found that as developers adopt microservice architectures, they need a consistent way to connect, secure and manage the applications they are building", said Jason McGee, IBM Fellow, VP and CTO, IBM Cloud Platform. “IBM is thrilled to be joining forces with Google to launch the Istio project and give cloud developers the tools they need to turn disparate microservices into an integrated service mesh.”

Moving from monolithic apps to microservices
As monolithic applications are decomposed into microservices, teams have to worry about the challenges inherent in integrating services in distributed systems: they must account for service discovery, load balancing, fault tolerance, end-to-end monitoring, dynamic routing for feature experimentation and, perhaps most important of all, compliance and security.

How Istio helps
Istio is a layer of infrastructure between a service and the network that gives operators the controls they need and frees developers from having to solve distributed system problems in their code. This uniform layer of infrastructure combined with service deployments is commonly referred to as a service mesh. Istio is designed to run in any environment on any cloud, but we're starting our journey on Kubernetes. It only takes a single command to install Istio on any Kubernetes cluster, creating a service mesh that enables:
  • Automatic load balancing for HTTP, gRPC, and TCP traffic
  • Fine-grained control of traffic behavior with rich routing rules
  • Traffic encryption, service-to-service authentication and strong identity assertions
  • Fleet-wide policy enforcement
  • In-depth telemetry and reporting
The service mesh empowers operators with policy control and decouples them from feature development and release processes, providing centralized management regardless of the scale and velocity of applications. Google has been realizing the benefits of a service mesh for over a decade, to offer global-scale reliable services like YouTube and Gmail, Cloud PubSub and Cloud BigTable.
“Google's experience is that having a uniform substrate for developing and operating microservices is critical to our ability to scale while maintaining both feature velocity and reliability”  Eric Brewer, Vice President, Google Cloud

An open community

To learn more about Istio and the problems it addresses, visit the Istio launch blog post. Istio is being developed in the open on GitHub, and we invite the community to join us in shaping the project as we work toward a 1.0 release later this year. We look forward to working with the community in making Istio production ready and working everywhere.

Google Cloud is committed to open-source, whether it’s bringing new technologies in the open like Kubernetes or gRPC; contributing to projects like Envoy; or supporting open-source tools on Google Cloud Platform. Istio is the latest instance of Google's continuing contribution to open-source as part of a collaborative community effort.

Beyond Istio

Istio is just one piece of a solution to help make microservices easier to build, deploy, consume and manage. In large enterprises with diverse environments and widespread use of third-party software, developers also want to discover, instantiate and consume services in a platform-agnostic way. Developers providing services need faster time-to-market, greater reach and a simple way to track usage and costs. Towards this end, we've been working with the open source community to contribute to the Open Service Broker, a unified API that simplifies service delivery and consumption. Through the Open Service Broker model CIOs can define a catalog of services which may be used within their enterprise and auditing tools to enforce compliance. All services powered by Istio will be able to seamlessly participate in the Service Broker ecosystem.

Looking ahead

Today, you can manually install and use Istio on Google Container Engine; in the future, we intend to provide a more automated and integrated experience.

We also intend to bring Istio capabilities to Cloud Endpoints and Apigee suite of products. This will provide common visibility and management for both APIs and microservices for organizations of any size. As we work with the community to harden Istio for production-readiness, we plan to provide deeper integration with the rest of Google Cloud.

Get started today

You can get started with Istio here. We also have a sample application composed of four separate microservices that can be easily deployed and used to demonstrate various features of the Istio service mesh. In case of issues you can reach out via the [email protected] mailing-list or file an issue on GitHub. If you’d like to build an integration with Istio, please fill out this form. We're excited about the future of microservices and API development built on Istio and Google Cloud.

Know thy enemy: how to prioritize and communicate risks – CRE life lessons


Editor’s note: We’ve spent a lot of time in CRE Life Lessons talking about how to identify and mitigate risks in your system. In this post, we’re going to talk about how to effectively communicate and stack-rank those risks.

When a Google Cloud customer engages with Customer Reliability Engineering (CRE), one of the first things we do is an Application Reliability Review (ARR). First, we try to understand your application’s goals: what it provides to users and the associated service level objectives (SLOs) (or we help you create SLOs if you do not have any!). Second, we evaluate your application and operations to identify risks that threaten your ability to reach your SLOs. For each identified risk, we provide a recommendation on how to eliminate or mitigate it based on our experiences at Google.

The number of risks identified for each application varies greatly depending on the maturity of your application and team and target level for reliability or performance. But whether we identify five risks or 50, two fundamental facts remain true: Some risks are worse than others, and you have a finite amount of engineering time to address them. You need a process to communicate the relative importance of the risks and to provide guidance on which risks should be addressed first. This appears easy, but beware! The human brain is notoriously unreliable at comparing and evaluating risks.

This post explains how we developed a method for analyzing risks during an ARR, allowing us to present our customers with a clear, ranked list of recommendations, explain why one risk is ranked above another, and describe the impact a risk may have on the application’s SLO target. By the end of this post, you’ll understand how to apply this to your own application, even without going through a CRE engagement.

Take one: the risk matrix

Each risk has many properties that can be used to evaluate its relative importance. In discussions internally and with customers, two properties in particular stand out as most relevant:
  • The likelihood of the risk occurring in a given time period.
  • The impact that would be felt if the risk materializes.
We began by defining three levels for each property, which are represented in the following 3x3 table.

Example table with representative risks for each category: The row headers represent likelihood and column headers represent impact.

Catastrophic
Damaging
Minimal
Frequent
Overload results in slow or dropped requests during the peak hour each day.
The wrong server is turned off and requests are dropped.
Restarts for weekly upgrades drop in-progress requests (i.e., no lame ducking).
Common
A bad release takes the entire service down. Rollback is not tested.
Users report an outage before monitoring and alerting notifies the operator.
A daylight savings bug drops requests.
Rare
There is a physical failure in the hosting location that requires complete restoration from a backup or disaster recovery plan.
Overload results in a cascading failure. Manual intervention is required to halt or fix the issue.
A leap year bug causes all servers to restart and drop requests.
We tested this approach with a couple of customers by bucketing the risks we had identified into the table. This is not a novel approach. We very quickly realized that our terminology and format are the same as that used in a risk matrix, a commonly used management tool in the risk assessment field. This realization seemed to confirm that we were on the right track, and had created something that customers and their management could easily understand.

We were right: Our customers told us that the table of risks was a good overview and was easy to grasp. However, we struggled to explain the relative importance of entries in the list based on the cells in the table:
  • The distribution of risks across the cells was extremely uneven. Most risks ended up in the “common, damaging” cell, which doesn’t help to explain relative importance of the items within each cell.
  • Assigning a risk to a cell (and its subsequent position in the list of risks) is subjective and depends on the reliability target of the application. For example, the “frequent, catastrophic” example of dropping traffic for a few minutes during a release is catastrophic at four nines, but less so at two nines.
  • Ordering the cells into a ranking is not straightforward. Is it more important to handle a “rare, catastrophic” risk, or a “frequent, minimal” risk? The answer is not clear from the names or definitions of the categories alone. Further, the desired order can change from matrix to matrix depending on the number of items in each cell.

Risk expressed as expected losses

As we showed in the previous section, the traditional risk matrix does a poor job of explaining the relative importance of each risk. However, the risk assessment field offers another useful model: using impact and likelihood to calculate the expected loss from a risk. Expressed as a numeric quantity, this expected loss value is great way to explain the relative importance of our list of risks.

How do we convert qualitative concepts of impact and likelihood to quantified values that we can use to calculate expected loss? Consider our earlier posts on availability and SLOs, specifically, the concepts of Mean Time Between Failure (MTBF), Mean Time To Recover (MTTR), and error budget. The MTBF of a risk provides a measure of likelihood (i.e., how long it takes for the risk to cause a failure), the MTTR provides a measure of impact (i.e., how long we expect the failure to last before recovering), and the error budget is the expected number of downtime minutes per year that you're willing to allow (a.k.a. accepted loss).

Now with this system, when we work through an ARR and catalog risks, we use our experience and judgement to estimate each risk’s MTBF (counted in days) and the subsequent MTTR (counted in minutes out of SLO). Using these two values, we estimate the expected loss in minutes for each risk over a fixed period of time, and generate the desired ranking.

We found that calculating expected losses over a year is a useful timeframe for risk-ranking, and developed a three-colour traffic light system to provide high-level guidance and quick visual feedback on the magnitude of each risk vs. the error budget:
  • Red: This risk is unacceptable, as it falls above the acceptable error budget for a single risk (we typically use 25%), and therefore, can have a major impact on your reliability in a single event.
  • Amber: This risk should not be acceptable, as it’s a major consumer of your error budget and therefore, needs to be addressed. You may be able to accept some amber risks by addressing some less urgent (green) risks to buy back budget.
  • Green: This is an acceptable risk. It's not a major consumer of your error budget, and in aggregate, does not cause your application to exceed the error budget. You don't have to address green risks, but may wish to do so to give yourself more budget to cover unexpected risks, or to accept amber risks that are hard to mitigate or eliminate.
Based on the three-colour traffic light system, the following table demonstrates how we rank and colour the risks given a 3-nines availability target. The risks are a combination of those in the original matrix and some additional examples to help illustrate the amber category. You can refer to the spreadsheet linked at the end of this post to see the precise MTTR and MTBF numbers that underlie this table, along with additional examples of amber risks.
Risk
Bad minutes/year
Overload results in slow or dropped requests during the peak hour each day.
3559
A bad release takes the entire service down. Rollback is not tested.
507
Users report an outage before monitoring and alerting notifies the operator.
395
There is a physical failure in the hosting location that requires complete restoration from a backup or disaster recovery plan.
242
The wrong server is turned off and requests are dropped.
213
Overload results in a cascading failure. Manual intervention is required to halt or fix the issue.
150
Operator accidentally deletes database; restore from backup is required
129
Unnoticed growth in usage triggers overload; service collapses.
125
A configuration mishap reduces capacity; causing overload and dropped requests
122
A new release breaks a small set of requests; not detected for a day.
119
Operator is slow to debug and root cause bug due to noisy alerting
76
A daylight savings bug drops requests.
71
Restarts for weekly upgrades drop in-progress requests (i.e., no lame ducking).
52
A leap year bug causes all servers to restart and drop requests.
16

Other Considerations

The ranked list of risks is extremely useful for communicating the findings of an ARR and conveying the relative magnitude of the risks compared to each other. We recommend that you use the list only for this purpose. Do not prioritize your engineering work directly based on the list. Instead, use the expected loss values as inputs to your overall business planning process, taking into consideration remediation and opportunity costs to prioritize work.

Also, don’t be tricked into thinking that because you have concrete numbers for the expected loss, that they are precise! They’re only as good as the estimates derived from MTBF and MTTR values. In the best case, MTBF and MTTR are averages from observed data; more commonly, they will be estimates based purely on intuition and experience. To minimize introducing errors into the final ranking, we recommend estimating MTBF and MTTR values likely to be within an order of magnitude of correct, rather than use specific, potentially inaccurate values.

Somewhat in contrast to the advice just mentioned, we find it useful to introduce additional granularity into the calculation of MTBF and MTTR values, for more accurate estimates. First, we split MTTR into two components:
  • Mean Time To Detect (MTTD): The time between when the risk first manifests and when the issue is brought to the attention of someone (or something) capable of remediating it.
  • Mean Time To Repair (MTTR): Redefined to mean the time between when the issue is brought to the attention of someone capable of remediating it and when it is actually remediated.
This granularity is driven by the realization that, often, the time to notice an issue and the time to fix it differ significantly. It’s easier to assess and ensure estimates are consistent across risks with these figures separately specified.

Second, in addition to considering MTTD, we also factor in what proportion of the users are affected by a risk (e.g., in a sharded system, shards can fail at a given rate and incur downtime before a successful failover succeeds, but each failure only impacts a proportion of the users). Taking these two optimizations into account, our overall formula for calculating the expected annual loss from a risk is:

(MTTD + MTTR) * (365.25 / MTBF) * percent of affected users

To implement this method for your own application, here is a spreadsheet template that you can copy and populate with your own data: https://goo.gl/bnsPj7

Summary

When analyzing the reliability of an application, it is easy to generate a large list of potential risks that must be prioritized for remediation. We have demonstrated how the MTBF and MTTR values of each risk can be used to develop a prioritized list of risks based on the expected impact on the annual error budget.

We here in CRE have found this method to be extremely helpful. In addition, customers can use the expected loss figure as an input to more comprehensive risk assessments, or cost/benefit calculations of future engineering work. We hope you find it helpful too!

How to do serverless pixel tracking with GCP


Whether they’re opening a newsletter or visiting a shopping cart page, how users interact with web content is very interesting to publishers. One way to understand user behavior is by using pixels, small 1x1 transparent images embedded into the web property. When loaded, the pixel calls a web server that records the request parameters passed in the URL that can be processed later.

Adding a pixel is easy, but hosting it and processing the request can be challenging for various reasons:
  • You need to set up, manage and monitor your ad servers
  • Users are usually global, which means that you need ad servers around the world
  • User visits are spiky, so pixel servers must scale up to sustain the load and scale down to limit the spend.
Google Cloud Platform (GCP) services such as Container Engine and managed autoscaled instance groups can help with those challenges. But at Google Cloud, we think companies should avoid managing infrastructure whenever possible.

For example, we recently worked with GCP partner and professional services firm DoiT International to build a pixel tracking platform that relieves the administrator from setting up or managing any servers. Instead, this serverless pixel tracking solution leverages managed GCP services, including:
  • Google Cloud Storage: A global or regional object store that offers different options such as Standard, Nearline, Cold with various prices and SLAs depending on your needs. In our case, we used Standard, which offers low millisecond latency
  • Google HTTP(s) Load Balancer: A global anycast IP load balancer service that can scale to millions of QPS with integrated logging. It also can be leveraged by Cloud CDN to prevent useless access to Google Cloud Storage by caching pixels closer to the user in Google edges
  • BigQuery: Google's fully managed, petabyte-scale, low-cost enterprise data warehouse for analytics
  • Stackdriver Logging: A logging system that allows you to store, search, analyze, monitor and alert on log data and events from GCP and Amazon Web Services (AWS). It supports Google load balancers and can export data to Cloud Storage, BigQuery or Pub/Sub
Tracking pixels with these services works as follows:
  1. A client calls a pixel URL that's served directly by Cloud Storage.
  2. A Google Cloud Load Balancer in front of Cloud Storage records the request to Stackdriver Logging, whether there was a cache hit or not.
  3. Stackdriver Logging exports every request to BigQuery as they come in, which acts as a storage and querying engine for ad-hoc analytics that can help business analysts better understand their users.


All those services are fully managed and do not require you to set up any instances or VMs. You can learn more about this solution by:
Going forward, we look forward to building more serverless solutions on top of GCP managed offerings. Let us know in the comments if there’s a solution that you’d like us to build!

Introducing Google Cloud IoT Core: for securely connecting and managing IoT devices at scale


Today we're announcing a new fully-managed Google Cloud Platform (GCP) service called Google Cloud IoT Core. Cloud IoT Core makes it easy for you to securely connect your globally distributed devices to GCP, centrally manage them and build rich applications by integrating with our data analytics services. Furthermore, all data ingestion, scalability, availability and performance needs are automatically managed for you in GCP style.

When used as part of a broader Google Cloud IoT solution, Cloud IoT Core gives you access to new operational insights that can help your business react to, and optimize for, change in real time. This advantage has value across multiple industries; for example:
  • Utilities can monitor, analyze and predict consumer energy usage in real time
  • Transportation and logistics firms can proactively stage the right vehicles/vessels/aircraft in the right places at the right times
  • Oil and gas and manufacturing companies can enable intelligent scheduling of equipment maintenance to maximize production and minimize downtime

So, why is this the right time for Cloud IoT Core?


About all the things


Many enterprises that rely on industrial devices such as sensors, conveyor belts, farming equipment, medical equipment and pumps particularly, globally distributed ones are struggling to monitor and manage those devices for several reasons:
  • Operational cost and complexity: The overhead of managing the deployment, maintenance and upgrades for exponentially more devices is stifling. And even with a custom solution in place, the resource investments required for necessary IT infrastructure are significant.
  • Patchwork security: Ensuring world-class, end-to-end security for globally distributed devices is out of reach or at least not a core competency for most organizations.
  • Data fragmentation: Despite the fact that machine-generated data is now an important data source for making good business decisions, the massive amount of data generated by these devices is often stored in silos with a short expiration date, and hence never reaches downstream analytic systems (nor decision makers).
Cloud IoT Core is designed to help resolve these problems by removing risk, complexity and data silos from the device monitoring and management process. Instead, it offers you the ability to more securely connect and manage all your devices as a single global system. Through a single pane of glass you can ingest data generated by all those devices into a responsive data pipeline and, when combined with other Cloud IoT services, analyze and react to that data in real time.

Key features and benefits


Several key Cloud IoT Core features help you meet these goals, including:

  • Fast and easy setup and management: Cloud IoT Core lets you connect up to millions of globally dispersed devices into a single system with smooth and even data ingestion ensured under any condition. Devices are registered to your service quickly and easily via the industry-standard MQTT protocol. For Android Things-based devices, firmware updates can be automatic.
  • Security out-of-the-box: Secure all device data via industry-standard security protocols. (Combine Cloud IoT Core with Android Things for device operating-system security, as well.) Apply Google Cloud IAM roles to devices to control user access in a fine-grained way.
  • Native integration with analytic services: Ingest all your IoT data so you can manage it as a single system and then easily connect it to our native analytic services (including Google Cloud Dataflow, Google BigQuery and Google Cloud Machine Learning Engine) and partner BI solutions (such as Looker, Qlik, Tableau and Zoomdata). Pinpoint potential problems and uncover solutions using interactive data visualizations, or build rich machine-learning models that reflect how your business works.
  • Auto-managed infrastructure: All this in the form of a fully-managed, pay-as-you-go GCP service, with no infrastructure for you to deploy, scale or manage.
"With Google Cloud IoT Core, we have been able to connect large fleets of bicycles to the cloud and quickly build a smart transportation fleet management tool that provides operators with a real-time view of bicycle utilization, distribution and performance metrics, and it forecasts demand for our customers."
 Jose L. Ugia, VP Engineering, Noa Technologies

Next steps

Cloud IoT Core is currently available as a private beta, and we’re launching with these hardware and software partners:

Cloud IoT Device Partners
Cloud IoT Application Partners

When generally available, Cloud IoT Core will serve as an important, foundational tool for hardware partners and customers alike, offering scalability, flexibility and efficiency for a growing set of IoT use cases. In the meantime, we look forward to your feedback!

Cloud Spanner is now production-ready; let the migrations begin!


Cloud Spanner, the world’s first horizontally-scalable and strongly-consistent relational database service, is now generally available for your mission-critical OLTP applications.

We’ve carefully designed Cloud Spanner to meet customer requirements for enterprise databases — including ANSI 2011 SQL support, ACID transactions, 99.999% availability and strong consistency — without compromising latency. As a combined software/hardware solution that includes atomic clocks and GPS receivers across Google’s global network, Cloud Spanner also offers additional accuracy, reliability and performance in the form of a fully-managed cloud database service. Thanks to this unique combination of qualities, Cloud Spanner is already delivering long-term value for our customers with mission-critical applications in the cloud, including customer authentication systems, business-transaction and inventory-management systems, and high-volume media systems that require low latency and high throughput. For example, Snap uses Cloud Spanner to power part of its search infrastructure.

Looking toward migration


In preparation for general availability, we’ve been working closely with our partners to make adoption as smooth and easy as possible. Thus today, we're also announcing our initial data integration partners: Alooma, Informatica and Xplenty.

Now that these partners are in the early stages of Cloud Spanner “lift-and-shift” migration projects for customers, we asked a couple of them to pass along some of their insights about the customer value of Cloud Spanner, as well as any advice about planning for a successful migration:

From Alooma:

Cloud Spanner is a game-changer because it offers horizontally scalable, strongly consistent, highly available OLTP infrastructure in the cloud for the first time. To accelerate migrations, we recommend that customers replicate their data continuously between the source OLTP database and Cloud Spanner, thereby maintaining both infrastructures in the same state — this allows them to migrate their workloads gradually in a predictable manner.

From Informatica:
“Informatica customers are stretching the limits of latency and data volumes, and need innovative enterprise-scale capabilities to help them outperform their competition. We are excited about Cloud Spanner because it provides a completely new way for our mutual customers to disrupt their markets. For integration, migration and other use cases, we are partnering with Google to help them ingest data into Cloud Spanner and integrate a variety of heterogeneous batch, real-time, and streaming data in a highly scalable, performant and secure way.”

From Xplenty:
"Cloud Spanner is one of those cloud-based technologies for which businesses have been waiting: With its horizontal scalability and ACID compliance, it’s ideal for those who seek the lower TCO of a fully managed cloud-based service without sacrificing the features of a legacy, on-premises database. In our experience with customers migrating to Cloud Spanner, important considerations include accounting for data types, embedded code and schema definitions, as well as understanding Cloud Spanner’s security model to efficiently migrate your current security and access-control implementation."

Next steps


We encourage you to dive into a no-cost trial to experience first-hand the value of a relational database service that offers strong consistency, mission-critical availability and global scale (contact us about multi-regional instances) with no workarounds — and with no infrastructure for you to deploy, scale or manage. (Read more about Spanner’s evolution inside Google in this new paper presented at the SIGMOD ‘17 conference today.) If you like what you see, a growing partner ecosystem is standing by for migration help, and to add further value to Cloud Spanner use cases via data analytics and visualization tooling.

Mapping your organization with the Google Cloud Platform resource hierarchy


As your cloud footprint grows, it becomes harder to answer questions like
"How do I best organize my resources?" "How do I separate departments, teams, environments and applications?" "How do I delegate administrative responsibilities in a way that maintains central visibility?" and "How do I manage billing and cost allocation?"

Google Cloud Platform (GCP) tools like Cloud Identity & Access Management, Cloud Resource Manager, and Organization policies let you tackle these problems in a way that best meets your organization’s requirements.

Specifically, the Organization resource, which represents a company in GCP and is the root of the resource hierarchy, provides centralized visibility and control over all its GCP resources.

Now, we're excited to announce the beta launch of Folders, an additional layer under Organization that provides greater flexibility in arranging GCP resources to match your organizational structure.

"As our work with GCP scaled, we started looking for ways to streamline our projects, Thanks to Cloud Resource Manager, we now centrally control and monitor how resources are created and billed in our domain. We use IAM and Folders to provide our departments with the autonomy and velocity they need, without losing visibility into resource access and usage. This has significantly reduced our management overhead, and had a direct positive effect on our ability to support our customers at scale.”  Marcin Kołda, Senior Software Engineer at Ocado Technology.

The Google Cloud resource hierarchy


Organization, Projects and now Folders comprise the GCP resource hierarchy. You can think of the hierarchy as the equivalent of the filesystem in traditional operating systems. It provides ownership, in that each GCP resource has exactly one parent that controls its lifecycle. It provides grouping, as resources can be assembled into Projects and Folders that logically represent services, applications or organizational entities, such as departments and teams in your organization. Furthermore, it provides the “scaffolding” for access control and configuration policies, which you can attach at any node and propagate down the hierarchy, simplifying management and improving security.

The diagram below shows an example of the GCP resource hierarchy.
Projects are the first level of ownership, grouping and policy attach point. At the other end of the spectrum, the Organization contains all the resources that belong to a company and provides the high-level scope for centralized visibility and control. A policy defined at the Organization level is inherited by all the resources in the hierarchy. In the middle, Folders can contain Projects or other Folders and provide the flexibility to organize and create the boundaries for your isolation requirements.

As the Organization Admin for your company, you can, for example, create first-level Folders under the Organization to map your departments: Engineering, IT, Operations, Marketing, etc. You can then delegate full control of each Folder to the lead of the corresponding department by assigning them the Folder Admin IAM role. Each department can organize their own resources by creating sub-folders for teams, or applications. You can define Organization-wide policies centrally at the Organization level, and they're inherited by all resources in the Organization, ensuring central visibility and control. Similarly, policies defined at the Folder level are propagated down the corresponding subtree, providing teams and departments with the appropriate level of autonomy.

What to consider when mapping your organization onto GCP


Each organization has a unique structure, culture, velocity and autonomy requirements. While there isn’t a predefined recipe that fits all scenarios, here are some criteria to consider as you organize your resources in GCP.

Isolation: Where do you want to establish trust boundaries: at the department and team level, at the application or service level, or between production, test and dev environments? Use Folders with their nested hierarchy and Projects to create isolation between your cloud resources. Set IAM policies at the different levels of the hierarchy to determine who has access to which resources.

Delegation: How do you balance autonomy with centralized control? Folders and IAM help you establish compartments where you can allow more freedom for developers to create and experiment, and reserve areas with stricter control. You can for example create a Development Folder where users are allowed to create Projects, spin up virtual machines (VMs) and enable services. You can also safeguard your production workflows by collecting them in dedicated Projects and Folders where least privilege is enforced through IAM.

Inheritance: How can inheritance optimize policy management? As we mentioned, you can define policies at every node of the hierarchy and propagate them down. IAM policies are additive. If, for example, [email protected] is granted Compute Engine instanceAdmin role for a Folder, he will be able to start VMs in each Project under that Folder.

Shared resources: Are there resources that need to be shared across your organization, like networks, VM images, service accounts? Use Projects and Folders to build central repositories for your shared resources and limit administrative privileges over these resources to only selected users. Use least privilege principle to allow access to other users.

Managing the GCP resource hierarchy


As part of the Folders beta launch, we've redesigned the Cloud Console user interface to improve visibility and management of the resource hierarchy. You can now effortlessly browse the hierarchy, manage resources and define IAM policies via the new scope picker and the Manage Resources page shown below.
In this example, the Organization “myorganization.com” is structured in two top-level folders for the Engineering and IT departments. The Engineering department then creates two sub-folders for Product_A and Product_B, which in turn contain folders for the production, development and test environments. You can define IAM permissions for each Folder from within the same UI, by selecting the resources of interest and accessing the control pane on the right hand side, as shown below.
By leveraging IAM permissions, the Organization Admin can restrict visibility to users within portions of the tree, creating isolation and enforcing trust boundaries between departments, products or environments. In order to maximize security of the production environment for Product_A for example, only selected users may be granted access or visibility to the corresponding Folder. Developer [email protected], for instance, is working on new features for Product_A, but in order to minimize risk of mistakes in the production environment, he's not given visibility to the Production Folder. You can see his visibility of the Organization hierarchy in the diagram below:


As with any other GCP component, alongside the UI, we've provided API and command line (gcloud) interfaces to programmatically manage the entire resource hierarchy, enabling automation and standardization of policies and environments.

The following script creates the resource hierarchy above programmatically using the gcloud command line tool.


# Find your Organization ID
 
me@cloudshell:~$ gcloud organizations list
DISPLAY_NAME        ID     DIRECTORY_CUSTOMER_ID
myorganization.com  358981462196  C03ryezon
 
# Create first level folder “Engineering” under the Organization node
 
me@cloudshell:~$ gcloud alpha resource-manager folders create
--display-name=Engineering --organization=358981462196
Waiting for [operations/fc.2201898884439886347] to finish...done.                                                                                                                     Created [<Folder 
createTime: u'2017-04-16T22:49:10.144Z' 
displayName: u'Engineering' 
lifecycleState: LifecycleStateValueValuesEnum(ACTIVE, 1) 
name: u'folders/1000107035726' 
parent: u'organizations/358981462196'>].

 
# Add a Folder Admin role to the “Engineering” folder
 
me@cloudshell:~$ gcloud alpha resource-manager folders add-iam-policy-binding 
1000107035726 --member=user:[email protected] 
--role=roles/resourcemanager.folderAdmin
bindings: 
- members:  
- user:[email protected]  
role: roles/resourcemanager.folderAdmin
- members:  
- user:[email protected]  
role: roles/resourcemanager.folderEditor
etag: BwVNX61mPnc=
 
 
# Check the IAM policy set on the “Engineering” folder
 
me@cloudshell:~$ gcloud alpha resource-manager folders get-iam-policy 
1000107035726
bindings: 
- members:  
- user:[email protected]  
role: roles/resourcemanager.folderAdmin
- members:  
- user:[email protected]  
role: roles/resourcemanager.folderEditor
etag: BwVNX61mPnc=


# Create second level folder “Product_A” under folder “Engineering”
 
me@cloudshell:~$ gcloud alpha resource-manager folders create 
--display-name=Product_A --folder=1000107035726
Waiting for [operations/fc.2194220672620579778] to finish...done.                                                                                                                     Created [].
 
# Crate third level folder “Development” under folder “Product_A”
 
me@cloudshell:~$ gcloud alpha resource-manager folders create 
--display-name=Development --folder=1000107035726
Waiting for [operations/fc.3497651884412259206] to finish...done.                                                                                                                     Created [].
 
# List all the folders under the Organization
 
me@cloudshell:~$ gcloud alpha resource-manager folders list 
--organization=358981462196
DISPLAY_NAME  PARENT_NAME                 ID
IT            organizations/358981462196  575615098945
Engineering   organizations/358981462196  661646869517
Operations    organizations/358981462196  895951706304
 
# List all the folders under the “Engineering” folder
 
me@cloudshell:~$ gcloud alpha resource-manager folders list 
--folder=1000107035726
DISPLAY_NAME  PARENT_NAME           ID
Product_A     folders/1000107035726  732853632103
Product_B     folders/1000107035726  941564020040
 
 
# Create a new project in folder “Product_A”
 
me@cloudshell:~$ gcloud alpha projects create my-awesome-service-2 --folder 
732853632103
Create in progress for [https://cloudresourcemanager.googleapis.com/v1/projects/my-awesome-service-3].Waiting for [operations/pc.2821699584791562398] to finish...done. 


# List projects under folder “Production”
 
me@cloudshell:~$ gcloud alpha projects list --filter 'parent.id=725271112613'
PROJECT_ID            NAME                  PROJECT_NUMBER
my-awesome-service-1  my-awesome-service-1  869942226409
my-awesome-service-2  my-awesome-service-2  177629658252


As you can see, Cloud Resource Manager is a powerful way to manage and organize GCP resources that belong to an organization. To learn more, check out the Quickstarts, and stay tuned as we add additional capabilities in the months to come.