Posted by Toni Klopfenstein, Developer Advocate
When creating scalable applications, consistent and reliable monitoring of resources is a valuable tool for any developer. Today we are releasing enhanced analytics and logging for Smart Home Actions. This feature enables you to more quickly identify and respond to errors or quality issues that may arise.

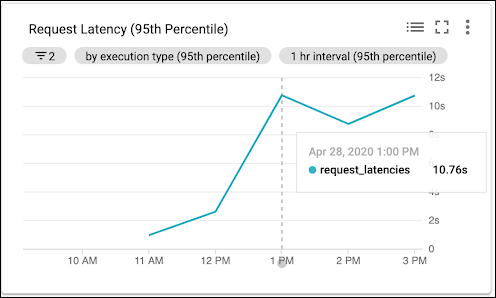
Request Latency Dashboard
You can now access the smart home dashboard with pre-populated metrics charts for your Actions on the Analytics tab in the Actions Console, or through Cloud Monitoring. These metrics help you quantify the health and usage of your Action, and gain insight into how users engage with your Action. You can view:
- Execution types and device traits used
- Daily users and request counts
- User query response latency
- Success rate for Smart Home engagements
- Comparison of cloud and local fulfilment interactions

Successful Requests Dashboard
Cloud Logging provides detailed logs based on the events observed in Cloud Monitoring.
We've added additional features to the error logs to help you quickly debug why intents fail, which particular device commands malfunction, or if your local fulfilment falls back to cloud fulfilment.
New details added to the event logs include:
- Cloud vs. local fulfilment
- EXECUTE vs. QUERY intents
- Locale of request
- Device Type
You can additionally export these logs through Cloud Pub/Sub, and build log-based metrics and alerts for your development teams to gain insights into common issues.
For more guidance on accessing your Smart Home Action analytics and logs, check out the developer guide or watch the video.
We want to hear from you! Continue sharing your feedback with us through the issue tracker, and engage with other smart home developers in the /r/GoogleAssistantDev community. Follow @ActionsOnGoogle on Twitter for more of our team's updates, and tweet using #AoGDevs to share what you’re working on. We can’t wait to see what you build!