Tag Archives: Business Insights

Get Your Data House in Order: Our Checklist for Useful Marketing Data

Every organization has unique data needs, but leading organizations have one thing in common: They expect data to be useful. In fact, marketing leaders are 127% as likely as the mainstream to say that their data and analytics strategy is useful for decision-making at all levels.1

We shared more insights about usefulness — and other findings from new Econsultancy research conducted in partnership with Google — in a recent webinar with MIT Sloan, where marketers from companies of all sizes joined to learn how organizations around the world regularly turn insights into action.

It goes without saying that the word “useful” can mean different things to different marketers. As you build a data strategy that’s optimized for your business, there are a few helpful questions you can ask to frame your thinking.

Use this quick checklist to get yourself on the right track — and watch the webinar to learn more about what the research findings.

Is your data organized? 

The amount of data useful to your company depends on the size of the company, but one thing is certain: only organized data is useful data.

In another study, 61% of marketing decision makers said they struggled to access or integrate the data they needed in 2016.2 When gathering and analyzing data, it’s important to know how your data should be organized in order to know what to focus on. Data dispersed in different organizational silos will be difficult to sift through, let alone use to inform important decisions. Instead, get data out of silos and organize it so that it can be useful.

Is your data focused on the user?

In our webinar, listeners learned that a user-centric approach — and the better understanding of your audience that comes with it — helps organizations handle the ever-increasing number of touchpoints in the customer journey and deliver more relevant, engaging experiences.

Nearly 90% of leaders agree that understanding user journeys across channels and devices is critical to marketing success.3 Any data that allows marketers to better understand these journeys is useful for decision-making.

Is your data integrated?

Our report with Econsultancy found that top companies place a greater emphasis on integrating their technology. Specifically, organizations with integrated marketing and advertising stacks are 37% more likely to say that their company uses data to support decision-making at all levels, compared to marketers without fully integrated technologies.4

Ask yourself: How and where does my business use data? During our webinar, we polled the audience to see in which areas of business the participants most commonly use data and analytics. See how you compare:
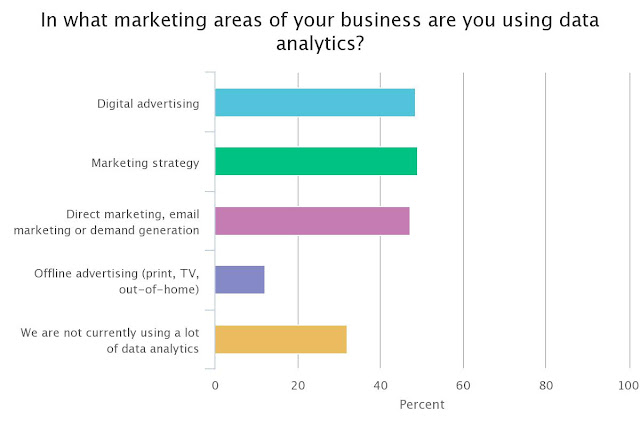
The live attendees of our webinar, "Get Your Data House in Order," answered the question: In what areas of your business are you using data analytics?


Do you have defined KPIs? 

Before you truly define what “useful” data means for you, you need to set KPIs. In our Econsultancy study, 45% of all respondents say that unclear definitions of KPIs present a significant negative impact on their organizations, whereas leaders are 47% more likely than the mainstream to say that their data and analytics strategy includes how they define KPIs for paid media and (38% more likely for owned properties).5

The concept is simple: If you don’t know what you’re working toward, you can’t know what’s useful to you.

Does your team know how to use the data? 

Finally, data can only be useful if your team knows how to interpret and use it. The most effective way to ensure that data is properly shared throughout the team — and that all employees have access to effective training — is to have a documented data and analytics strategy.

More than half of the mainstream marketers we surveyed said their companies do not have adequate analyst-related resources. As a related benchmark, here’s how often our audience said they take action based on data:
Webinar attendee responses to the poll question: How often does your team take action based on data?

For your team to use data to make decisions at all levels, data literacy must be promoted throughout the organization.

Every company will gather and use data differently — but no matter how mature your company is when it comes to using marketing data, this checklist will help you evaluate how effectively you’re using data.

Watch the complete webinar recording of “Marketers: Get Your Data House in Order” to hear more from Google and MIT Sloan speakers.

1,3,4,5 Econsultancy/Google, "The Customer Experience is Written in Data", May 2017, U.S. (n=677 marketing and measurement executives at companies with over $250M in revenues, primarily in North America; n=199 leading marketers who reported marketing significantly exceeded top business goal in 2016, n=478 mainstream marketers (remainder of the sample), May 2017 2 Google Surveys, "2016-2017 Marketing Analytics Challenges and Goals", Base: 203 marketing executives who have analytics or data-driven initiatives, U.S., December 2016.

Marketing with a Heart of Data

At top companies, data drives strategies and daily decisions. Our new research with Econsultancy shows that 60% of leading marketers routinely take action based on analytics, and are also 48% more likely than mainstream marketers to say their strategy is strongly data-driven.1

So, how can you help your organization feel data in its pulse? Move beyond instinct and intuition and put data at the heart of your marketing strategy to drive smarter decisions and produce better results. 


Get over your gut — and take data to heart

As a confident decision-maker, it’s natural to trust your gut. But unless your instincts are right every time, why not consult another source? According to our report, nearly 60% of leading marketers agree that decisions made with data have better outcomes than those made with gut instinct or experience, compared to just 36% of mainstream marketers.2

Data tells us things we may not want to hear. For example, maybe you thought last quarter’s campaign strategy would work again, but the data tells a different story. That’s why it’s important to take data to heart — in other words, to accept and trust what your analytics tell you. Marketing with a heart of data also means being comfortable enough with change to act on those insights. Leading marketers are 44% more likely than mainstream ones to say their company is “quite open to change.”3 Is yours?

Let data flow freely

It’s not enough for you to trust your data. For your data-driven marketing strategy to succeed, everyone’s heart has to be in it. Companies that invest in data and analytics at every level empower their marketing organizations to make more informed choices and provide better customer experiences.

But this alignment is impossible if only analysts have access to data. The solution? Help get everyone comfortable with using data in their decision-making. When data flows freely and everyone understands how to use it, analytics can pump insight and value into every decision, strategy, and team.

It’s no wonder 93% of survey respondents agree that collaboration across marketing and analytics teams is essential to driving results.4 In organizations where data is valued and accessible, anyone — and everyone — can uncover insights and drive the business forward.


Don’t forget your head

Even when your marketing organization has a healthy core, you’ll need the support of the C-suite to succeed and lead. After all, what good is a heart of data without a head of marketing?

To secure executive buy-in, bring data insights to your meetings, calls, and conversations — use data to back up everything from big-idea budgets to email campaign optimizations. When executives receive recommendations based on analytics, they start to expect it.

Two-thirds of survey respondents at leading companies say that being a more data-driven organization is a top goal for their CEO, compared to just half of respondents at mainstream organizations.5 While your C-suite can set the right beat to propel innovation and collaboration, you can help keep the systems functioning to ensure data remains at the heart of your strategy.

Download the full Econsultancy research report here to learn how to build a truly data-driven culture.


1-5 Econsultancy/Google, "Customer Experience is Written in Data", May 2017, U.S. (n=677 marketing and measurement executives at companies with over $250M in revenues, primarily in North America; n=199 leading marketers who reported marketing significantly exceeded top business goal in 2016, n=478 mainstream marketers (remainder of the sample)

Three Ways to Get Data Out of Silos and Into Your Marketing Strategy

There are a lot of ways to organize information. And the bigger a company is, the more complicated it can be for employees to find the right data, let alone know how best to use or share that information to make more-informed decisions.

Chances are that some data is “hidden” in silos across your company. According to new research from Econsultancy in partnership with Google, 86% of senior executives agree: eliminating organizational silos is critical to expanding the use of data and analytics in decision-making.1

If teams don’t talk, or if your organization doesn’t have an integrated data strategy to harness marketing, customer, and advertising data, information and ideas won’t flow freely. Here are three ways to break down data silos and get your organization on the path to a more collaborative, data-driven culture.

1. Make data accessible — to everyone
If you have work to do to get your data house in order, you’re not alone: 61% of marketing decision-makers struggled to access or integrate data they needed last year.2

The first step to making data more accessible is to outline a data strategy that identifies data owners and key points of contact for each information source. Next, define how to integrate data and related technologies, and provide standards and processes related to data security and privacy. Include guidelines for sharing data internally.

Democratizing access to data and insights enables employees at all levels to check their gut — and that leads to better results. The same Econsultancy study found that marketing leaders are 1.6X as likely as their mainstream counterparts to strongly agree that open access to data leads to higher business performance.3

Watch our on-demand webinar featuring new research and best practices in marketing data and analytics strategy from Google and MIT Sloan School of Management. 

2. Champion the value of data-driven insights over gut feelings
Once data is made available to marketing managers and business decision-makers, make sure you champion a data-first mindset with your team. Using data effectively is a key differentiator for marketers who are ahead of the curve.

While a documented data and analytics strategy can provide a guide for all employees, support from the top helps set the tone. Nearly two-thirds of leading organizations say that their executives treat data-driven insights as more valuable than gut instinct.4

C-suite buy-in and other champions across the company help reinforce a data-driven culture by giving teams stuck in silos a nudge to collaborate and share analytic insights. Even better, this environment should give teams the incentive to align or share goals since data is core to campaign plans and marketing strategy.


3. Educate stakeholders on how to interpret the data
Having access to data is great, but if employees don’t know how to use it, the insights will remain isolated and unused. Consider this: 75% of marketers agree that lack of education and training on data and analytics is the biggest barrier to more business decisions being made based on data insights.5
If a team is empowered with the right learnings, it will proactively integrate data rather than push it aside. Set up brown bag sessions or internal trainings, or provide employees access to self-paced learning modules.

Finally, consider pairing the “data evangelists” and data storytellers within your organization with different team members to identify areas of focus based on relevant business goals and the biggest opportunities.


Download the Econsultancy report, “The customer experience is written in data,” to learn how successful brands put data at the center of their marketing strategies. 


1, 3, 4, 5 Google/Econsultancy, "The Customer Experience Is Written in Data", U.S., n=677 marketing and measurement executives at companies with over $250M in revenues, primarily in North America; n=199 leading marketers who reported marketing significantly exceeded top business goal in 2016; n=478 mainstream marketers (remainder of sample); May 2017. 2 Google Surveys, U.S., "2016–2017 Marketing Analytics Challenges and Goals," Base: 203, marketing executives who have analytics or data-driven initiatives, Dec. 2016.
2 Google Surveys, U.S., "2016–2017 Marketing Analytics Challenges and Goals," Base: 203, marketing executives who have analytics or data-driven initiatives, Dec. 2016.

Why Your Testing and Optimization Team Needs a Data Storyteller

If a test happens on your website and nobody hears about it, does it make a sound?

Not to get too philosophical, but that's one of the big challenges of building a culture of growth and optimization: getting the word out. That's why a data storyteller is one of the key members of any testing team.

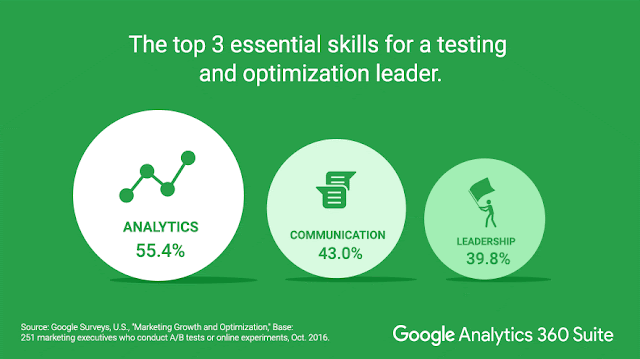
In fact, “communication and data storytelling” was noted as a critical skill for a person who leads testing and optimization efforts, according to a survey of marketing leaders who conduct tests and online experiments.1 The must-have skills rounding out the top three were leadership and, the obvious, analytics.


A data storyteller is part numbers-cruncher, part internal marketer, and part ace correspondent from the testing trenches. He or she is someone who can take the sheer data of testing — the stacks of numbers, the fractional wins and losses, the stream of daily choices — and turn it into a narrative that will excite the team, the office, and (especially) the C-suite.

Storytelling doesn't just mean bragging about successes. It can also mean sharing failures and other less-than-optimal outcomes. The point is not just to highlight wins: it's to reinforce a culture of growth, to generate interest in experimentation, and to explain why testing is so good for the company.

"Our test success rate is about 10%," says Jesse Nichols, Head of Growth for Nest. "We learn something from all our tests, but only one in 10 results in some kind of meaningful improvement." That means that a big part of the data storyteller's job is to keep people interested in testing and show them the value.

Watch our on-demand webinar “Test with success — even when you fail” to hear more testing and optimization tips.


If you're the data storyteller for your team, here are three points to remember:
  • Take the long view.  Gaining support for testing is like rolling a rock up a hill: slow going at first, but once you cross the summit the momentum will take over fast. It takes time, so lay the groundwork with lots of short reports. Don't wait to make formal presentations: Look for chances to drop your message into weekly wrap-ups and other group forums. In short, don’t be afraid to over-communicate. 
  • Be specific. It's better to present one great number than 10 so-so ones. Think mosaic rather than mural: Look for specific stories that can represent your larger efforts and broader plans. 
  • Keep your eye on the bottom line. In the end, that's what it's all about. You may be thrilled that a call-to-action change from "see more" to "learn more" increased clicks by .03%, but what will really get the CMO and other executives interested is moving the profit needle. As a litmus test, ask yourself, “So what?” If your story doesn’t clearly answer the question in terms the audience cares about, consider giving it a rewrite. 
And remember that it won't always be small victories. "The things you're so sure are going to work are the ones that go nowhere," says Jesse. "Then you do a throwaway test and it makes the company an extra $500,000." That's a story that everyone will want to hear.


Download our eBook How to Build a Culture of Growth to learn more best practices on testing and optimization.


1Source: Google Surveys, U.S., "Marketing Growth and Optimization," Base: 251 marketing executives who conduct A/B tests or online experiments, Oct. 2016.

Happy 1st Birthday, Google Analytics 360 Suite! It’s an insights party, everyone’s invited

Time flies (and data mounts) when you’re having fun with measurement. One year ago today, we announced our enterprise suite of marketing measurement and analytics solutions, the Google Analytics 360 Suite. Today we wanted to reflect on this first year. Because, well, a lot has changed. 


Where we started

As marketers know, in today’s mobile-first world, people expect more from brands. They want questions answered quickly, and they want a relevant, engaging experience.

That’s a tall order. So on March 15, 2016, we introduced the world to the Google Analytics 360 Suite, an enterprise measurement solution comprising analytics, tagging, site optimization, data visualization, attribution, and audience management. It helps marketers get more insights — not more data — and deliver more meaningful experiences to customers. Built from the ground up with modern technology and cross-product integrations, it does the heavy lifting for marketers.

Last fall, we welcomed Google Surveys 360 to the suite family, allowing marketers to gauge brand health, get user feedback on site experiences, and understand marketing impact with fast, reliable insights. A great addition to the 360 Suite, Surveys makes getting performance marketing insights and market research to better answer the “why” really easy.


It’s just the beginning: we’re on a journey together

This past year we’ve continued to check in with marketing decision-makers to see what challenges they still face in their data-driven transformations (so we know where to make product enhancements), and here’s what we’re hearing:

  • Building a culture of growth
    Leading marketers are embracing data and testing to continually improve the customer experience — or simply, make a website better — day by day. This growth mindset requires a willingness to experiment. And with that comes the challenge of getting comfortable with failure. Remember: There’s still a lot to be learned from (and celebrate in) a success rate of 1 in 10.
  • Dealing with data
    When we surveyed marketing decision-makers at the end of last year, 61% said they struggled to access or integrate the data they needed in 2016. And 26% of marketers said they didn't have the right analytics talent or enough of it.1 If marketers spend too much time wrangling with data, that means measurement is not always top of mind.
  • Measurement is sometimes an afterthought
    Only 5 out of 10 marketers said they think about measurement while developing campaign strategy.2 When data keeps pouring in, thinking about what campaign information you need to collect may be the last thing on your mind. But if you don't define your measurement goals from the beginning, you may not collect the right data to understand what's working and what isn't.

Big plans for the year ahead

Marketers who rethink measurement for a multi-screen world are reaping the benefits. In fact, leading marketers are 75% more likely than the mainstream to have moved to a more holistic model of measurement in the last two years, according to a recent study from Econsultancy and Google.3 But, getting a handle on all your data can take time. And that’s OK.

Google has some exciting product developments in the works that will help marketers automatically uncover insights and make smarter, faster decisions. In fact, we recently shared an Analytics 360 update that gives our customers the fastest access to the freshest first-party data we've ever offered.

The party’s just getting started. Stay tuned in for another exciting year.

Happy analyzing!

1 Google Surveys, U.S., "2016–2017 Marketing Analytics Challenges and Goals," Base: 203, marketing executives who have analytics or data-driven initiatives, Dec. 2016. 
2 Google Surveys, "Measurement in Campaign Timeline", Base: 1,092 marketing executives, U.S., August 2016. 
3 Econsultancy and Google, Analytics and Measurement Survey, 2016, Base: n=500 marketing and measurement executives at North American companies with over $250MM in revenues

A Love Story for the Ages: Marketing Commits to Measurement

Marketing and Measurement have been flirting for a long time now. But if these two finally get past the awkward stage and form a lasting bond, beautiful things can happen.

Working together, Marketing and Measurement can uncover insights that will improve your marketing, your customer experiences, and ultimately your business. To reach that next relationship level, Marketing can’t just casually date Measurement when it’s convenient. They need a real commitment.


The secret to a strong relationship
“For growth-driven marketers, measurement isn't an afterthought. It's one of the key reasons they’re succeeding and growing in an ever-changing, mobile-first world,” said Matt Lawson, Google's Director of Performance Ads Marketing.

Leading marketers are 75% more likely than the mainstream to have moved to a more holistic model of measurement in the last two years.1

When Marketing and Measurement “put a ring on it,” the future looks bright. Leading marketers are 75% more likely than the mainstream to have moved to a more holistic model of measurement in the last two years, according to a recent study from Econsultancy and Google. What’s more, the same study shows leading marketers were more than twice as likely to have significantly exceeded their top business goal in 2015.2

Don’t expect ‘happily ever after’
Engagement isn't where the story ends, of course.

Along the way, Marketing and Measurement may experience setbacks or failures as they test and learn from each other. In a recent survey of marketing decision makers with analytics initiatives, 61% of respondents said they struggled to access or integrate the data they needed last year.3

As with any relationship, Marketing and Measurement will need to “work on it.” And as this love story evolves, they will need to let go of traditional measurement practices and embrace a growth mindset that rethinks and remakes marketing measurement for the future.

If Marketing and Measurement are ready for a serious commitment at your company, here are three keys to a successful partnership:

  1. Collaborate to identify and measure what really matters to your business
  2. Communicate key insights uncovered from your data to help support decision making
  3. Take action to ensure those insights lead to better customer experiences


Download “Driving growth with marketing measurement in a mobile world,” a new report from Econsultancy and Google, for more best practices for marketing leaders.

1,2 Econsultancy and Google, Analytics and Measurement Survey, 2016, Base: n=500 marketing and measurement executives at North American companies with over $250MM in revenues 
3 Google Surveys, U.S., "2016–2017 Marketing Analytics Challenges and Goals," Base: 203, marketing executives who have analytics or data-driven initiatives, Dec. 2016. 

3 Ways to Better Support Marketing Decisions with Data

It’s often said that marketing is both an art and a science. The science side is increasingly in the spotlight as companies use data to optimize the customer experience at every touchpoint. But, ensuring that insights surfaced from that data lead to action requires the arts of communication and collaboration.

Highly data-driven organizations are three times more likely than others to report significant improvement in decision-making.1 Yet, 62% of executives still rely more on experience than data to make their decisions.2 When the stakes are high, decision-makers need information they can trust, easily consume, and understand.

Below are three ways marketing organizations can take action on their data to better support decisions:

1. Organize
Whether you have trouble connecting teams or data sources, silos can prevent your marketing organization from reaching current and potential customers. Data silos prevent you from gaining a holistic view of the customer journey. Organizational silos slow down the flow of information and ideas. What’s more, organizational silos are the number one barrier to improving customer experience.3

Outline a data strategy to organize and integrate information sources so you have the complete picture to your customers’ journeys. Collaboration and communication between departments is also key. Better yet, make sure marketers and analysts all have access to the same data sets and technology.

2. Visualize
Good data storytelling means making data easy to process. By taking the time to visualize your data, you’ll be able to tell a compelling story at a glance.

The goal of a revenue chart, heat map, or bar graph should be to simplify a complicated idea or communicate a body of information in seconds. Tools can help make data quickly actionable by taking multiple data sources and turning them into interactive reports and dashboards. Focus on reducing misinterpretations of your data and making it easy for decision makers to act.

3. Share
If the data can’t be understood, its insights cannot be acted on. But just as important, if the data and ideas are not shared with the right people at the right time, decision makers can’t fully leverage the power of marketing data.

“Real-time data is critically important. Otherwise, business leaders may be making decisions off data that is no longer relevant. The business landscape changes so quickly, and stale data may inadvertently lead to the wrong decision,” says Suzanne Mumford, head of marketing for the Google Analytics 360 Suite.

Look for solutions that offer data visualization and built-in collaboration capabilities so you can start practicing all three steps right away:
The companies that shine at optimizing the customer experience go beyond analytics and measurement. The whole organization collaborates in order to connect the data dots and communicate the meaning and impact of insights surfaced. Leading marketing organizations build a culture of growth — one that uses data, testing, and optimization to improve the customer experience every day — and share insights in ways that everyone across the organization can understand and act on. 


Download “Measuring Marketing Insights,” a collection of Harvard Business Review articles, to learn more about how to turn data into action.

A version of this article first appeared as sponsor content on HBR.org in August 2016.

1 PwC's Global Data and Analytics Survey, Big Decisions™, Base: 1,135 senior executives, Global, May 2016 
2 PwC's Global Data and Analytics Survey, Big Decisions™, Base: 2,106 senior executives, Global, May 2016 
3 Harvard Business Review Analytic Services, "Marketing in the Driver's Seat: Using Analytics to Create Customer Value," 2015.


Does Your Company Have a Data Science Strategy to Create Customer Value?

One of the biggest challenges for marketing leaders today is not finding or hiring analytic talent, according to new research cited in a Harvard Business Review report, but rather it is finding the right ways to move the mountains of data into insights and then into action.


The study concluded that marketing organizations need analytics professionals who understand data and the technologies that collect, house, and integrate it.1 That’s a given. But beyond that, experts say, executives need to place more emphasis on data science than on data scientists. Put another way: They should pay more attention to analyzing and acting on what they have now because analysis paralysis doesn’t create customer value.


“Data scientists are technicians who are very good at managing and manipulating data,” says Peter Fader, the Frances and Pei-Yuan Chia Professor of Marketing at the Wharton School of the University of Pennsylvania and author of Customer Centricity: Focus on the Right Customers for Strategic Advantage. “But data science is about looking for patterns, coming up with hypotheses, testing them, and acting on the results.”


Machine Learning
That’s where machine learning can speed analysis and augment your analytics team’s work — by crunching massive amounts of data to identify patterns and anomalies.


A type of artificial intelligence that uses algorithms that iteratively learn from data, machine learning can surface insights without being explicitly programmed where to look for them. It makes it more efficient to crunch massive amounts of data, calling out issues before you see them and providing answers to questions you may not have even thought to ask. This speed to insight allows marketers and analysts to do more with the data that comes in and see the whole picture of the customer journey.


Accenture Managing Partner Conor McGovern says, “If you can’t make the rubber hit the road with a disciplined approach to analytics, you will end up with customer experiences that aren’t as effective or engaging as they could be. As with any source of information, you need to embed and ingrain analytics into decision-making processes to obtain the desired results.”

“If you can’t make the rubber hit the road with a disciplined approach to analytics, you will end up with customer experiences that aren’t as effective or engaging as they could be.” —Conor McGovern, Managing Partner, Accenture

How Lenovo Harnessed Data to Create Customer Value
That targeted data science approach can give companies of any size a competitive advantage. Lenovo is a prime example of a marketing team that mastered the use of advanced technology and analytics tools, driving the company to create better value for its customers.


Ajit Sivadasan, Vice President and General Manager of Global E-commerce, realized that customer data was burgeoning and Lenovo needed to harness it. He began by establishing an analytics team in his e-commerce unit that today integrates and analyzes customer and marketing data from more than 60 sources worldwide. By integrating and analyzing Lenovo’s data, Sivadasan found that there are three main drivers of customer satisfaction that correlate to loyalty:
  1. Quality of the online experience. Sivadasan’s team tracks important variables such as how easy it is to find product information and whether Lenovo provides sufficient follow-up on the status of an order.
  2. Meeting commitments. This second driver includes how often the company misses promised ship dates.
  3. Experience with the product itself. By analyzing social media and direct customer feedback, Lenovo’s ecommerce team helps the company improve its products.
Competing on Analytics
In order to pursue an effective analytics strategy, executives have to clearly define business problems and what the questions are that analytics can answer. If executives don’t do this, they risk getting back data that sends the organization in the wrong direction.


For example, companies frequently find themselves puzzling over a dip in conversions among a desired demographic. Organizations need to be able to study the data, ask customers and potential customers the right questions, and experiment with offering different solutions to optimize the customer experience. Answers need to come in quickly so the organization can act quickly — ahead of the competition.


The speed to insight that machine learning offers can help companies act strategically on the data they have, homing in on the insights with impact, allowing executives to make informed decisions.


Says Joerg Niessing, Marketing Professor at INSEAD: “Executives still have to make the same strategic decisions that they have always made. They need to understand market dynamics and what competitors are doing — and then determine how the company should react. The only difference is that we now have a great deal more data and analytics to help make these decisions.”


Download “Measuring Marketing Insights: Turning Data Into Action,” an online Insight Center Collection of articles from Harvard Business Review, to learn more about using analytics to create customer value.


A version of this article first appeared as sponsor content on HBR.org in August 2016.


1Harvard Business Review Analytic Services, "Marketing in the Driver's Seat: Using Analytics to Create Customer Value," 2015.


Marketing Analytics Can Improve the Customer Experience

Almost every organization today is putting customer experience (CX) at the core of its strategy, aiming to provide products and services that meet customers at every touch point. In a crowded, multichannel marketplace, companies realize that a great customer experience — consistently delivering what customers want, when they want it — can be a powerful differentiator.


But many companies fail to deliver, according to research by Harvard Business Review Analytic Services (HBR-AS). Although half of surveyed business leaders say CX is a top-two differentiator for their business, just half of them said they perform well in it.


Although half of surveyed business leaders say CX is a top-two differentiator for their business, just half of them said they perform well in it.1


The problem isn’t access to data; most businesses said they collect mountains of information on their customers. The real obstacle to better customer experience, the research has found, is built into the way organizations share that data, analyze it, and work together.


Improving the customer experience is the end game, but getting there requires more than data. It requires the right data, from multiple channels, integrated to give a holistic picture of the customer journey. And that is where many companies struggle. HBR-AS found that fewer than a quarter of companies integrate customer data across channels to provide a single customer view.


Integrating data for customer value requires getting around organizational silos, which HBR-AS research has identified as the number one problem for companies struggling to improve their total customer experience. These silos prevent organizations from understanding the customers’ expectations at critical moments, and cultural resistance makes it tough to get the collaboration needed to solve the problem. As a result, respondents said the business doesn’t develop the right insights, get the information to the right people, or make the moves that could add real value.


Data-Driven Insight
By contrast, the study found that “best-in-class companies” — those with strong financial performance and competitive customer experiences — are more likely to have broken down those silos than are other organizations. And they use sophisticated analytics in a way that provides insights that open up the customer experience to the whole organization.


For example, at Progressive Insurance, the marketing team collected data on how mobile app users were behaving. These consumers, they discovered, wanted more than just helpful insurance quotes in the mobile app; they wanted to buy insurance on the spot. Progressive responded by giving them exactly what they wanted — the option to buy insurance — which vastly improved the customer experience and delivered a big win for the company. When a company creates customer value, the business benefits naturally follow.


Marketing Takes the Lead
But who is going to break down silos, connect the dots of the customer experience, and drive its improvement?


Today, marketing leaders need to make the case to the company that optimizing the customer experience requires breaking down silos and opening up collaboration, and shifting from a product-centric to a customer-centric approach, says Erich Joachimsthaler, author of Brand Leadership: Building Assets in an Information Economy. For example, a European beverage company assigns marketing groups to consumption moments, such as a night out, instead of brands and channels. The goal is to embed marketers deeply into a particular customer experience and focus them on each step of the customer journey.


“Marketing needs to connect the dots across all customer-facing functions of a company, including partners, in order to deliver real value instead of just communicating the brand,” says Joachimsthaler.


Robust analytics and insights have given marketing teams insight into how customers interact with brands, highlighting product preferences, purchase sequences, and so forth. And they reveal how top of the funnel marketing activities — such as an online display ad or TV commercial — tie in to in-store sales or an online website conversion. Measurement and analytics allow brand marketing and performance marketing to complement each other for the customers’ benefit.


Clearly the stakes are high, and marketing leaders and their teams are challenged to think in new ways. They don’t need more data; they need to find ways to identify and supply their organization with useful insights from that data.


Download “Measuring Marketing Insights,” a collection of Harvard Business Review Insight Center articles, to learn how companies are using data and marketing analytics to improve customer experience.


A version of this article first appeared as sponsor content on HBR.org in August 2016.

1Source: Harvard Business Review Analytic Services, "Marketing in the Driver's Seat: Using Analytics to Create Customer Value," 2015.

Rethinking Marketing Measurement from the Ground Up

From the moment smartphones touched human hands, they began to change how people interact with brands. It happened slowly at first … but today 91 percent of smartphone users turn to their phone for ideas while doing a task.1


Consumers expect more of marketers now. They expect brands to answer their questions and deliver the exact experiences they want at the moments they need to know, go, do, or buy things. They expect this across all screens and all touch points, over hundreds of interactions on their journeys.


This means there are three questions marketers should be asking:
  1. Is our brand useful to consumers at every touch point?
  2. How can we measure our usefulness?
  3. How can we be even more useful tomorrow?
To deliver, enterprise marketers need a new approach to measurement that shows them the entire customer journey and lets them see what’s working at each step along the way. The problem is that many of our measurement tools and metrics were created for a desktop world at a time when marketing focused on channel performance.


Today we need an understanding of our audiences across devices and channels. That means taking into account the impact of mobile online and offline, quickly spotting insights, and trying new ways to provide better customer experiences.


Breaking Down the Data Silos
A car shopper today can have hundreds of digital interactions — or in this case 900-plus interactions — before buying. Each one of those moments is an opportunity for a brand to be useful. And each one leaves its own data trail.


But companies that look at data channel by channel, in a silo, can miss the forest for the trees. We need to break down measurement and strategy silos and create an integrated view of the consumer’s journey. It’s likely you have found yourself in a debate with colleagues about metrics and campaign results and thought, “It’s not about what matters to channel X — we need to zoom out to see the whole picture and do what’s best for our customers.”


The truth is that the future of enterprise measurement depends on people and departments, tools and systems, all talking to each other and sharing insights in real time about what customers want most.


From Silos to Synthesis
So if we know that one session and one click doesn’t tell the full story … and if we want to connect consumer behavior dots over time … where do we start? The best place is with the classic question “What outcomes are we trying to achieve?” But then instead of saying “How do we reach our goals?” let’s ask: “How do we measure success?”


Key performance indicators (KPIs) have to reflect the new objectives of the mobile-first world. Marketers who link their metrics to business results are three times more likely to hit revenue goals than those who don’t, according to a Forrester report.2


And while more data is always great, what marketers really need are more insights. That’s why the question “What’s working?” is so crucial. If that car buyer sees a TV commercial for a small sedan or pickup truck and searches for reviews and mileage ratings on his or her mobile phone, watches videos about special features, visits a dealer for a test-drive, and then finally buys a month later, marketers must find a way to bridge the gaps between TV airings and search lift, and display ads and video views, to see where the real influence happened.


How much credit should mobile get? How many touch points were there? Marketers need to know. And if the gaps can’t be filled perfectly, we should get comfortable with new proxies that will give us a sturdy estimate instead.


Marketers, Mobile, and Tomorrow
Evolution is a good thing, even if measuring in new ways can be awkward at first. Measurement and marketing go hand in hand — both have to keep pace with the vastly rising expectations of mobile-first consumers. Discomfort means you’re working to stay ahead.


So, take stock of what you measure and how you measure. Ask if those KPIs account for all the ways consumers may engage with your brand. If not, ask yourself why you’re measuring them in the first place. Focus on the outcomes you want and map your new metrics back to your strategy.


Smartphones have already changed how people interact with brands, and they’ll surely alter those interactions even more in years to come. We can’t predict how. But we can say that the brands that measure the results of those changes first will have a major edge over those that don’t. Measurement isn’t what happens at the end; it’s where the smarter and more successful future begins.


Download “Measuring Marketing Insights,” a collection of Harvard Business Review Insight Center articles, to read more about best practices and case studies on enterprise marketing and analytics.


A version of this article first appeared as sponsor content on HBR.org in August 2016.


1Source: Google/Ipsos, “Consumers in the Micro-Moment” study, March 2015.
2Source: Forrester, “Discover How Marketing Analytics Increases Business Performance,” March 2016