Today we're launching the beta of our new Shopping Insights tool, another step towards helping retailers connect with consumers in moments that matter, by making data about shopping habits and preferences more accessible.
Shopping Insights shows the products people are searching for across cities, time and devices. While 87% of shopping research happens online, 92% of goods are still sold in retail stores. By better understanding user’s shopping intent online, retailers can make more informed local merchandising and marketing decisions for their stores.
The Shopping Insights tool estimates popularity and trends for a given product by aggregating keyword data from the millions of searches consumers are doing to shop for that product. Further, you can see data for every city available for targeting in AdWords, and compare mobile to desktop patterns to better serve customers near your stores. Here’s a demo of how it works:
Observe and meet local demand
Shopping Insights lets retailers analyze product interest by city and time to understand local demand. As an example, let’s take a look at search interest in Halloween costumes. While Elsa and Olaf from Frozen set the pace last year, this year the battle is shaping up between Minions and Star Wars. Minions were initially more popular, with search interest for Minion costumes over 2.5X higher than Star Wars costumes in July. Following the release of new footage for the next Star Wars movie in late August, search interest for Star Wars costumes briefly overtook Minions, closing the gap to a 10% difference in September.
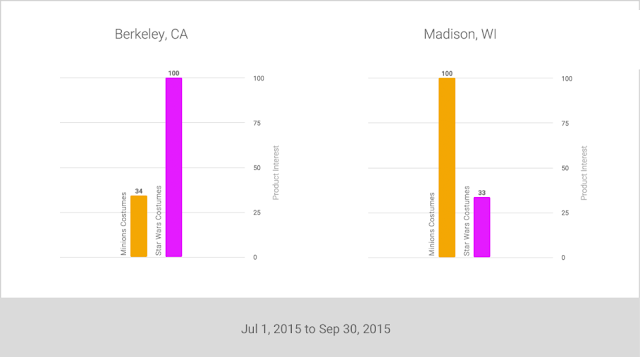
 However, when looking at the city level, we can see significant variance in regional preferences. Let’s compare two popular college towns, Berkeley, CA and Madison, WI. In Berkeley, for example, Star Wars costumes are nearly 3x more popular than Minion costumes, but in Madison, WI Minion costumes are 3x more popular than Star Wars.
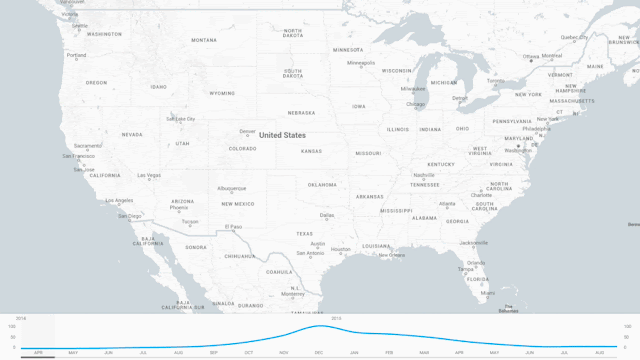
 In another example of regional trends, interest in emoji joggers first appeared near Atlanta, then moved to New York City over the next several months, peaking during the holiday season last year. Consumers on the west coast haven’t caught on to the trend yet. This type of insight can help you understand how to meet demand for regionally popular products, while carrying less inventory in regions with less interest.
 See interest by mobile, desktop, or both
Shopping Insights also gives you a clearer look at the devices people are using during their “I-want-to-know, go, do, and buy” moments, so you can plan your campaigns for the right screens. For instance, searches for Disney Vans shoes have grown a whopping 10X since the launch of the “Young at Heart” line in May. And fans of Disney Vans clearly prefer to shop on mobile, using smartphones 3X more often than desktop to search for the popular shoes.
 The Californian roots of both Disney and Vans are also visible in the data; interest was 2X higher in Los Angeles than New York, even though New York has twice the population. In fact, 38% of all searches came from California.
Understand nationwide, regional, and local outliers with featured stories
We will also release featured stories highlighting interesting trends across the nation, based on data mined by our teams. Check out the console war story between ‘xbox one’ and ‘ps4’ or the rising popularity of Birkenstock sandals. We hope these stories inspire your own creative uses of Shopping Insights.
Getting started with Shopping Insights
Shopping Insights Beta is now available in the U.S., covering the 5,000+ most popular products on Google Shopping between April 01, 2014 to September 30, 2015. In the coming months, we'll have fresh updates with new data, insights and stories. It's all part of our long-term commitment to help retailers succeed with deeper insights about users’ intent and context.
To get started visit: shopping.thinkwithgoogle.com.
Posted by Jonathan Alferness, Vice President, Product Management, Google Shopping
Shopping Insights shows the products people are searching for across cities, time and devices. While 87% of shopping research happens online, 92% of goods are still sold in retail stores. By better understanding user’s shopping intent online, retailers can make more informed local merchandising and marketing decisions for their stores.
The Shopping Insights tool estimates popularity and trends for a given product by aggregating keyword data from the millions of searches consumers are doing to shop for that product. Further, you can see data for every city available for targeting in AdWords, and compare mobile to desktop patterns to better serve customers near your stores. Here’s a demo of how it works:
Observe and meet local demand
Shopping Insights lets retailers analyze product interest by city and time to understand local demand. As an example, let’s take a look at search interest in Halloween costumes. While Elsa and Olaf from Frozen set the pace last year, this year the battle is shaping up between Minions and Star Wars. Minions were initially more popular, with search interest for Minion costumes over 2.5X higher than Star Wars costumes in July. Following the release of new footage for the next Star Wars movie in late August, search interest for Star Wars costumes briefly overtook Minions, closing the gap to a 10% difference in September.


Shopping Insights also gives you a clearer look at the devices people are using during their “I-want-to-know, go, do, and buy” moments, so you can plan your campaigns for the right screens. For instance, searches for Disney Vans shoes have grown a whopping 10X since the launch of the “Young at Heart” line in May. And fans of Disney Vans clearly prefer to shop on mobile, using smartphones 3X more often than desktop to search for the popular shoes.

Understand nationwide, regional, and local outliers with featured stories
We will also release featured stories highlighting interesting trends across the nation, based on data mined by our teams. Check out the console war story between ‘xbox one’ and ‘ps4’ or the rising popularity of Birkenstock sandals. We hope these stories inspire your own creative uses of Shopping Insights.
Getting started with Shopping Insights
Shopping Insights Beta is now available in the U.S., covering the 5,000+ most popular products on Google Shopping between April 01, 2014 to September 30, 2015. In the coming months, we'll have fresh updates with new data, insights and stories. It's all part of our long-term commitment to help retailers succeed with deeper insights about users’ intent and context.
To get started visit: shopping.thinkwithgoogle.com.
Posted by Jonathan Alferness, Vice President, Product Management, Google Shopping
