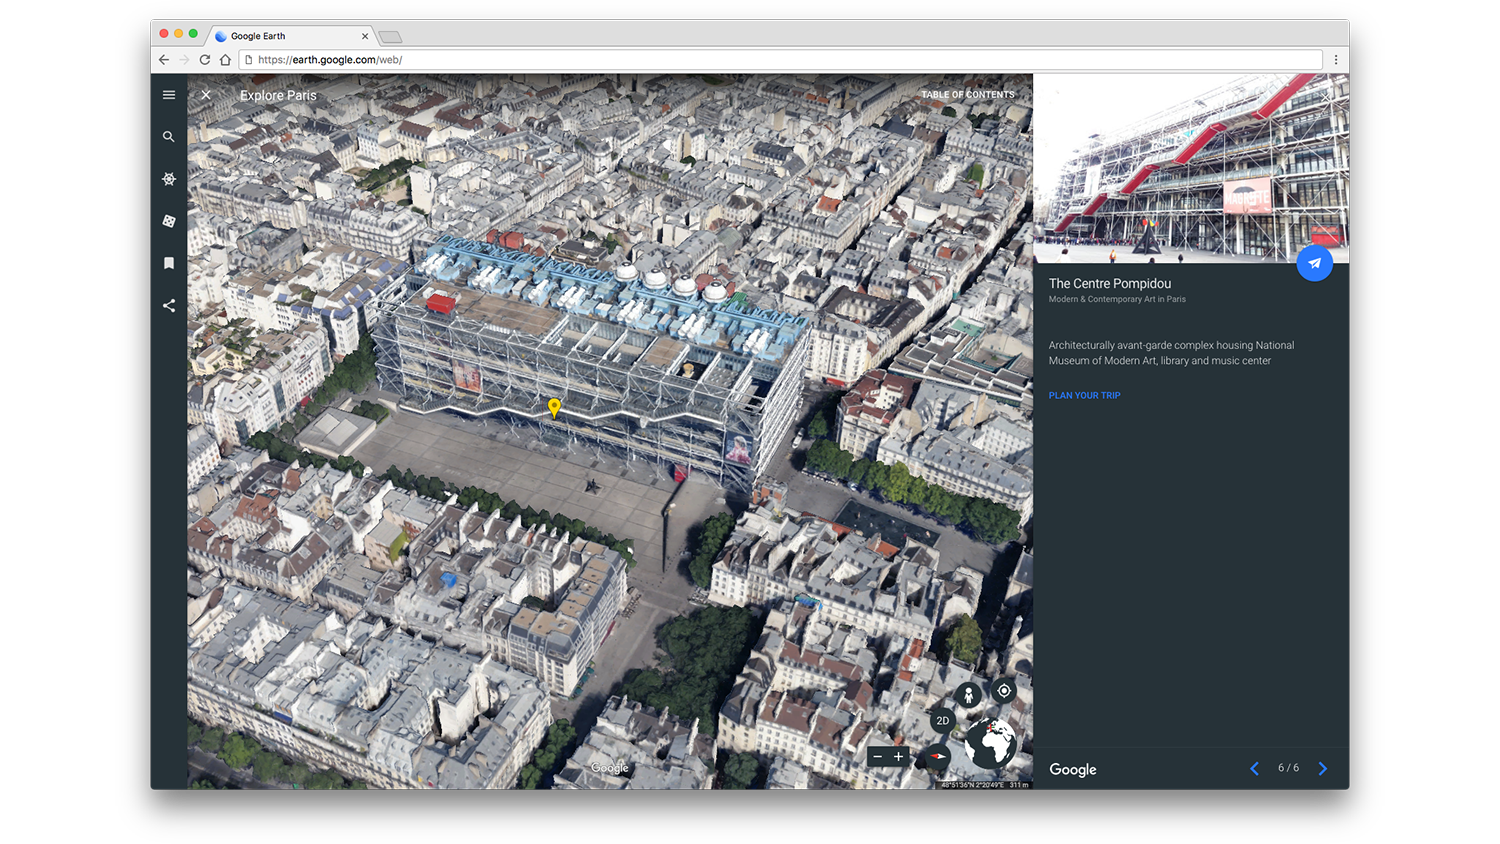
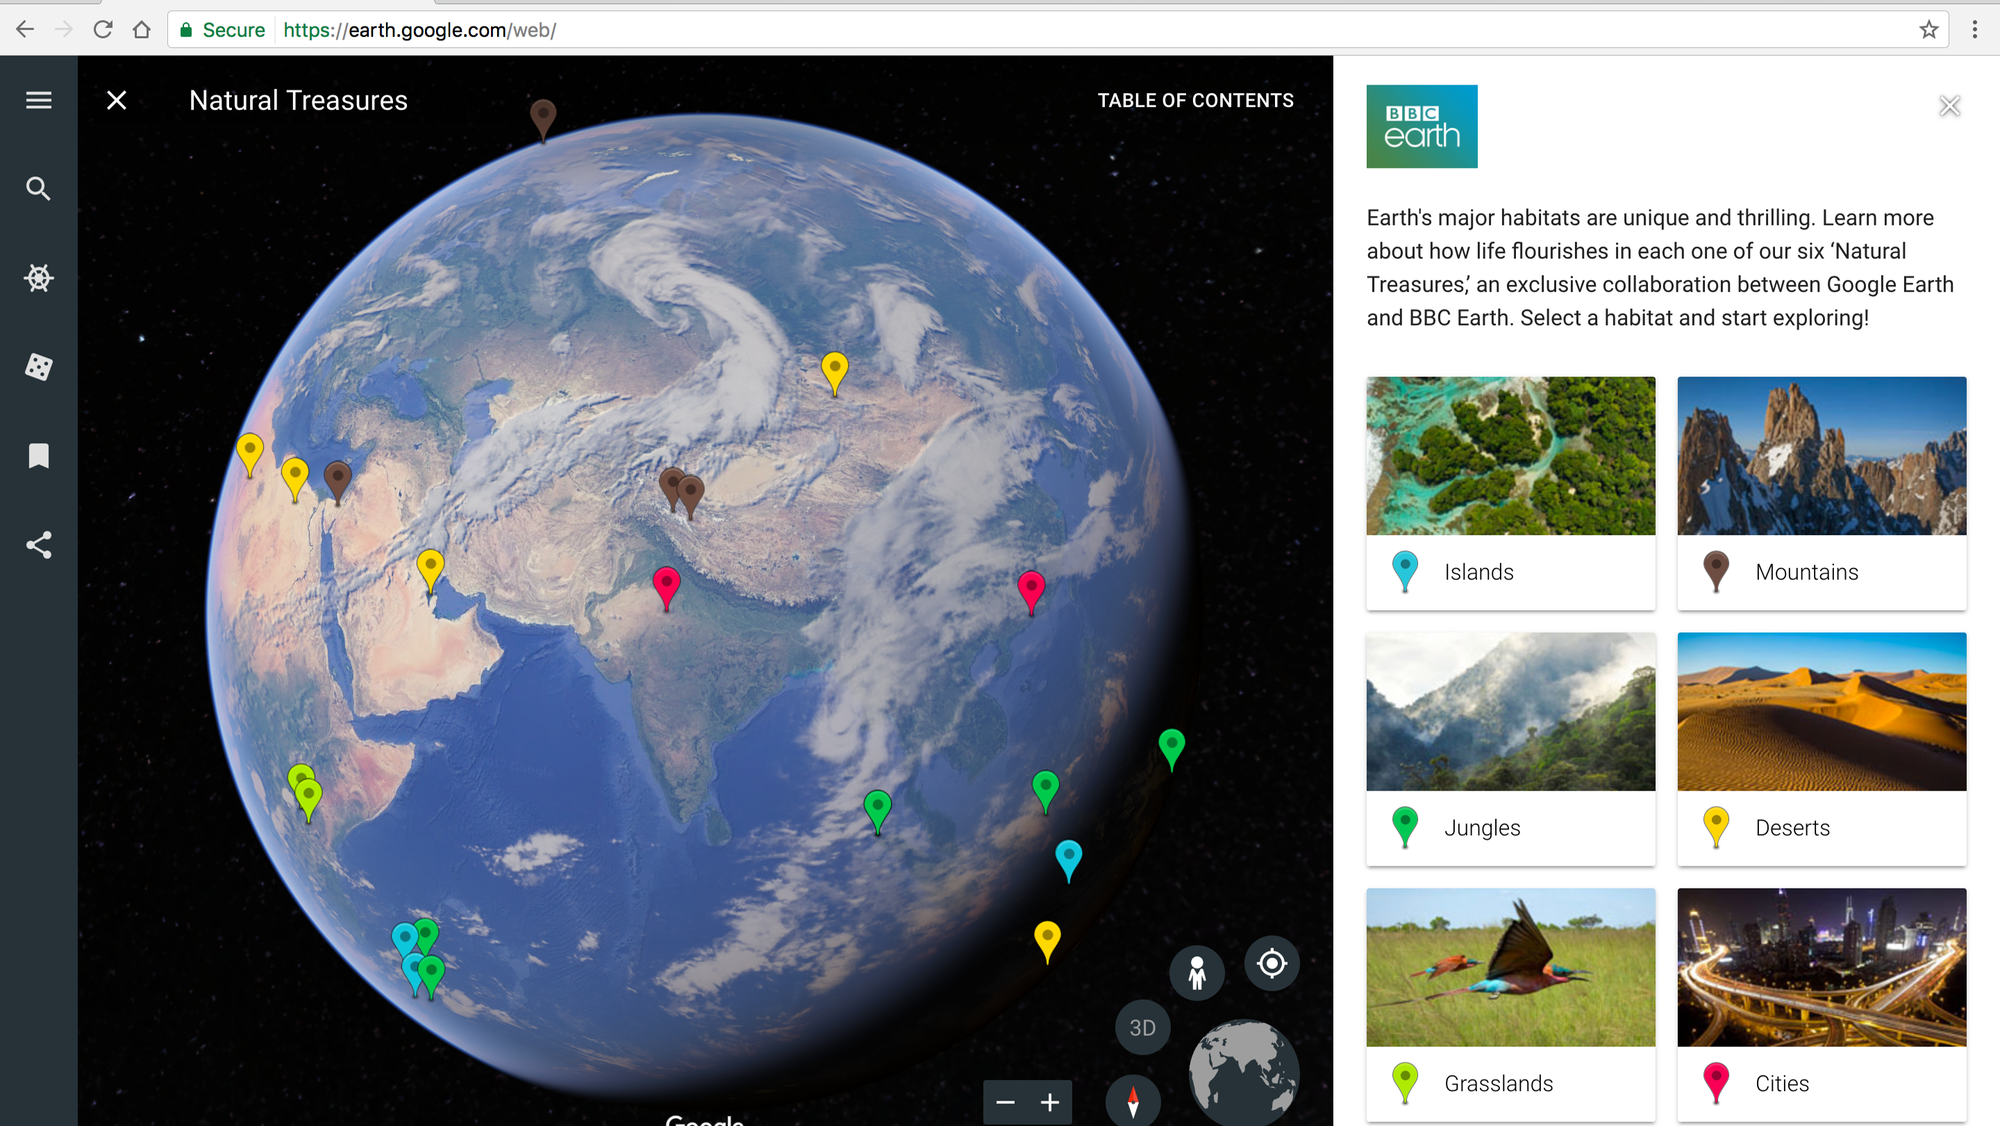
This week we’re giving you a taste of what you can find in Voyager, a showcase of interactive tours and stories from experts, nonprofits and more in the new Google Earth.
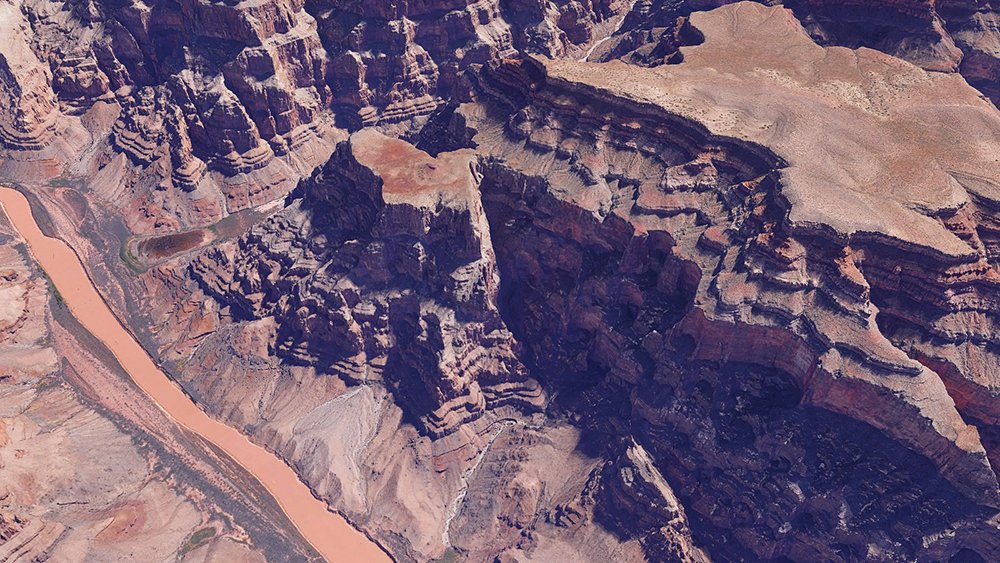
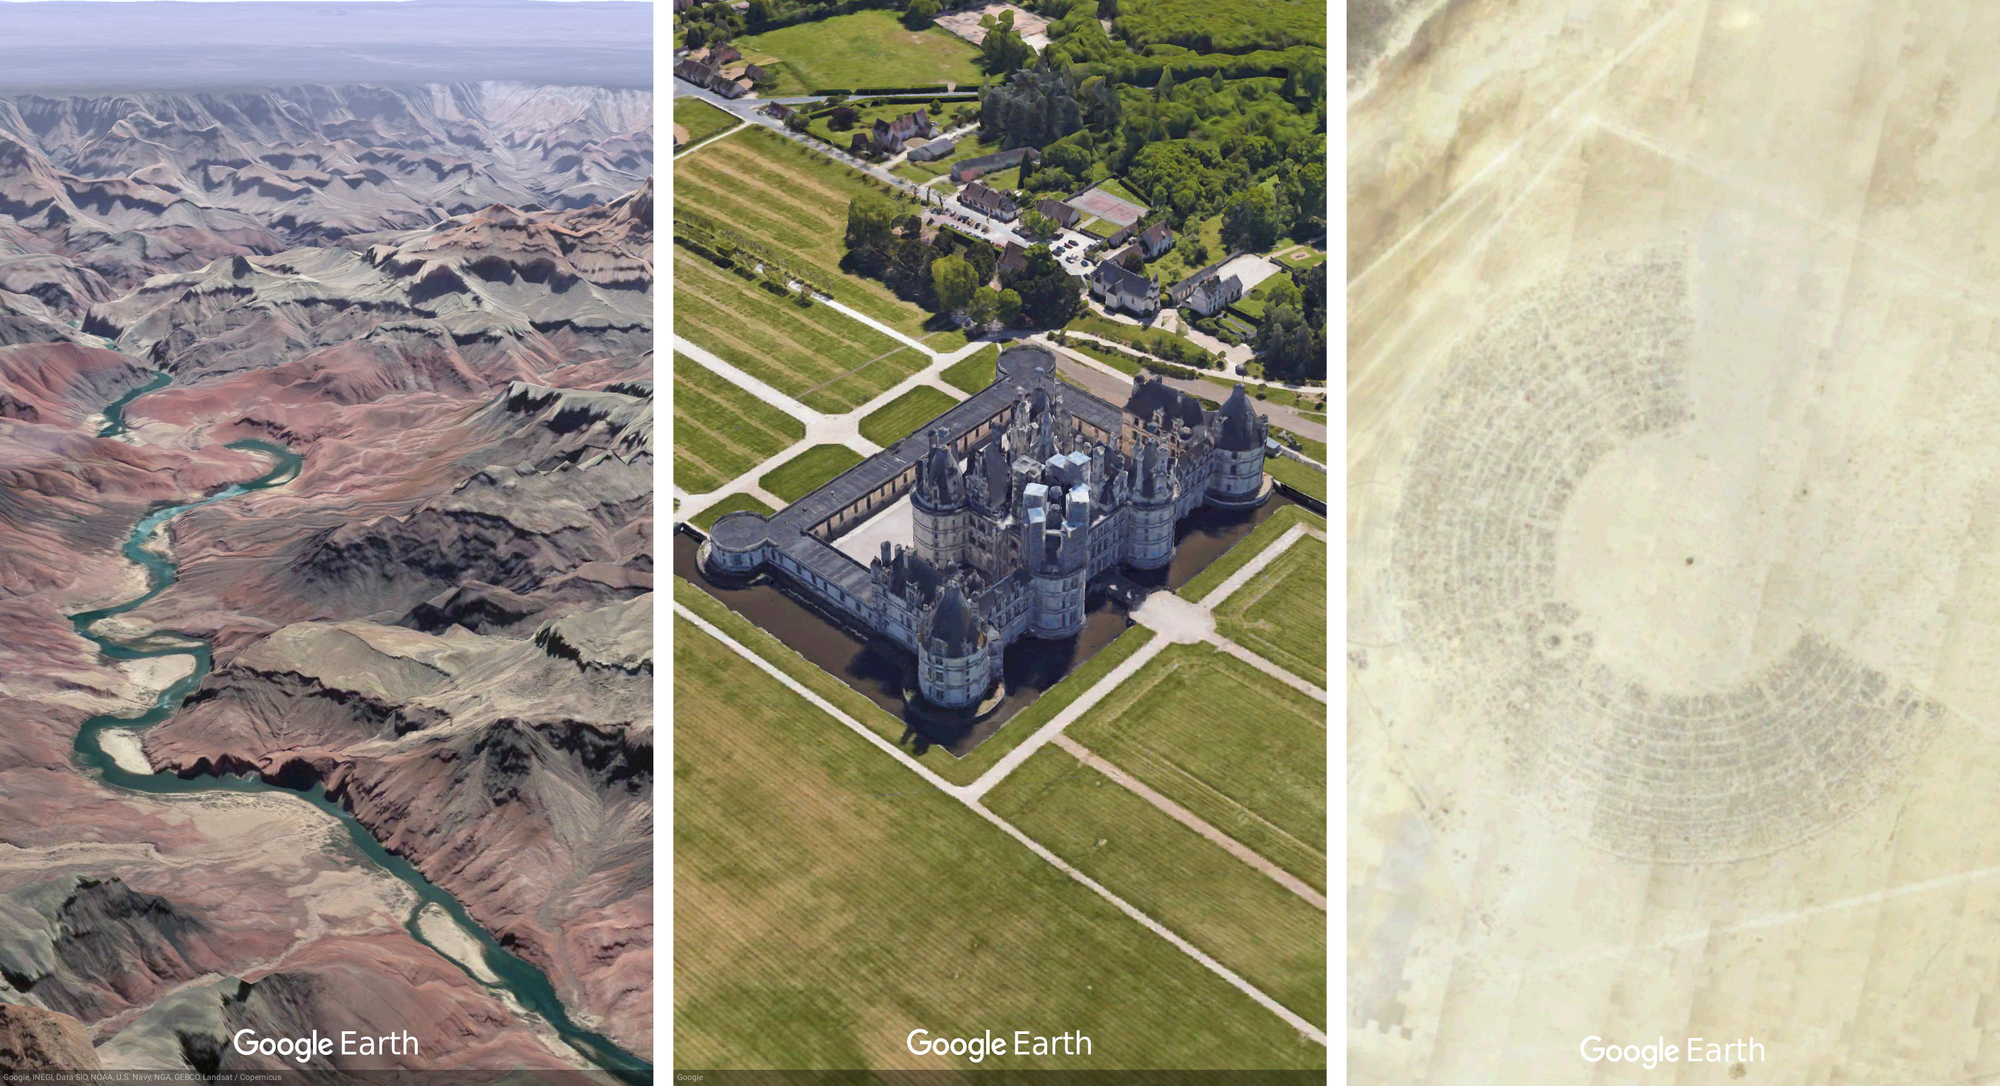
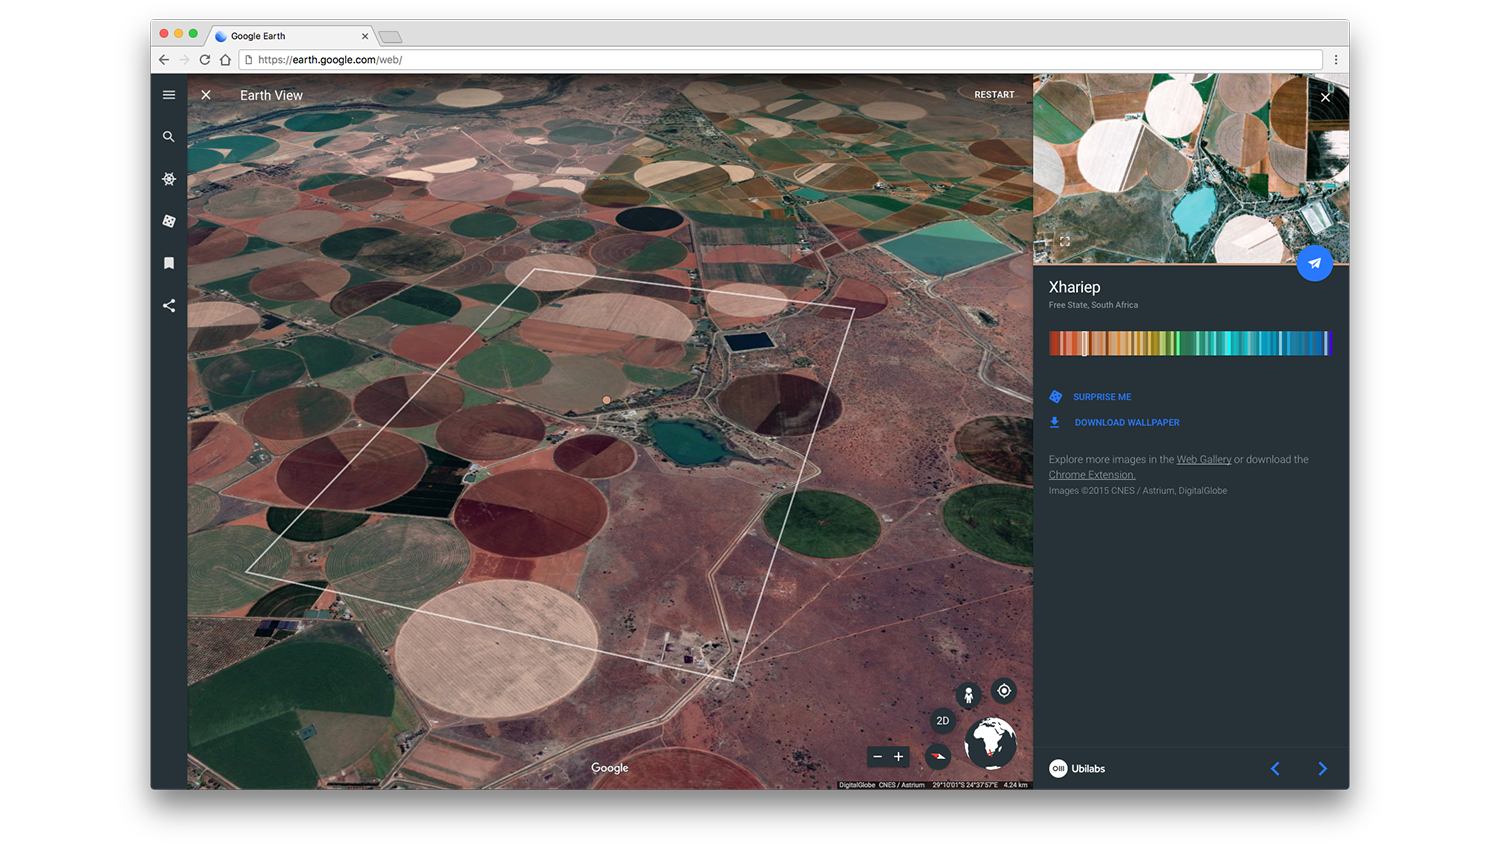
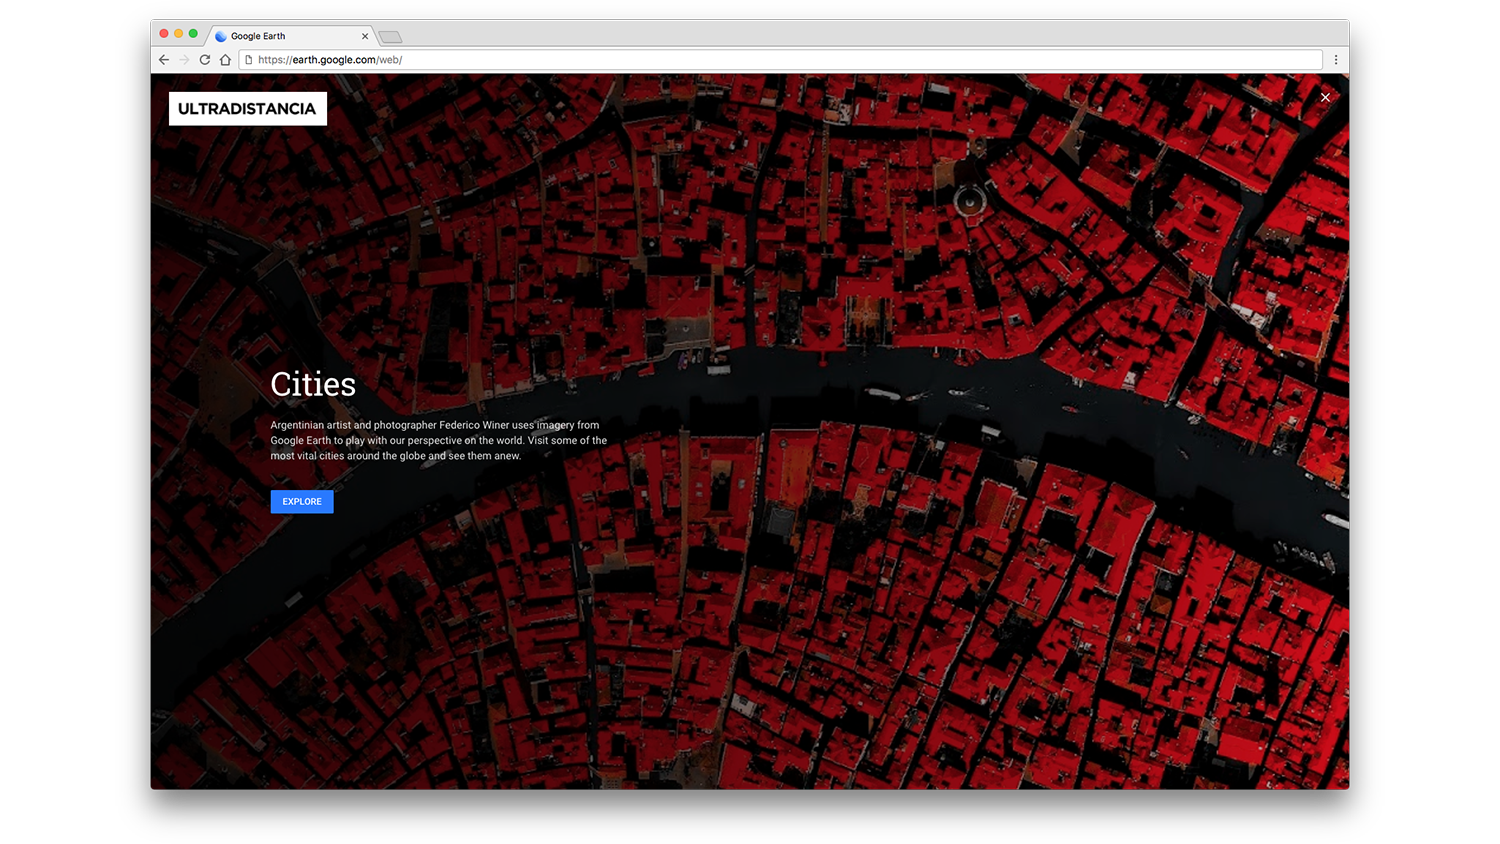
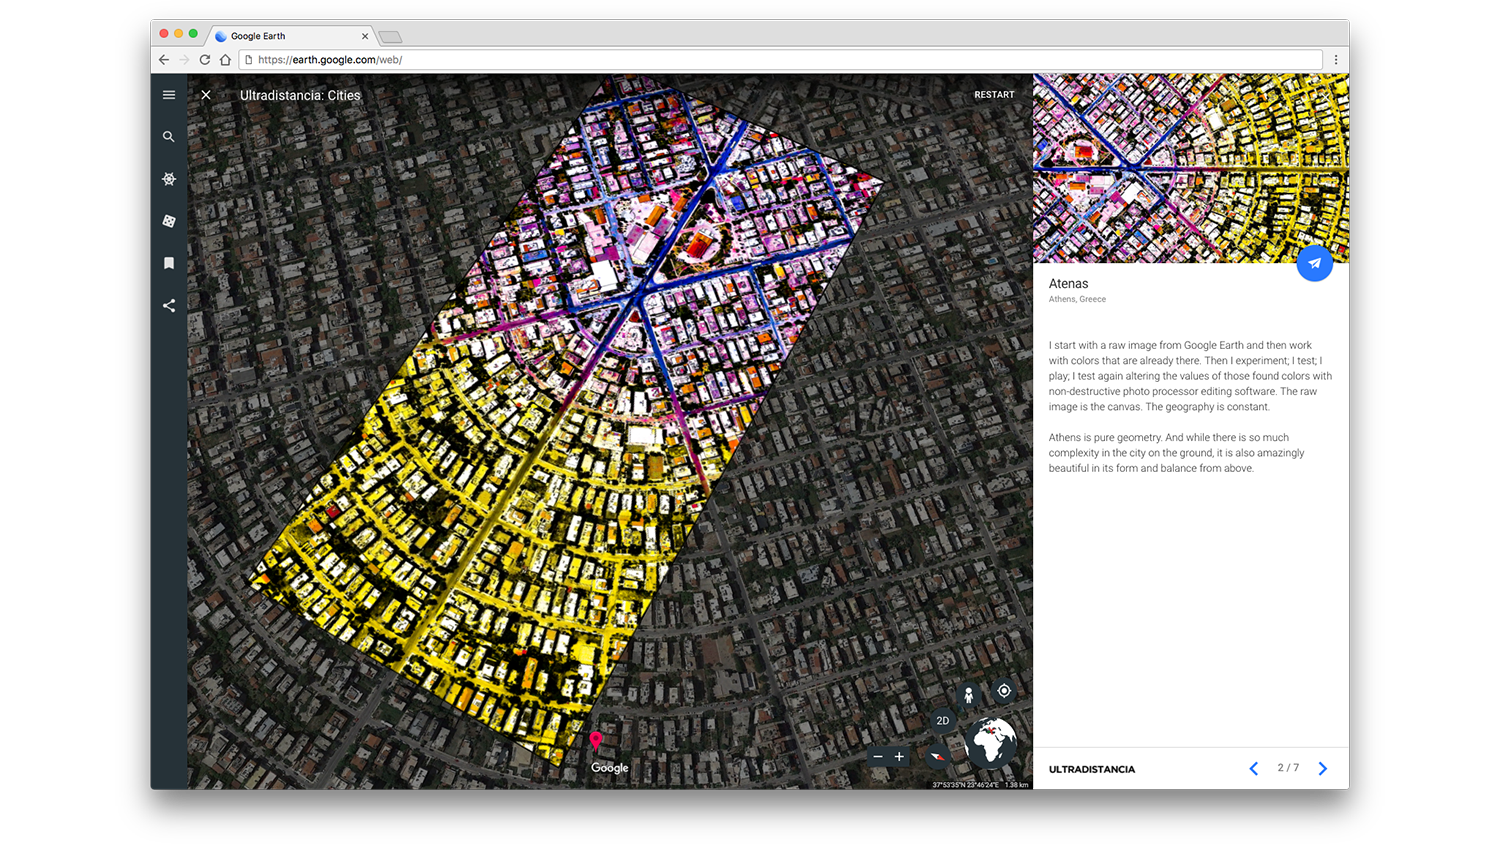
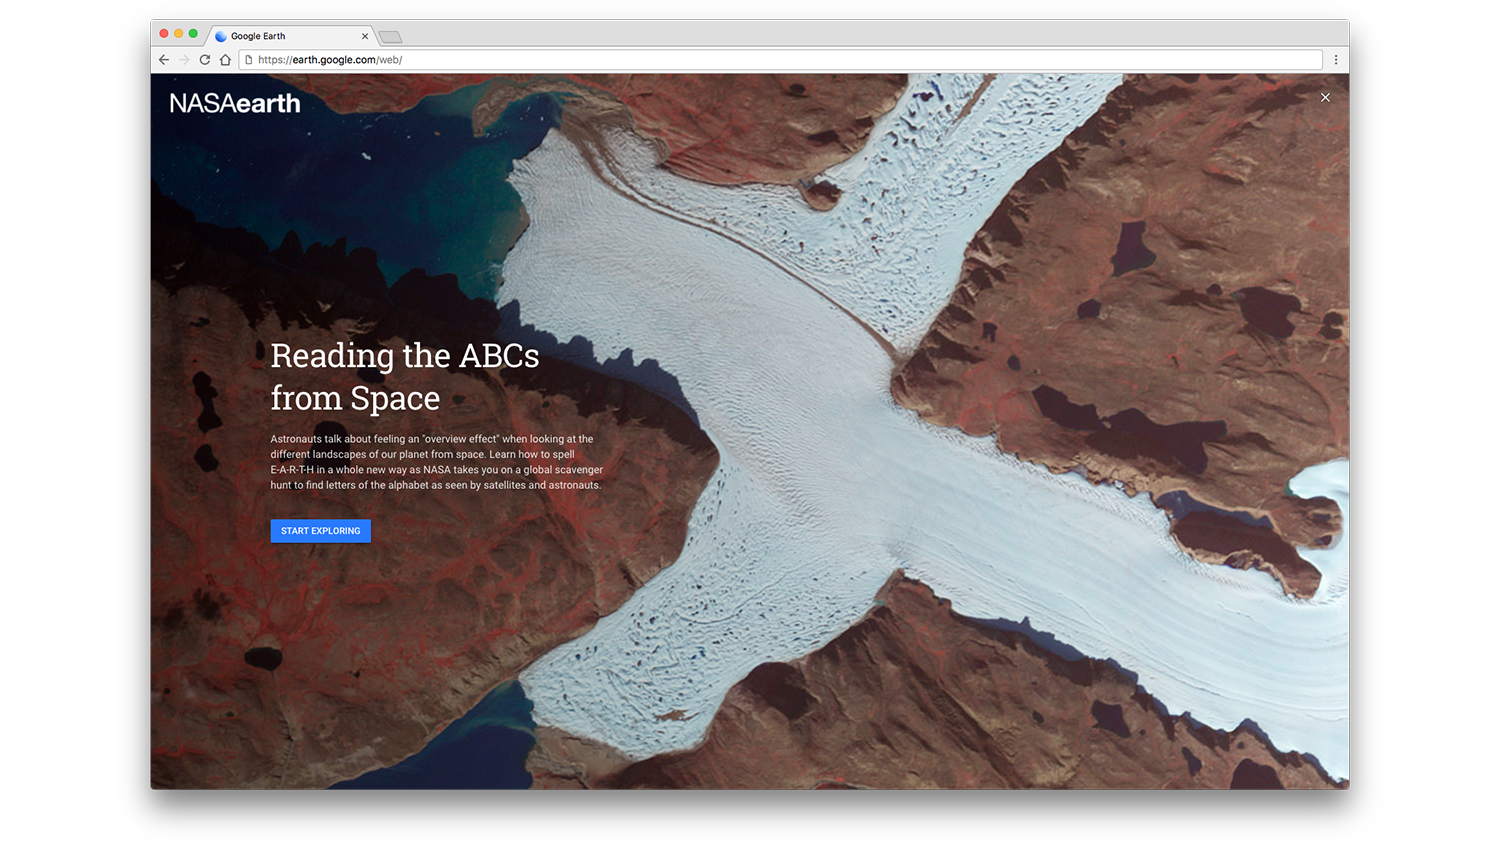
Earth Day is just a few days away. And we can think of few better ways to celebrate than by appreciating our planet’s beauty from that most unique perspective: Space. Today in Voyager, go on a planetary-wide scavenger hunt with NASA Earth imagery; see geographies in a new way with Federico Winer’s Ultradistancia; and admire stunning landscapes with Earth View by Ubilabs.


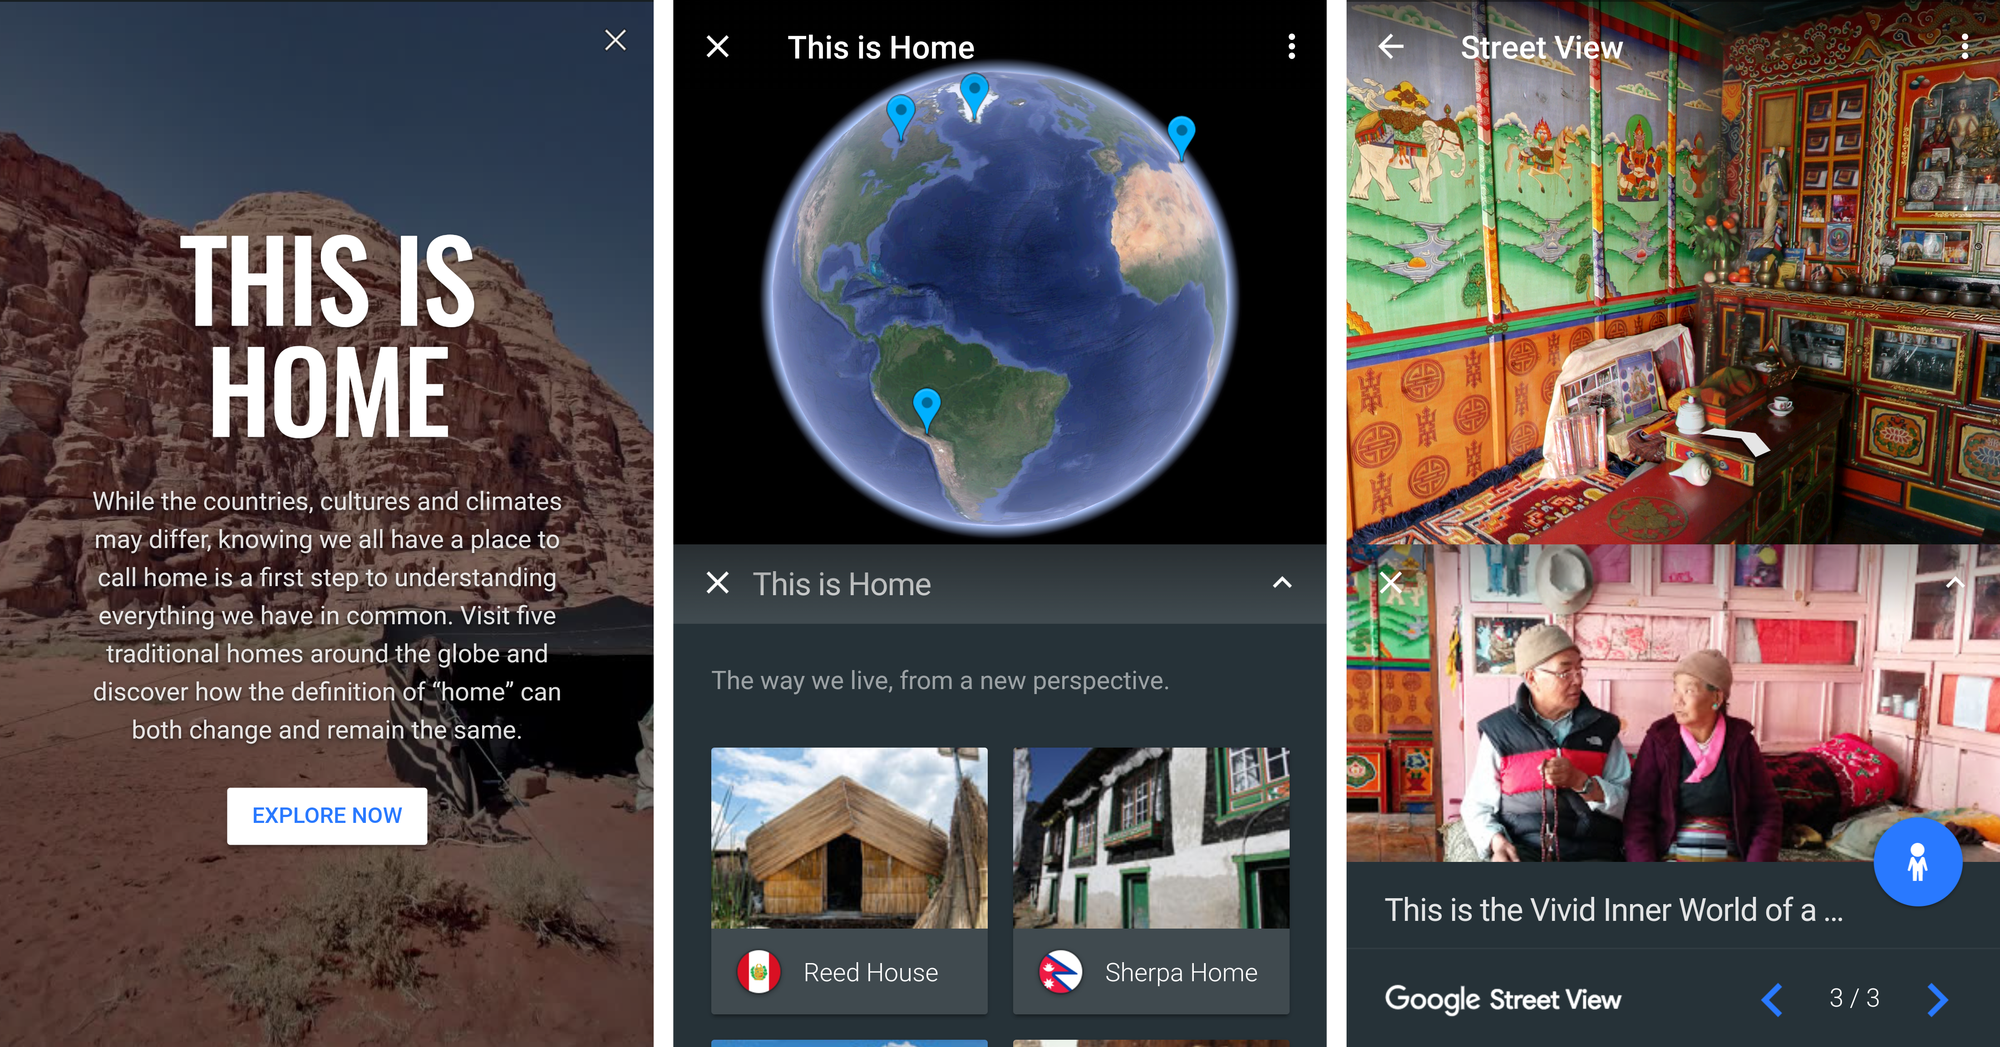
Explore the world from a distance, and see a few things closer to home—like cherry blossoms in full bloom, tropical islands and the wonders of the ancient world.