Tag Archives: Compute

Kubernetes best practices: upgrading your clusters with zero downtime


Editor’s note: Today is the final installment in a seven-part video and blog series from Google Developer Advocate Sandeep Dinesh on how to get the most out of your Kubernetes environment.

Everyone knows it’s a good practice to keep your application up to date to optimize security and performance. Kubernetes and Docker can make performing these updates much easier, as you can build a new container with the updates and deploy it with relative ease.

Just like your applications, Kubernetes is constantly getting new features and security updates, so the underlying nodes and Kubernetes infrastructure need to be kept up to date as well.

In this episode of Kubernetes Best Practices, let’s take a look at how Google Kubernetes Engine can make upgrading your Kubernetes cluster painless!

The two parts of a cluster

When it comes to upgrading your cluster, there are two parts that both need to be updated: the masters and the nodes. The masters need to be updated first, and then the nodes can follow. Let’s see how to upgrade both using Kubernetes Engine.

Upgrading the master with zero downtime
Kubernetes Engine automatically upgrades the master as point releases are released, however it usually won’t upgrade to a new version (for example, 1.7 to 1.8) automatically. When you are ready to upgrade to a new version, you can just click the upgrade master button in the Kubernetes Engine console.

However, you may have noticed that the dialog box says the following:

“Changing the master version can result in several minutes of control plane downtime. During that period you will be unable to edit this cluster.”

When the master goes down for the upgrade, deployments, services, etc. continue to work as expected. However, anything that requires the Kubernetes API stops working. This means kubectl stops working, applications that use the Kubernetes API to get information about the cluster stop working, and basically you can’t make any changes to the cluster while it is being upgraded.

So how do you update the master without incurring downtime?


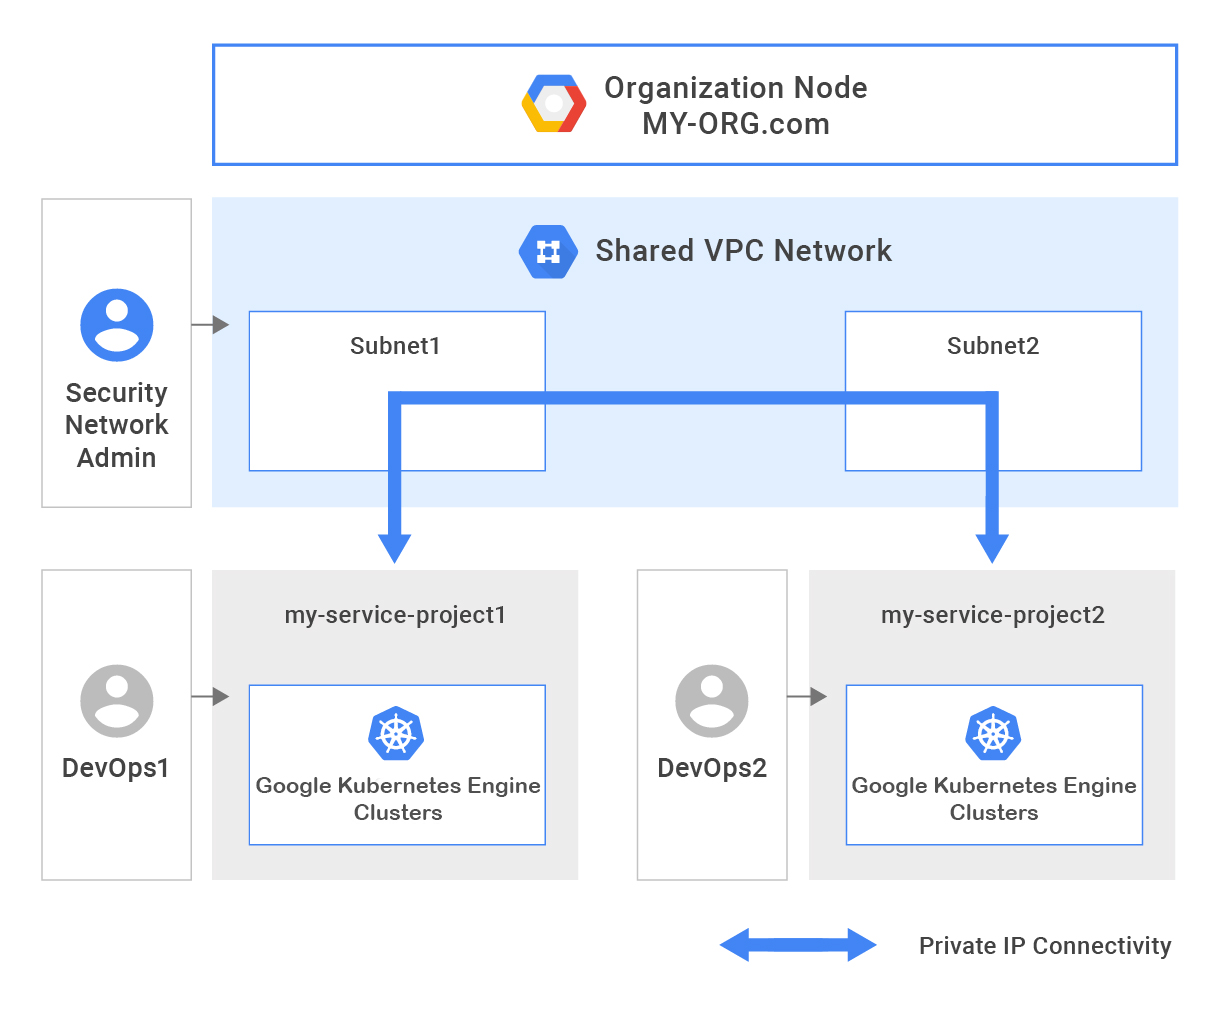
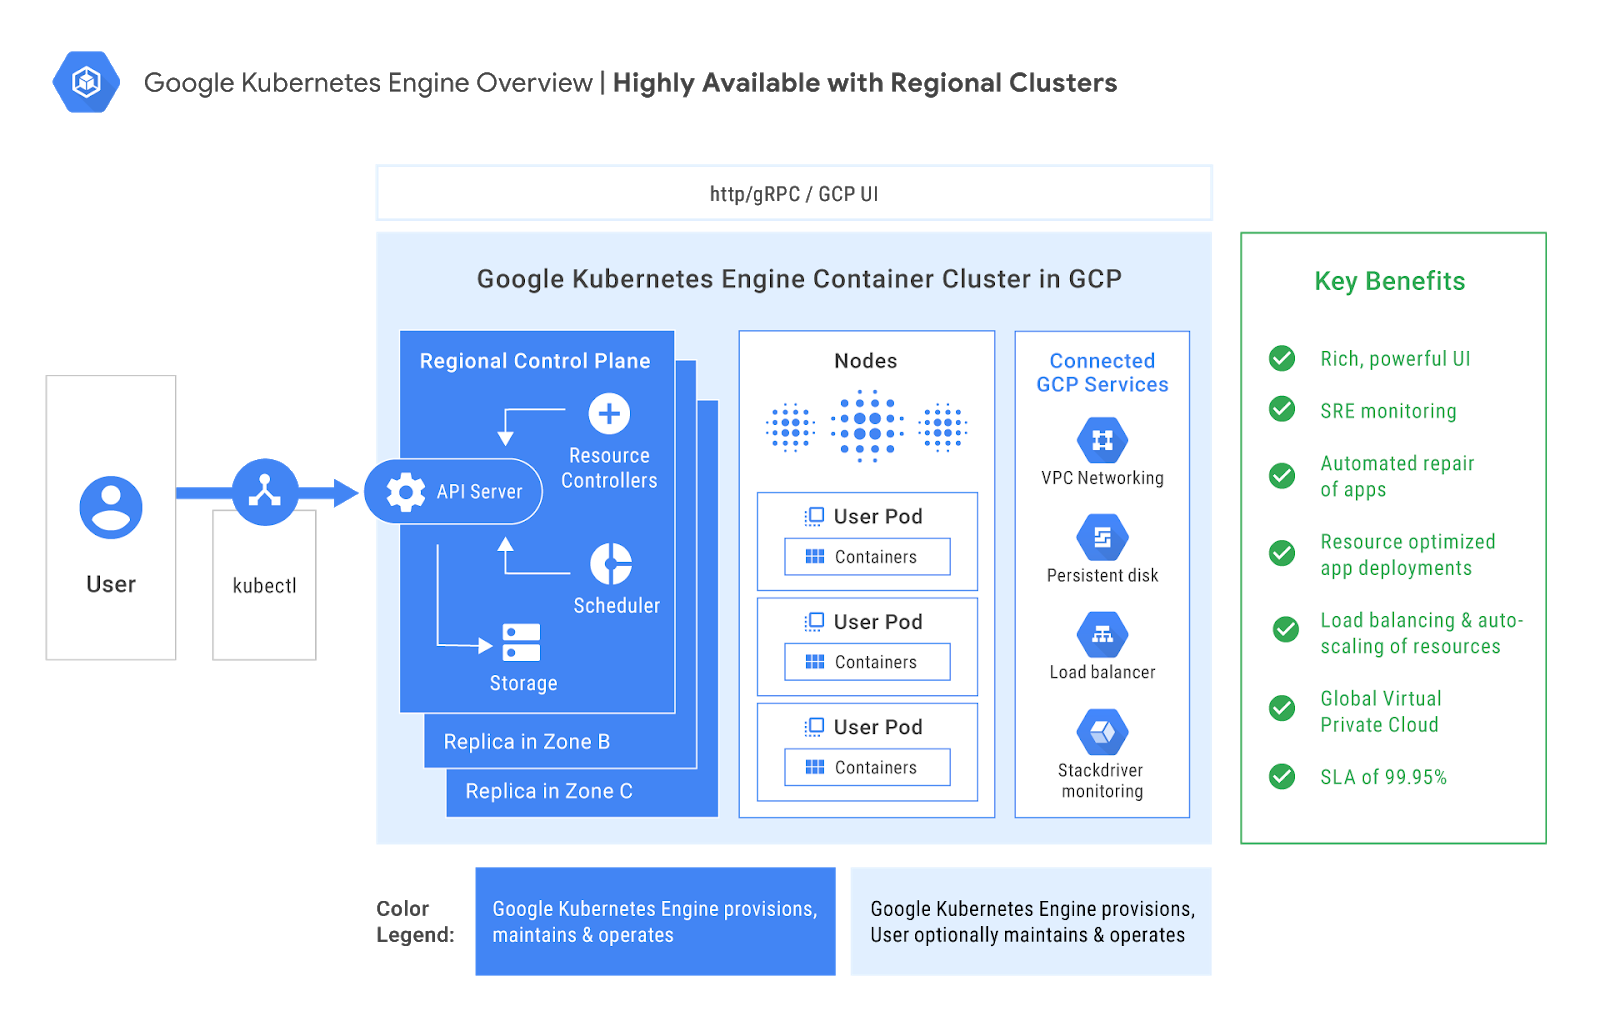
Highly available masters with Kubernetes Engine regional clusters

While the standard “zonal” Kubernetes Engine clusters only have one master node backing them, you can create “regional” clusters that provide multi-zone, highly available masters.

When creating your cluster, be sure to select the “regional” option:

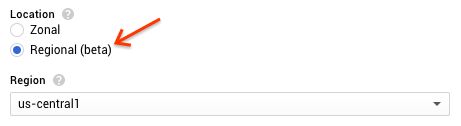
And that’s it! Kubernetes Engine automatically creates your nodes and masters in three zones, with the masters behind a load-balanced IP address, so the Kubernetes API will continue to work during an upgrade.

Upgrading nodes with zero downtime

When upgrading nodes, there are a few different strategies you can use. There are two I want to focus on:
  1. Rolling update
  2. Migration with node pools
Rolling update
The simplest way to update your Kubernetes nodes is to use a rolling update. The is the default upgrade mechanism Kubernetes Engine uses to update your nodes.

A rolling update works in the following way. One by one, a node is drained and cordoned so that there are no more pods running on that node. Then the node is deleted, and a new node is created with the updated Kubernetes version. Once that node is up and running, the next node is updated. This goes on until all nodes are updated.

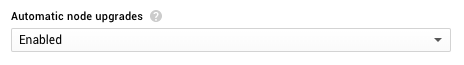
You can let Kubernetes Engine manage this process for you completely by enabling automatic node upgrades on the node pool.

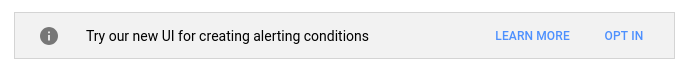
If you don’t select this, the Kubernetes Engine dashboard alerts you when an upgrade is available:

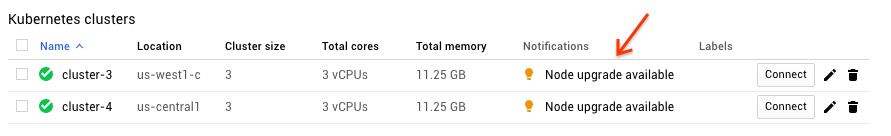
Just click the link and follow the prompt to begin the rolling update.

Warning: Make sure your pods are managed by a ReplicaSet, Deployment, StatefulSet, or something similar. Standalone pods won’t be rescheduled!

While it’s simple to perform a rolling update on Kubernetes Engine, it has a few drawbacks.

One drawback is that you get one less node of capacity in your cluster. This issue is easily solved by scaling up your node pool to add extra capacity, and then scaling it back down once the upgrade is finished.

The fully automated nature of the rolling update makes it easy to do, but you have less control over the process. It also takes time to roll back to the old version if there is a problem, as you have to stop the rolling update and then undo it.

Migration with node pools
Instead of upgrading the “active” node pool as you would with a rolling update, you can create a fresh node pool, wait for all the nodes to be running, and then migrate workloads over one node at a time.

Let’s assume that our Kubernetes cluster has three VMs right now. You can see the nodes with the following command:
kubectl get nodes
NAME                                        STATUS  AGE
gke-cluster-1-default-pool-7d6b79ce-0s6z    Ready   3h
gke-cluster-1-default-pool-7d6b79ce-9kkm    Ready   3h
gke-cluster-1-default-pool-7d6b79ce-j6ch    Ready   3h


Creating the new node pool
To create the new node pool with the name “pool-two”, run the following command:
gcloud container node-pools create pool-two

Note: Remember to customize this command so that the new node pool is the same as the old pool. You can also use the GUI to create a new node pool if you want.

Now if you check the nodes, you will notice there are three more nodes with the new pool name:
$ kubectl get nodes
NAME                                        STATUS  AGE
gke-cluster-1-pool-two-9ca78aa9–5gmk        Ready   1m
gke-cluster-1-pool-two-9ca78aa9–5w6w        Ready   1m
gke-cluster-1-pool-two-9ca78aa9-v88c        Ready   1m
gke-cluster-1-default-pool-7d6b79ce-0s6z    Ready   3h
gke-cluster-1-default-pool-7d6b79ce-9kkm    Ready   3h
gke-cluster-1-default-pool-7d6b79ce-j6ch    Ready   3h

However, the pods are still on the old nodes! Let’s move them over.

Drain the old pool
Now we need to move work to the new node pool. Let’s move over one node at a time in a rolling fashion.

First, cordon each of the old nodes. This will prevent new pods from being scheduled onto them.

kubectl cordon <node_name>
Once all the old nodes are cordoned, pods can only be scheduled on the new nodes. This means you can start to remove pods from the old nodes, and Kubernetes automatically schedules them on the new nodes.

Warning: Make sure your pods are managed by a ReplicaSet, Deployment, StatefulSet, or something similar. Standalone pods won’t be rescheduled!

Run the following command to drain each node. This deletes all the pods on that node.

kubectl drain <node_name> --force


After you drain a node, make sure the new pods are up and running before moving on to the next one.

If you have any issues during the migration, uncordon the old pool and then cordon and drain the new pool. The pods get rescheduled back to the old pool.

Delete the old pool
Once all the pods are safely rescheduled, it is time to delete the old pool.

Replace “default-pool” with the pool you want to delete.

gcloud container node-pools delete default-pool


You have just successfully updated all your nodes!

Conclusion


By using Kubernetes Engine, you can keep your Kubernetes cluster up to date with just a few clicks.

If you are not using a managed service like Kubernetes, you can still use the rolling update or node pools method with your own cluster to upgrade nodes. The difference is you need to manually add the new nodes to your cluster, and perform the master upgrade yourself, which can be tricky.

I highly recommend using Kubernetes Engine regional clusters for the high-availability masters and automatic node upgrades to have a hassle-free upgrade experience. If you need the extra control for your node updates, using node pools gives you that control without giving up the advantages of a managed Kubernetes platform that Kubernetes Engine gives you.

And thus concludes this series on Kubernetes best practices. If you have ideas for other topics you’d like me to address in the future, you can find me on Twitter. And if you’re attending Google Cloud Next ‘18 this July, be sure to drop by and say hi!

Introducing VPC-native clusters for Google Kubernetes Engine


[Editor's note: This is one of many posts on enterprise features enabled by Kubernetes Engine 1.10. For the full coverage, follow along here.]

Over the past few weeks, we’ve made some exciting announcements around Google Kubernetes Engine, starting with the general availability of Kubernetes 1.10 in the service. This latest version has new features that will really help enterprise use cases such as support for Shared Virtual Private Cloud (VPC) and Regional Clusters for high availability and reliability.

Building on that momentum, we are excited to announce the ability to create VPC-native clusters in Kubernetes Engine. A VPC-native cluster uses Alias IP routing built into the VPC network, resulting in a more scalable, secure and simple system that is suited for demanding enterprise deployments and use cases.

VPC-native clusters using Alias IP
VPC-native clusters rely on Alias IP which provides integrated VPC support for container networking. Without Alias IP, Kubernetes Engine uses Routes for Pod networking, which requires the Kubernetes control plane to maintain static routes to each Node. By using Alias IP, the VPC control panel automatically manages routing setup for Pods. In addition to this automatic management, native integration of container networking into the VPC fabric improves scalability and integration between Kubernetes and other VPC features.

Alias IP has been available on Google Cloud Platform (GCP) for Google Compute Engine instances for some time. Extending this functionality to Kubernetes Engine provides the following benefits:
  • Scale enhancements - VPC-native clusters no longer carry the burden of Routes and can scale to more nodes. VPC-native clusters will not be subject to Route quotas and limits, allowing you to seamlessly increase your Cluster size.
  • Hybrid connectivity - Alias IP subnets can be advertised by the Cloud Router over Cloud VPN or Cloud Interconnect, allowing you to connect your hybrid on-premises deployments with your Kubernetes Engine cluster. In addition, Alias IP advertisements with Cloud Router gives you granular control over which subnetworks and secondary range(s) are published to peer routers.
  • Better VPC integration - Alias IP provides Kubernetes Engine Pods with direct access to Google services like Google Cloud Storage, BigQuery and any other services served from the googleapis.com domain, without the overhead of a NAT proxy. Alias IP also enables enhanced VPC features such as Shared VPC.
  • Security checks - Alias IP allows you to enable anti-spoofing checks for the Nodes in your cluster. These anti-spoofing checks are provisioned on instances by default to ensure that traffic is not sent from arbitrary source IPs. Since Alias IP ranges in VPC-native clusters are known to the VPC network, they pass anti-spoofing checks by gidefault.
  • IP address management - VPC-native clusters integrate directly into your VPC IP address management system, preventing potential double allocation of your VPC IP space. Route-based clusters required manually blocking off the set of IPs assigned to your Cluster. VPC-native clusters provide two modes of allocating IPs, providing a full spectrum of control to the user. In the default method, Kubernetes Engine auto-selects and assigns secondary ranges for Pods and Services ranges. And if you need tight control over subnet assignments, you can create a custom subnet and secondary ranges and use it for Node, Pods and Service IPs. With Alias IP, GCP ensures that the Pod IP addresses cannot conflict with IP addresses on other resources.
Early adopters are already benefiting from the security and scale of VPC-native clusters in Kubernetes Engine. Vungle, an in-app video advertising platform for performance marketers, uses VPC-native clusters in Kubernetes Engine for its demanding applications
“VPC-native clusters, using Alias IPs, in Google Kubernetes Engine allowed us to run our bandwidth-hungry applications on Kubernetes without any of the performance degradation that we had seen when using overlay networks."
- Daniel Nelson, Director of Engineering, Vungle
Try it out today!
Create VPC-native clusters in Kubernetes Engine to get the ease of access and scale enterprise workloads require. Also, don’t forget to sign up for our upcoming webinar, 3 reasons why you should run your enterprise workloads on Google Kubernetes Engine.

Stackdriver brings powerful alerting capabilities to the condition editor UI


If you use Stackdriver, you probably rely on our alerting stack to be informed when your applications are misbehaving or aren’t performing as expected. We know how important it is to receive notifications at the right time as well as in the right situation. Imprecisely specifying what situation you want to be alerted on can lead to too many alerts (false positives) or too few (false negatives). When defining a Stackdriver alerting policy, it’s imperative that conditions be made as specific as possible, which is part of the reason that we introduced the ability to manage alerting policies in the Stackdriver Monitoring API last month. This, for example, enables users to create alerting conditions for resources filtered by certain metadata so that they can assign different conditions to parts of their applications that use similar resources but perform different functions.

But what about users who want to specify similar filters and aggregations using the Stackdriver UI? How can you get a more precise way to define the behavior that a metric must exhibit for the condition to be met (for example, alerting on certain resources filtered by metadata), as well as a more visual way of finding the right metrics to alert on for your applications?

We’ve got you covered. We are excited to announce the beta version of our new alerting condition configuration UI. In addition to allowing you to define alerting conditions more precisely, this new UI provides an easier, more visual way to find the metrics to alert on. The new UI lets you use the same metrics selector as used in Stackdriver’s Metrics Explorer to define a broader set of conditions. Starting today, you can use that metrics selector to create and edit threshold conditions for alerting policies. The same UI that you use to select metrics for charts can now be used for defining alerting policy conditions. It’s a powerful and more complete method for identifying your time series and specific aggregations. You’ll be able to express more targeted, actionable alerts with fewer false alerts.

We’ve already seen some great use cases for this functionality. Here are some ways in which our users have used this UI during early testing:

1. Alerting on aggregations of custom metrics and logs-based metrics
The ability to alert on aggregations of custom metrics or logs-based metrics is a common request from our users. This was recently made possible with the introduction of support for alerting policy management in the Stackdriver Monitoring v3 API. However, until this beta launch, there was no visual equivalent. With the introduction of this new UI, you can now visually explore metrics and define their alerting conditions before committing to an alerting policy. This adds a useful visual representation so you’ll have choices when setting up alert policies.

For example, below is a screen recording that shows how to aggregate a sum across a custom metrics grouped by pod:

2. Filter metadata to alert on specific Kubernetes resources
With the recent introduction of Stackdriver Kubernetes Monitoring, you have more out-of-the-box observability into your Kubernetes clusters. Now, with the addition of this new threshold condition UI, you can set up alerts on specific resources defined by metadata fields, instead of having to include the entire cluster.

For example, below is a screen recording showing how to alert when Kubernetes resources with a specific service name (customers-service) cross a certain aggregated threshold of the bytes transmitted. Using the metrics selector, you can configure the specific filters, grouping and aggregations that you’re interested in:

3. Edit metric threshold conditions that were created via the API
Many Stackdriver users utilize both the API and the alerting UI to create and edit alerting conditions. With this release, you can edit directly in the new UI many conditions that were previously created using the API.

Getting started with the new Stackdriver condition editor UI
To use the new UI, you must first opt in. When adding a policy condition, go to the Select condition type page. At the top of this page is an invitation to try a new variant of the UI:

Note that the new condition editor does not support process-health and uptime-check conditions, which continue to use the existing UI. The new UI supports all other condition types.

If you prefer to go back to the current UI, you can do so at any time by opting out. We’re looking forward to hearing more from users about what you’re accomplishing with the new UI.

To learn more, check out some specifics here on using the alerting UI.

Please send us feedback either via the feedback widget (click on your avatar -> Send Feedback), or by emailing us.

Related content:
New ways to manage and automate your Stackdriver alerting policies
Extracting value from your logs with Stackdriver logs-based metrics
Announcing Stackdriver Kubernetes Monitoring: Comprehensive Kubernetes observability from the start

Kubernetes best practices: mapping external services


Editor’s note: Today is the sixth installment in a seven-part video and blog series from Google Developer Advocate Sandeep Dinesh on how to get the most out of your Kubernetes environment.

If you’re like most Kubernetes users, chances are you use services that live outside your cluster. For example, maybe you use the Twillio API to send text messages, or maybe the Google Cloud Vision API to do image analysis.

If your applications in your different environments connect to the same external endpoint, and have no plans to bring the external service into your Kubernetes cluster, it is perfectly fine to use the external service endpoint directly in your code. However, there are many scenarios where this is not the case.

A good example of this are databases. While some cloud-native databases such as Cloud Firestore or Cloud Spanner use a single endpoint for all access, most databases have separate endpoints for different instances.

At this point, you may be thinking that a good solution to finding the endpoint is to use ConfigMaps. Simply store the endpoint address in a ConfigMap, and use it in your code as an environment variable. While this solution works, there are a few downsides. You need to modify your deployment to include the ConfigMap and write additional code to read from the environment variables. But most importantly, if the endpoint address changes you may need to restart all running containers to get the updated endpoint address.

In this episode of “Kubernetes best practices”, let’s learn how to leverage Kubernetes’ built-in service discovery mechanisms for services running outside the cluster, just like you can for services inside the cluster! This gives you parity across your dev and prod environments, and if you eventually move the service inside the cluster, you don’t have to change your code at all.

Scenario 1: Database outside cluster with IP address

A very common scenario is when you are hosting your own database, but doing so outside the cluster, for example on a Google Compute Engine instance. This is very common if you run some services inside Kubernetes and some outside, or need more customization or control than Kubernetes allows.

Hopefully, at some point, you can move all services inside the cluster, but until then you are living in a hybrid world. Thankfully, you can use static Kubernetes services to ease some of the pain.

In this example, I created a MongoDB server using Cloud Launcher. Because it is created in the same network (or VPC) as the Kubernetes cluster, it can be accessed using the high performance internal IP address. In Google Cloud, this is the default setup, so there is nothing special you need to configure.

Now that we have the IP address, the first step is to create a service:
kind: Service
apiVersion: v1
metadata:
 name: mongo
Spec:
 type: ClusterIP
 ports:
 - port: 27017
   targetPort: 27017
You might notice there are no Pod selectors for this service. This creates a service, but it doesn’t know where to send the traffic. This allows you to manually create an Endpoints object that will receive traffic from this service.

kind: Endpoints
apiVersion: v1
metadata:
 name: mongo
subsets:
 - addresses:
     - ip: 10.240.0.4
   ports:
     - port: 27017
You can see that the Endpoints manually defines the IP address for the database, and it uses the same name as the service. Kubernetes uses all the IP addresses defined in the Endpoints as if they were regular Kubernetes Pods. Now you can access the database with a simple connection string:
mongodb://mongo
> No need to use IP addresses in your code at all! If the IP address changes in the future, you can update the Endpoint with the new IP address, and your applications won’t need to make any changes.

Scenario 2: Remotely hosted database with URI

If you are using a hosted database service from a third party, chances are they give you a unified resource identifier (URI) that you can use to connect to. If they give you an IP address, you can use the method in Scenario 1.

In this example, I have two MongoDB databases hosted on mLab. One of them is my dev database, and the other is production.

The connection strings for these databases are as follows:
mongodb://<dbuser>:<dbpassword>@ds149763.mlab.com:49763/dev
mongodb://<dbuser>:<dbpassword>@ds145868.mlab.com:45868/prod
mLab gives you a dynamic URI and a dynamic port, and you can see that they are both different. Let’s use Kubernetes to create an abstraction layer over these differences. In this example, let’s connect to the dev database.

You can create a “ExternalName” Kubernetes service, which gives you a static Kubernetes service that redirects traffic to the external service. This service does a simple CNAME redirection at the kernel level, so there is very minimal impact on your performance.

The YAML for the service looks like this:
kind: Service
apiVersion: v1
metadata:
 name: mongo
spec:
 type: ExternalName
 externalName: ds149763.mlab.com
Now, you can use a much more simplified connection string:
mongodb://<dbuser>:<dbpassword>@mongo:<port>/dev
Because “ExternalName” uses CNAME redirection, it can’t do port remapping. This might be okay for services with static ports, but unfortunately it falls short in this example, where the port is dynamic. mLab’s free tier gives you a dynamic port number and you cannot change it. This means you need a different connection string for dev and prod.

However, if you can get the IP address, then you can do port remapping as I will explain in the next section.

Scenario 3: Remotely hosted database with URI and port remapping

While the CNAME redirect works great for services with the same port for each environment, it falls short in scenarios where the different endpoints for each environment use different ports. Thankfully we can work around that using some basic tools.

The first step is to get the IP address from the URI.

If you run the nslookup, hostname, or ping command against the URI, you can get the IP address of the database.

You can now create a service that remaps the mLab port and an endpoint for this IP address.
kind: Service
apiVersion: v1
metadata:
 name: mongo
spec:
 ports:
 - port: 27017
   targetPort: 49763
---
kind: Endpoints
apiVersion: v1
metadata:
 name: mongo
subsets:
 - addresses:
     - ip: 35.188.8.12
   ports:
     - port: 49763
Note: A URI might use DNS to load-balance to multiple IP addresses, so this method can be risky if the IP addresses change! If you get multiple IP addresses from the above command, you can include all of them in the Endpoints YAML, and Kubernetes will load balance traffic to all the IP addresses.

With this, you can connect to the remote database without needing to specify the port. The Kubernetes service does the port remapping transparently!
mongodb://<dbuser>:<dbpassword>@mongo/dev

Conclusion

Mapping external services to internal ones gives you the flexibility to bring these services into the cluster in the future while minimizing refactoring efforts. Even if you don’t plan to bring them in today, you never know what tomorrow might bring! Additionally, it makes it easier to manage and understand which external services your organization is using.

If the external service has a valid domain name and you don’t need port remapping, then using the “ExternalName” service type is an easy and quick way to map the external service to an internal one. If you don’t have a domain name or need to do port remapping, simply add the IP addresses to an endpoint and use that instead.

Going to Google Cloud Next18? Stop by to meet me and other Kubernetes team members in the "Meet the Experts" zone! Hope to see you there!

Beyond CPU: horizontal pod autoscaling with custom metrics in Google Kubernetes Engine


Many customers of Kubernetes Engine, especially enterprises, need to autoscale their environments based on more than just CPU usage—for example queue length or concurrent persistent connections. In Kubernetes Engine 1.9 we started adding features to address this and today, with the latest beta release of Horizontal Pod Autoscaler (HPA) on Kubernetes Engine 1.10, you can configure your deployments to scale horizontally in a variety of ways.

To walk you through your different horizontal scaling options, meet Barbara, a DevOps engineer working at a global video-streaming company. Barbara runs her environment on Kubernetes Engine, including the following microservices:
  • A video transcoding service that processes newly uploaded videos
  • A Google Cloud Pub/Sub queue for the list of videos that the transcoding service needs to process
  • A video-serving frontend that streams videos to users
A high-level diagram of Barbara’s application.

To make sure she meets the service level agreement for the latency of processing the uploads (which her company defines as a total travel time of the uploaded file) Barbara configures the transcoding service to scale horizontally based on the queue length—adding more replicas when there are more videos to process or removing replicas and saving money when the queue is short. In Kubernetes Engine 1.10 she accomplishes that by using the new ‘External’ metric type when configuring the Horizontal Pod Autoscaler. You can read more about this here.

apiVersion: autoscaling/v2beta1                                                 
kind: HorizontalPodAutoscaler                                                   
metadata:                                                                       
  name: transcoding-worker                                                                    
  namespace: video                                                            
spec:                                                                           
  minReplicas: 1                                                                
  maxReplicas: 20                                                                
  metrics:                                                                      
  - external:                                                                      
      metricName: pubsub.googleapis.com|subscription|num_undelivered_messages   
      metricSelector:                                                           
        matchLabels:                                                            
          resource.labels.subscription_id: transcoder_subscription                            
      targetAverageValue: "10"                                                   
    type: External                                                              
  scaleTargetRef:                                                               
    apiVersion: apps/v1                                              
    kind: Deployment                                                            
    name: transcoding-worker
To handle scaledowns correctly, Barbara also makes sure to set graceful termination periods of pods that are long enough to allow any transcoding already happening on pods to complete. She also writes her application to stop processing new queue items after it receives the SIGTERM termination signal from Kubernetes Engine.
A high-level diagram of Barbara’s application showing the scaling bottleneck.

Once the videos are transcoded, Barbara needs to ensure great viewing experience for her users. She identifies the bottleneck for the serving frontend: the number of concurrent persistent connections that a single replica can handle. Each of her pods already exposes its current number of open connections, so she configures the HPA object to maintain the average value of open connections per pod at a comfortable level. She does that using the Pods custom metric type.

apiVersion: autoscaling/v2beta1                                                 
kind: HorizontalPodAutoscaler                                                   
metadata:                                                                       
  name: frontend                                                                    
  namespace: video                                                            
spec:                                                                           
  minReplicas: 4                                                                
  maxReplicas: 40                                                                
  metrics:  
  - type: Pods
    pods:
      metricName: open_connections
      targetAverageValue: 100                                                                                                                            
  scaleTargetRef:                                                               
    apiVersion: apps/v1                                              
    kind: Deployment                                                            
    name: frontend
To scale based on the number of concurrent persistent connections as intended, Barbara also configures readiness probes such that any saturated pods are temporarily removed from the service until their situation improves. She also ensures that the streaming client can quickly recover if its current serving pod is scaled down.

It is worth noting here that her pods expose the open_connections metric as an endpoint for Prometheus to monitor. Barbara uses the prometheus-to-sd sidecar to make those metrics available in Stackdriver. To do that, she adds the following YAML to her frontend deployment config. You can read more about different ways to export metrics and use them for autoscaling here.

containers:
  ...
  - name: prometheus-to-sd
    image: gcr.io/google-containers/prometheus-to-sd:v0.2.6
    command:
    - /monitor
    - --source=:http://localhost:8080
    - --stackdriver-prefix=custom.googleapis.com
    - --pod-id=$(POD_ID)
    - --namespace-id=$(POD_NAMESPACE)
    env:
    - name: POD_ID
      valueFrom:
        fieldRef:
          apiVersion: v1
          fieldPath: metadata.uid
    - name: POD_NAMESPACE
      valueFrom:
        fieldRef:
          fieldPath: metadata.namespace
Recently, Barbara’s company introduced a new feature: streaming live videos. This introduces a new bottleneck to the serving frontend. It now needs to transcode some streams in real- time, which consumes a lot of CPU and decreases the number of connections that a single replica can handle.
A high-level diagram of Barbara’s application showing the new bottleneck due to CPU intensive live transcoding.
To deal with that, Barbara uses an existing feature of the Horizontal Pod Autoscaler to scale based on multiple metrics at the same time—in this case both the number of persistent connections as well as CPU consumption. HPA selects the maximum signal of the two, which is then used to trigger autoscaling:

apiVersion: autoscaling/v2beta1                                                 
kind: HorizontalPodAutoscaler                                                   
metadata:                                                                       
  name: frontend                                                                    
  namespace: video                                                            
spec:                                                                           
  minReplicas: 4                                                                
  maxReplicas: 40                                                                
  metrics:  
  - type: Pods
    pods:
      metricName: open_connections
      targetAverageValue: 100
  - type: Resource
    resource:
      name: cpu
      targetAverageUtilization: 60                                                                                                                        
  scaleTargetRef:                                                               
    apiVersion: apps/v1                                              
    kind: Deployment                                                            
    name: frontend
These are just some of the scenarios that HPA on Kubernetes can help you with.

Take it for a spin

Try Kubernetes Engine today with our generous 12-month free trial of $300 credits. Spin up a cluster (or a dozen) and experience the difference of running Kubernetes on Google Cloud, the cloud built for containers. And watch this space for future posts about how to use Cluster Autoscaler and Horizontal Pod Autoscaler together to make the most out of Kubernetes Engine.

Get higher availability with Regional Persistent Disks on Google Kubernetes Engine


Building highly available stateful applications on Kubernetes has been a challenge for a long time. As such, many enterprises have to write complex application logic on top of Kubernetes APIs for running applications such as databases and distributed file systems.

Today, we’re excited to announce the beta launch of Regional Persistent Disks (Regional PD) for Kubernetes Engine, making it easier for organizations of all sizes to build and run highly available stateful applications in the cloud. While Persistent Disks (PD) are zonal resources, and applications built on top of PDs can become unavailable in the event of a zonal failure, Regional PDs provide network-attached block storage with synchronous replication of data between two zones in a region. This approach maximizes application availability without sacrificing consistency. Regional PD automatically handles transient storage unavailability in a zone, and provides an API to facilitate cross-zone failover (learn more about this in the documentation).

Regional PD has native integration with the Kubernetes master that manages health monitoring and failover to the secondary zone in case of an outage in the primary zone. With a Regional PD, you also take advantage of replication at the storage layer, rather than worrying about application-level replication. This offers a convenient building block for implementing highly available solutions on Kubernetes Engine, and can provide cross-zone replication to existing legacy services. Internally, for instance, we used Regional PD to implement high availability in Google Cloud SQL for Postgres.

To understand the power of Regional PD, imagine you want to deploy Wordpress with MySQL in Kubernetes. Before Regional PD, if you wanted to build an HA configuration, you needed to write complex application logic, typically using custom resources, or use a commercial replication solution. Now, simply use Regional PD as the storage backend for the Wordpress and MySQL databases. Because of the block-level replication, the data is always present in another zone, so you don’t need to worry if there is a zonal outage.

With Regional PD, you can build a two-zone HA solution by simply changing the storage class definition in the dynamic provisioning specification—no complex Kubernetes controller management required!

kind: StorageClass
apiVersion: storage.k8s.io/v1
metadata:
  name: repd
provisioner: kubernetes.io/gce-pd
parameters:
  type: pd-standard
  replication-type: regional-pd
  zones: us-central1-a, us-central1-b
Alternatively, you can manually provision a Regional PD using the gcloud command line tool:
gcloud beta compute disks create gce-disk-1
    --region europe-west1
    --replica-zones europe-west1-b,europe-west1-c
Regional PDs are now available in Kubernetes Engine clusters. To learn more, check out the documentation, Kubernetes guide and sample solution using Regional PD.

Introducing Shared VPC for Google Kubernetes Engine


Containers have come a long way, from the darling of cloud-native startups to the de-facto way to deploy production workloads in large enterprises. But as containers grow into this new role, networking continues to pose challenges in terms of management, deployment and scaling.

We are excited to introduce Shared Virtual Private Cloud (VPC) to help Google Kubernetes Engine tackle scale and reliability needs of container networking for enterprise workloads.

Shared VPC for better control of enterprise network resources
In large enterprises, you often need to place different departments into different projects, for purposes of budgeting, access control, accounting, etc. And while isolation and network segmentation are recommended best practices, network segmentation can pose a challenge for sharing resources. In Compute Engine environments, Shared VPC networks let enterprise administrators give multiple projects permission to communicate via a single, shared virtual network without giving control of critical resources such as firewalls. Now, with the general availability of Kubernetes Engine 1.10, we are extending the shared VPC model to connect Kubernetes Engine clusters with versions 1.8 and above—connecting from multiple projects to a common VPC network.

Before Shared VPC, it was possible to achieve this setup in a crippled, insecure way, by bridging projects in their own VPC with Cloud VPNs. The problem with this approach was that it required N*(N-1)/2 connections to obtain full connectivity between each project. An additional challenge was that the network for each cluster wasn’t fully configurable, making it difficult for one project to communicate with another without a NAT gateway in between. Security was another concern since the organization administrator had no control over firewalls in the other projects.

Now, with Shared VPC, you can overcome these challenges and compartmentalize Kubernetes Engine clusters into separate projects, for the following benefits to your enterprise:
  • Sharing of common resources - Shared VPC makes it easy to use network resources that must be shared across various teams, such as a set of IPs within RFC 1918 shared across multiple subnets and Kubernetes Engine clusters.
  • Security - Organizations want to leverage more granular IAM roles to separate access to sensitive projects and data. By restricting what individual users can do with network resources, network and security administrators can better protect enterprise assets from inadvertent or deliberate acts that can compromise the network. While a network administrator can set firewalls for every team, a cluster administrator’s responsibilities might be to manage workloads within a project. Shared VPC provides you with centralized control of critical network resources under the organization administrator, while still giving flexibility to the various organization admins to manage clusters in their own projects.
  • Billing - Teams can use projects and separate Kubernetes Engine clusters to isolate their resource usage, which helps with accounting and budgeting needs by letting you view billing for each team separately.
  • Isolation and support for multi-tenant workloads - You can break up your deployment into projects and assign them to the teams working on them, lowering the chances that one team’s actions will inadvertently affect another team’s projects.

Below is an example of how you can map your organizational structure to your network resources using Shared VPC:

Here is what, Spotify, one of the many enterprises using Kubernetes Engine, has to say:
“Kubernetes is our preferred orchestration solution for thousands of our backend services because of its capabilities for improved resiliency, features such as autoscaling, and the vibrant open-source community. Shared VPC in Kubernetes Engine is essential for us to be able to use Kubernetes Engine with our many GCP projects."
- Matt Brown, Software Engineer, Spotify

How does Shared VPC work?
Host project contains one or more shared network resources while the service project(s) map to the different teams or departments in your organization. After setting up the correct IAM permissions for service accounts in both the host and service projects, the cluster admin can instantiate a number of Compute Engine resources in any of the service projects. This way, critical resources like firewalls are centrally managed by the network or security admin, while cluster admins are able to create clusters in the respective service projects.

Shared VPC is built on top of Alias IP. Kubernetes Engine clusters in service projects will need to be configured with a primary CIDR range (from which to draw Node IP addresses), and two secondary CIDR ranges (from which to draw Kubernetes Pod and Service IP addresses). The following diagram illustrates a subnet with the three CIDR ranges from which the clusters in the Shared VPC are carved out.

The Shared VPC IAM permissions model
To get started with Shared VPC, the first step is to set up the right IAM permissions on service accounts. For the cluster admin to be able to create Kubernetes Engine clusters in the service projects, the host project administrator needs to grant the compute.networkUser and container.hostServiceAgentUser roles in the host project, allowing the service project's service accounts to use specific subnetworks and to perform networking administrative actions to manage Kubernetes Engine clusters. For more detailed information on the IAM permissions model, follow along here.

Try it out today!
Create a Shared VPC cluster in Kubernetes Engine and get the ease of access and scale for your enterprise workloads. Don’t forget to sign up for the upcoming webinar, 3 reasons why you should run your enterprise workloads on Kubernetes Engine.

Google Kubernetes Engine 1.10 is generally available and ready for the enterprise


Today, we’re excited to announce the general availability of Google Kubernetes Engine 1.10, which lays the foundation for new features to enable greater enterprise usage. Here on the Kubernetes Engine team, we’ve been thinking about challenges such as security, networking, logging, and monitoring that are critical to the enterprise for a long time. Now, in parallel to the GA of Kubernetes Engine 1.10, we are introducing a train of new features to support enterprise use cases. These include:
  • Shared Virtual Private Cloud (VPC) for better control of your network resources
  • Regional Persistent Disks and Regional Clusters for higher-availability and stronger SLAs
  • Node Auto-Repair GA, and Custom Horizontal Pod Autoscaler for greater automation
Better yet, these all come with the robust security that Kubernetes Engine provides by default.
Let’s take a look at some of the new features that we will add to Kubernetes Engine 1.10 in the coming weeks.
Networking: global hyperscale network for applications with Shared VPC
Large organizations with several teams prefer to share physical resources while maintaining logical separation of resources between departments. Now, you can deploy your workloads in Google’s global Virtual Private Cloud (VPC) in a Shared VPC model, giving you the flexibility to manage access to shared network resources using IAM permissions while still isolating your departments. Shared VPC lets your organization administrators delegate administrative responsibilities, such as creating and managing instances and clusters, to service project admins while maintaining centralized control over network resources like subnets, routes, and firewalls. Stay tuned for more on Shared VPC support this week, where we’ll demonstrate how enterprise users can separate resources owned by projects while allowing them to communicate with each other over a common internal network.

Storage: high availability with Regional Persistent Disks
To make it easier to build highly available solutions, Kubernetes Engine will provide support for the new Regional Persistent Disk (Regional PD). Regional PD, available in the coming days, provides durable network-attached block storage with synchronous replication of data between two zones in a region. With Regional PDs, you don’t have to worry about application-level replication and can take advantage of replication at the storage layer. This replication offers a convenient building block for implementing highly available solutions on Kubernetes Engine.
Reliability: improved uptime with Regional Clusters, node auto-repair
Regional clusters, to be generally available soon, allows you to create a Kubernetes Engine cluster with a multi-master, highly-available control plane that spreads your masters across three zones in a region—an important feature for clusters with higher uptime requirements. Regional clusters also offers a zero-downtime upgrade experience when upgrading Kubernetes Engine masters. In addition to Regional Clusters, the node auto-repair feature is now generally available. Node auto-repair monitors the health of the nodes in your cluster and repairs any that are unhealthy.
Auto-scaling: Horizontal Pod Autoscaling with custom metrics
Our users have long asked for the ability to scale horizontally any way they like. In Kubernetes Engine 1.10, Horizontal Pod Autoscaler supports three different custom metrics types in beta: External (e.g., for scaling based on Cloud Pub/Sub queue length - one of the most requested use cases), Pods (e.g., for scaling based on the average number of open connections per pod) and Object (e.g., for scaling based on Kafka running in your cluster).

Kubernetes Engine enterprise adoption

Since we launched it in 2014, Kubernetes has taken off like a rocket. It is becoming “the Linux of the cloud,” according to Jim Zemlin, Executive Director of the Linux Foundation. Analysts estimate that 54 percent of Fortune 100 companies use Kubernetes across a spectrum of industries including finance, manufacturing, media, and others.
Kubernetes Engine, the first production-grade managed Kubernetes service, has been generally available since 2015. Core-hours for the service have ballooned: in 2017 Kubernetes Engine core-hours grew 9X year over year, supporting a wide variety of applications. Stateful workload (e.g. databases and key-value stores) usage has grown since the initial launch in 2016, to over 40 percent of production Kubernetes Engine clusters.
Here is what a few of the enterprises who are using Kubernetes Engine have to say.
Alpha Vertex, a financial services company that delivers advanced analytical capabilities to the financial community, built a Kubernetes cluster of 150 64-core Intel Skylake processors in just 15 minutes and trains 20,000 machine learning models concurrently using Kubernetes Engine.
“Google Kubernetes Engine is like magic for us. It’s the best container environment there is. Without it, we couldn’t provide the advanced financial analytics we offer today. Scaling would be difficult and prohibitively expensive.”
- Michael Bishop, CTO and Co-Founder, Alpha Vertex
Philips Lighting builds lighting products, systems, and services. Philips uses Kubernetes Engine to handle 200 million transactions every day, including 25 million remote lighting commands.
“Google Kubernetes Engine delivers a high-performing, flexible infrastructure that lets us independently scale components for maximum efficiency.”
- George Yianni, Head of Technology, Home Systems, Philips Lighting
Spotify the digital music service that hosts more than 2 billion playlists and gives consumers access to more than 30 million songs uses Kubernetes Engine for thousands of backend services.
“Kubernetes is our preferred orchestration solution for thousands of our backend services because of its capabilities for improved resiliency, features such as autoscaling, and the vibrant open source community. Shared VPC in Kubernetes Engine is essential for us to be able to use Kubernetes Engine with our many GCP projects.”
- Matt Brown, Software Engineer, Spotify
Get started today and let Google Cloud manage your enterprise applications on Kubernetes Engine. To learn more about Kubernetes Engine, join us for a deep dive into the Kubernetes 1.10 enterprise features in Kubernetes Engine by signing up for our upcoming webinar, 3 reasons why you should run your enterprise workloads on Kubernetes Engine.