Tag Archives: Announcements

Introducing VPC-native clusters for Google Kubernetes Engine


[Editor's note: This is one of many posts on enterprise features enabled by Kubernetes Engine 1.10. For the full coverage, follow along here.]

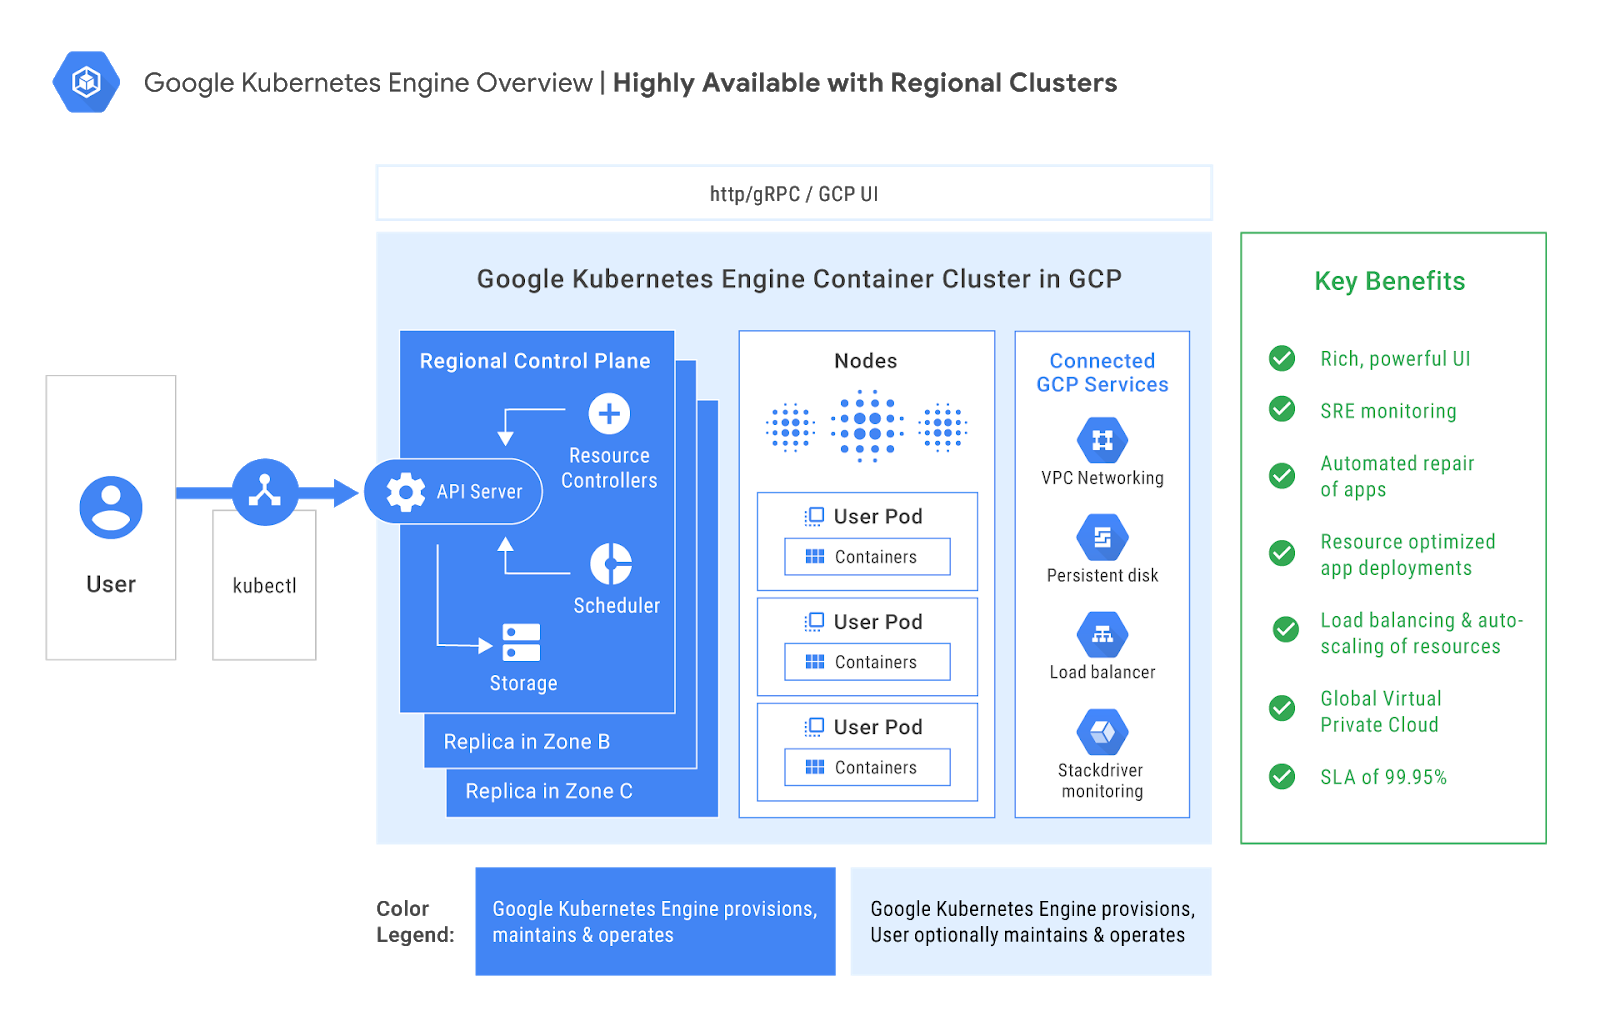
Over the past few weeks, we’ve made some exciting announcements around Google Kubernetes Engine, starting with the general availability of Kubernetes 1.10 in the service. This latest version has new features that will really help enterprise use cases such as support for Shared Virtual Private Cloud (VPC) and Regional Clusters for high availability and reliability.

Building on that momentum, we are excited to announce the ability to create VPC-native clusters in Kubernetes Engine. A VPC-native cluster uses Alias IP routing built into the VPC network, resulting in a more scalable, secure and simple system that is suited for demanding enterprise deployments and use cases.

VPC-native clusters using Alias IP
VPC-native clusters rely on Alias IP which provides integrated VPC support for container networking. Without Alias IP, Kubernetes Engine uses Routes for Pod networking, which requires the Kubernetes control plane to maintain static routes to each Node. By using Alias IP, the VPC control panel automatically manages routing setup for Pods. In addition to this automatic management, native integration of container networking into the VPC fabric improves scalability and integration between Kubernetes and other VPC features.

Alias IP has been available on Google Cloud Platform (GCP) for Google Compute Engine instances for some time. Extending this functionality to Kubernetes Engine provides the following benefits:
  • Scale enhancements - VPC-native clusters no longer carry the burden of Routes and can scale to more nodes. VPC-native clusters will not be subject to Route quotas and limits, allowing you to seamlessly increase your Cluster size.
  • Hybrid connectivity - Alias IP subnets can be advertised by the Cloud Router over Cloud VPN or Cloud Interconnect, allowing you to connect your hybrid on-premises deployments with your Kubernetes Engine cluster. In addition, Alias IP advertisements with Cloud Router gives you granular control over which subnetworks and secondary range(s) are published to peer routers.
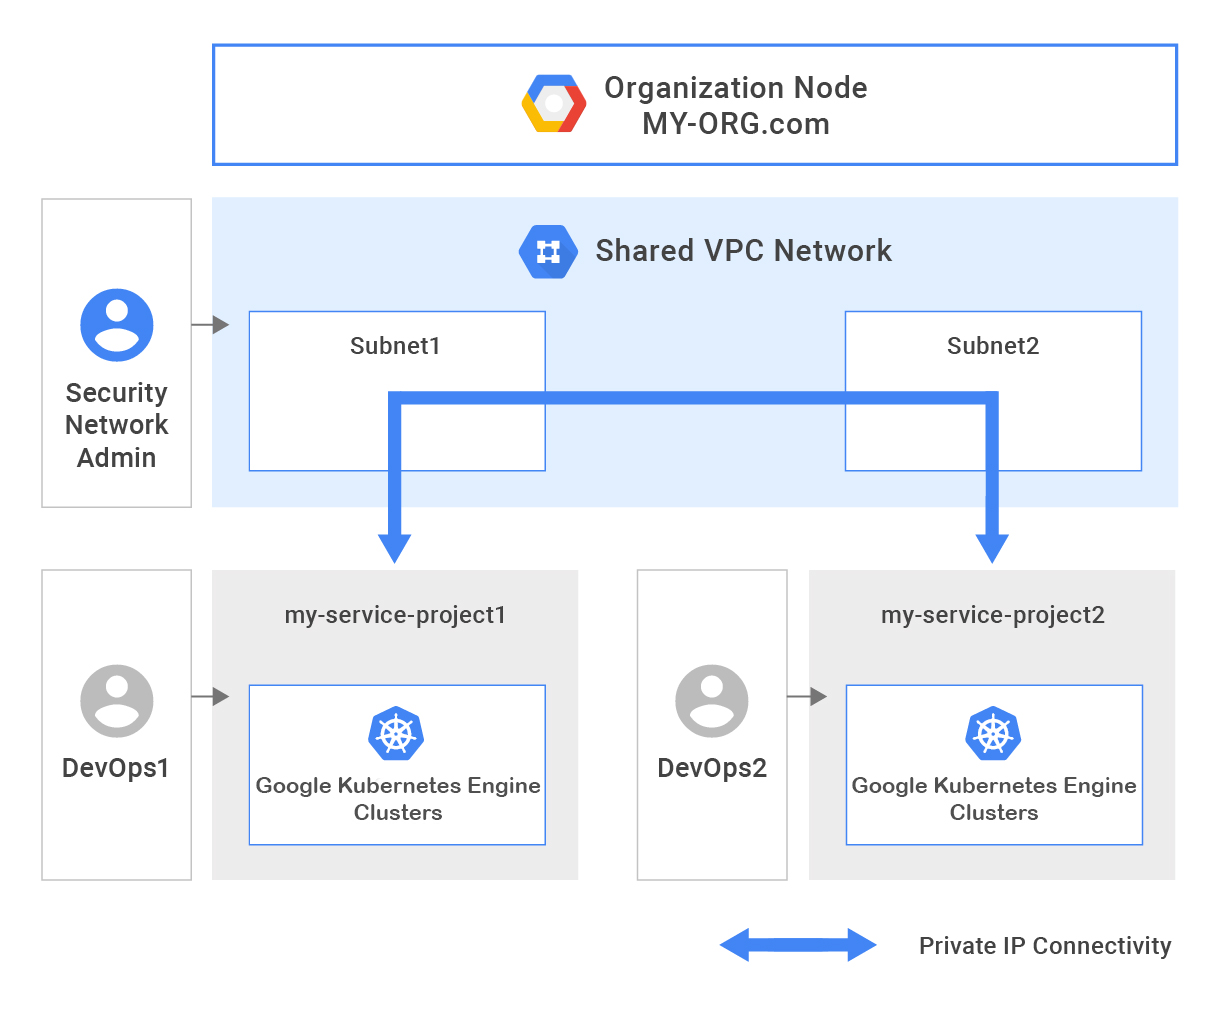
  • Better VPC integration - Alias IP provides Kubernetes Engine Pods with direct access to Google services like Google Cloud Storage, BigQuery and any other services served from the googleapis.com domain, without the overhead of a NAT proxy. Alias IP also enables enhanced VPC features such as Shared VPC.
  • Security checks - Alias IP allows you to enable anti-spoofing checks for the Nodes in your cluster. These anti-spoofing checks are provisioned on instances by default to ensure that traffic is not sent from arbitrary source IPs. Since Alias IP ranges in VPC-native clusters are known to the VPC network, they pass anti-spoofing checks by gidefault.
  • IP address management - VPC-native clusters integrate directly into your VPC IP address management system, preventing potential double allocation of your VPC IP space. Route-based clusters required manually blocking off the set of IPs assigned to your Cluster. VPC-native clusters provide two modes of allocating IPs, providing a full spectrum of control to the user. In the default method, Kubernetes Engine auto-selects and assigns secondary ranges for Pods and Services ranges. And if you need tight control over subnet assignments, you can create a custom subnet and secondary ranges and use it for Node, Pods and Service IPs. With Alias IP, GCP ensures that the Pod IP addresses cannot conflict with IP addresses on other resources.
Early adopters are already benefiting from the security and scale of VPC-native clusters in Kubernetes Engine. Vungle, an in-app video advertising platform for performance marketers, uses VPC-native clusters in Kubernetes Engine for its demanding applications
“VPC-native clusters, using Alias IPs, in Google Kubernetes Engine allowed us to run our bandwidth-hungry applications on Kubernetes without any of the performance degradation that we had seen when using overlay networks."
- Daniel Nelson, Director of Engineering, Vungle
Try it out today!
Create VPC-native clusters in Kubernetes Engine to get the ease of access and scale enterprise workloads require. Also, don’t forget to sign up for our upcoming webinar, 3 reasons why you should run your enterprise workloads on Google Kubernetes Engine.

Beyond CPU: horizontal pod autoscaling with custom metrics in Google Kubernetes Engine


Many customers of Kubernetes Engine, especially enterprises, need to autoscale their environments based on more than just CPU usage—for example queue length or concurrent persistent connections. In Kubernetes Engine 1.9 we started adding features to address this and today, with the latest beta release of Horizontal Pod Autoscaler (HPA) on Kubernetes Engine 1.10, you can configure your deployments to scale horizontally in a variety of ways.

To walk you through your different horizontal scaling options, meet Barbara, a DevOps engineer working at a global video-streaming company. Barbara runs her environment on Kubernetes Engine, including the following microservices:
  • A video transcoding service that processes newly uploaded videos
  • A Google Cloud Pub/Sub queue for the list of videos that the transcoding service needs to process
  • A video-serving frontend that streams videos to users
A high-level diagram of Barbara’s application.

To make sure she meets the service level agreement for the latency of processing the uploads (which her company defines as a total travel time of the uploaded file) Barbara configures the transcoding service to scale horizontally based on the queue length—adding more replicas when there are more videos to process or removing replicas and saving money when the queue is short. In Kubernetes Engine 1.10 she accomplishes that by using the new ‘External’ metric type when configuring the Horizontal Pod Autoscaler. You can read more about this here.

apiVersion: autoscaling/v2beta1                                                 
kind: HorizontalPodAutoscaler                                                   
metadata:                                                                       
  name: transcoding-worker                                                                    
  namespace: video                                                            
spec:                                                                           
  minReplicas: 1                                                                
  maxReplicas: 20                                                                
  metrics:                                                                      
  - external:                                                                      
      metricName: pubsub.googleapis.com|subscription|num_undelivered_messages   
      metricSelector:                                                           
        matchLabels:                                                            
          resource.labels.subscription_id: transcoder_subscription                            
      targetAverageValue: "10"                                                   
    type: External                                                              
  scaleTargetRef:                                                               
    apiVersion: apps/v1                                              
    kind: Deployment                                                            
    name: transcoding-worker
To handle scaledowns correctly, Barbara also makes sure to set graceful termination periods of pods that are long enough to allow any transcoding already happening on pods to complete. She also writes her application to stop processing new queue items after it receives the SIGTERM termination signal from Kubernetes Engine.
A high-level diagram of Barbara’s application showing the scaling bottleneck.

Once the videos are transcoded, Barbara needs to ensure great viewing experience for her users. She identifies the bottleneck for the serving frontend: the number of concurrent persistent connections that a single replica can handle. Each of her pods already exposes its current number of open connections, so she configures the HPA object to maintain the average value of open connections per pod at a comfortable level. She does that using the Pods custom metric type.

apiVersion: autoscaling/v2beta1                                                 
kind: HorizontalPodAutoscaler                                                   
metadata:                                                                       
  name: frontend                                                                    
  namespace: video                                                            
spec:                                                                           
  minReplicas: 4                                                                
  maxReplicas: 40                                                                
  metrics:  
  - type: Pods
    pods:
      metricName: open_connections
      targetAverageValue: 100                                                                                                                            
  scaleTargetRef:                                                               
    apiVersion: apps/v1                                              
    kind: Deployment                                                            
    name: frontend
To scale based on the number of concurrent persistent connections as intended, Barbara also configures readiness probes such that any saturated pods are temporarily removed from the service until their situation improves. She also ensures that the streaming client can quickly recover if its current serving pod is scaled down.

It is worth noting here that her pods expose the open_connections metric as an endpoint for Prometheus to monitor. Barbara uses the prometheus-to-sd sidecar to make those metrics available in Stackdriver. To do that, she adds the following YAML to her frontend deployment config. You can read more about different ways to export metrics and use them for autoscaling here.

containers:
  ...
  - name: prometheus-to-sd
    image: gcr.io/google-containers/prometheus-to-sd:v0.2.6
    command:
    - /monitor
    - --source=:http://localhost:8080
    - --stackdriver-prefix=custom.googleapis.com
    - --pod-id=$(POD_ID)
    - --namespace-id=$(POD_NAMESPACE)
    env:
    - name: POD_ID
      valueFrom:
        fieldRef:
          apiVersion: v1
          fieldPath: metadata.uid
    - name: POD_NAMESPACE
      valueFrom:
        fieldRef:
          fieldPath: metadata.namespace
Recently, Barbara’s company introduced a new feature: streaming live videos. This introduces a new bottleneck to the serving frontend. It now needs to transcode some streams in real- time, which consumes a lot of CPU and decreases the number of connections that a single replica can handle.
A high-level diagram of Barbara’s application showing the new bottleneck due to CPU intensive live transcoding.
To deal with that, Barbara uses an existing feature of the Horizontal Pod Autoscaler to scale based on multiple metrics at the same time—in this case both the number of persistent connections as well as CPU consumption. HPA selects the maximum signal of the two, which is then used to trigger autoscaling:

apiVersion: autoscaling/v2beta1                                                 
kind: HorizontalPodAutoscaler                                                   
metadata:                                                                       
  name: frontend                                                                    
  namespace: video                                                            
spec:                                                                           
  minReplicas: 4                                                                
  maxReplicas: 40                                                                
  metrics:  
  - type: Pods
    pods:
      metricName: open_connections
      targetAverageValue: 100
  - type: Resource
    resource:
      name: cpu
      targetAverageUtilization: 60                                                                                                                        
  scaleTargetRef:                                                               
    apiVersion: apps/v1                                              
    kind: Deployment                                                            
    name: frontend
These are just some of the scenarios that HPA on Kubernetes can help you with.

Take it for a spin

Try Kubernetes Engine today with our generous 12-month free trial of $300 credits. Spin up a cluster (or a dozen) and experience the difference of running Kubernetes on Google Cloud, the cloud built for containers. And watch this space for future posts about how to use Cluster Autoscaler and Horizontal Pod Autoscaler together to make the most out of Kubernetes Engine.

Better cost control with Google Cloud Billing programmatic notifications


By running your workloads on Google Cloud Platform (GCP) you have access to the tools you need to build and scale your business. At the same time, it’s important to keep your costs under control by informing users and managing their spending.

Today, we’re adding programmatic budget notifications to Google Cloud Billing, a powerful feature that helps you stick to your budget and take automatic action when your budget is out of control.

Monitor your costs
You can use Cloud Billing budget notifications with third-party or homegrown cost-management solutions, as well as Google Cloud services. For example, as an engineering manager, you can set up budget notifications to alert your entire team through Slack every time you hit 80 percent of your budget.

Control your costs
You can also configure automated actions based on the notifications to control your costs, such as selectively turning off particular resources or terminating all resources for a project. For example, as a PhD student working at a lab with a fixed grant amount, you can use budget notifications to trigger a cap to terminate your project when you use up your grant. This way, you can be confident that you won’t go over budget.

Work with your existing workflow and tools
To make it easy to get started with budget notifications, we’ve included examples of reference architectures for a few common use cases in our documentation:
  • Monitoring - listen to your PubSub notifications with Cloud Functions
  • Forward notifications to Slack - send custom billing alerts with the current spending for your budget to a Slack channel
  • Cap (disable) billing on a project - disable billing for a project and terminate all resources to make sure you don’t overspend
  • Selectively control resources - when you want to terminate expensive resources but not disable your whole environment.
Get started
You can set up programmatic budget notifications in a few simple steps:

  1. Navigate to Billing in the Google Cloud Console and create your budget.
  2. Enable Cloud Pub/Sub, then set up a Cloud Pub/Sub topic for your budget.
  3. When creating your budget you will see a new section “Manage notifications” where you can configure your Cloud Pub/Sub topic: 

  4. Set up a Cloud Function to listen to budget notifications and trigger an action.
  5. Cloud Billing sends budget notifications multiple times per day, so you will always have the most up-to-date information on your spending.
You can get started today by reading the Google Cloud Billing documentation. If you’ll be at Google Cloud Next ‘18, be sure to come by my session on Google Cloud Billing and cost control.

Google Cloud named a leader in latest Forrester Research Public Cloud Platform Native Security Wave


Today, we are happy to announce that Forrester Research has named Google Cloud as one of just two leaders in The Forrester WaveTM: Public Cloud Platform Native Security (PCPNS), Q2 2018 report, and rated Google Cloud highest in strategy. The report evaluates the native security capabilities and features of public cloud providers, such as encryption, identity and access management (IAM) and workload security.

The report finds that most security and risk professionals (S&R) now believe that “native security capabilities of large public cloud platforms actually offer more affordable and superior security than what S&R teams could deliver themselves if the workloads remained on-premises.”

The report particularly highlights that “Google has been continuing to invest in PCPNS. The platform’s security configuration policies are very granular in the admin console as well as in APIs. The platform has a large number of security certifications, broad partner ecosystem, offers deep native support for guest operating systems and Kubernetes containers, and supports auto-scaling (GPUs can be added to instances).”

In this wave, Forrester evaluated seven public cloud platforms against 37 criteria, looking at current offerings, strategy and market presence. Of the seven vendors, Google Cloud scored highest on strategy, and received the highest score possible in its strategic plans in physical security, certifications and attestations, hypervisor security, guest OS workload security, network security, and machine learning criteria.

Further, Forrester cited Google Cloud’s security roadmap. As part of our roadmap, Google Cloud continues to redefine what’s possible in the cloud with unique security capabilities like Access Transparency, Istio, Identity-Aware Proxy, VPC Service Controls, and Asylo.

“The vendor plans: to 1) provide ongoing security improvements to the admin console using device trust, location, etc., 2) implement hardware-backed encryption key management, and 3) improve visibility into the platform by launching a unified risk dashboard."

At Google, we have worked for over a decade to build a secure, scalable and flexible cloud foundation. Our belief is that if you put security first, everything else will follow. Security continues to be top of mind—from our custom hardware like our Titan chip, to data encryption both at rest and in transit by default. On this strong foundation, we offer enterprises a rich set of controls and capabilities to meet their security and compliance requirements.

You can download the full Forrester Public Cloud Platform Native Security Wave Q2 2018 report here. To learn more about GCP, visit our website, and sign up for a free trial.

Dialogflow adds versioning and other new features to help enterprises build vibrant conversational experiences


At Google I/O recently, we announced that Dialogflow has been adopted by more than half a million developers, and that number is growing rapidly. We also released new features that make it easier for enterprises to create, maintain, and improve a vibrant conversational experience powered by AI: versions and environments, an improved history tool for easier debugging, and support for training models with negative examples.

Versions and Environments BETA
Dialogflow’s new versions and environments feature gives enterprises a familiar approach for building, testing, deploying, and iterating conversational interfaces. Using this beta feature, you can deploy multiple versions of agents (which represent the conversational interface of your application, device, or bot in Dialogflow) to separate, customizable environments, giving you more control over how new features are built, tested, and deployed. For example, you may want to maintain one version of your agent in production and another in your development environment, do quality assurance on a version that contains just a subset of features, or develop different draft versions of your agent at the same time.
Creating versions and environments
Publishing a version


Managing versions within an environment

You can publish your agent either to Google Assistant production or to the Action Console's Alpha and Beta testing environments. You can even invite and manage testers of your digital agents—up to 20 for Alpha releases, and up to 200 for Beta releases!

Get started right away: Explore this tutorial to learn more about how to activate and use versions and environments in Dialogflow.

Improved conversation history tool for easier debugging
Dialogflow’s history tool now cleanly displays conversations between your users and your agent, and flags places where your agent was unable to match an intent. It also links to diagnostics via new integration with Google Stackdriver Logging so you can easily diagnose and quickly fix performance issues. We’ve also expanded the diagnostic information shown in the test console, so you can see the raw request being sent to your fulfillment webhook as well as the response.

Training with negative examples for improved precision
It can be frustrating for end-users when certain phrases trigger unwanted intents. To improve your digital agent’s precision, you can now add negative examples as training phrases for fallback intents. For example, by providing the negative example “Buy bus ticket to San Francisco” in the Default Fallback Intent for an agent that only books flights, instead of classifying that request as a purchase intent for an airplane ticket, the agent will respond by clarifying which method of transportation is supported.


Try Dialogflow today using a free credit
See the quickstart to set up a Google Cloud Platform project and quickly create a digital agent with Dialogflow Enterprise Edition. Remember, you get a $300 free credit to get started with any GCP product (good for 12 months).

Google Kubernetes Engine 1.10 is generally available and ready for the enterprise


Today, we’re excited to announce the general availability of Google Kubernetes Engine 1.10, which lays the foundation for new features to enable greater enterprise usage. Here on the Kubernetes Engine team, we’ve been thinking about challenges such as security, networking, logging, and monitoring that are critical to the enterprise for a long time. Now, in parallel to the GA of Kubernetes Engine 1.10, we are introducing a train of new features to support enterprise use cases. These include:
  • Shared Virtual Private Cloud (VPC) for better control of your network resources
  • Regional Persistent Disks and Regional Clusters for higher-availability and stronger SLAs
  • Node Auto-Repair GA, and Custom Horizontal Pod Autoscaler for greater automation
Better yet, these all come with the robust security that Kubernetes Engine provides by default.
Let’s take a look at some of the new features that we will add to Kubernetes Engine 1.10 in the coming weeks.
Networking: global hyperscale network for applications with Shared VPC
Large organizations with several teams prefer to share physical resources while maintaining logical separation of resources between departments. Now, you can deploy your workloads in Google’s global Virtual Private Cloud (VPC) in a Shared VPC model, giving you the flexibility to manage access to shared network resources using IAM permissions while still isolating your departments. Shared VPC lets your organization administrators delegate administrative responsibilities, such as creating and managing instances and clusters, to service project admins while maintaining centralized control over network resources like subnets, routes, and firewalls. Stay tuned for more on Shared VPC support this week, where we’ll demonstrate how enterprise users can separate resources owned by projects while allowing them to communicate with each other over a common internal network.

Storage: high availability with Regional Persistent Disks
To make it easier to build highly available solutions, Kubernetes Engine will provide support for the new Regional Persistent Disk (Regional PD). Regional PD, available in the coming days, provides durable network-attached block storage with synchronous replication of data between two zones in a region. With Regional PDs, you don’t have to worry about application-level replication and can take advantage of replication at the storage layer. This replication offers a convenient building block for implementing highly available solutions on Kubernetes Engine.
Reliability: improved uptime with Regional Clusters, node auto-repair
Regional clusters, to be generally available soon, allows you to create a Kubernetes Engine cluster with a multi-master, highly-available control plane that spreads your masters across three zones in a region—an important feature for clusters with higher uptime requirements. Regional clusters also offers a zero-downtime upgrade experience when upgrading Kubernetes Engine masters. In addition to Regional Clusters, the node auto-repair feature is now generally available. Node auto-repair monitors the health of the nodes in your cluster and repairs any that are unhealthy.
Auto-scaling: Horizontal Pod Autoscaling with custom metrics
Our users have long asked for the ability to scale horizontally any way they like. In Kubernetes Engine 1.10, Horizontal Pod Autoscaler supports three different custom metrics types in beta: External (e.g., for scaling based on Cloud Pub/Sub queue length - one of the most requested use cases), Pods (e.g., for scaling based on the average number of open connections per pod) and Object (e.g., for scaling based on Kafka running in your cluster).

Kubernetes Engine enterprise adoption

Since we launched it in 2014, Kubernetes has taken off like a rocket. It is becoming “the Linux of the cloud,” according to Jim Zemlin, Executive Director of the Linux Foundation. Analysts estimate that 54 percent of Fortune 100 companies use Kubernetes across a spectrum of industries including finance, manufacturing, media, and others.
Kubernetes Engine, the first production-grade managed Kubernetes service, has been generally available since 2015. Core-hours for the service have ballooned: in 2017 Kubernetes Engine core-hours grew 9X year over year, supporting a wide variety of applications. Stateful workload (e.g. databases and key-value stores) usage has grown since the initial launch in 2016, to over 40 percent of production Kubernetes Engine clusters.
Here is what a few of the enterprises who are using Kubernetes Engine have to say.
Alpha Vertex, a financial services company that delivers advanced analytical capabilities to the financial community, built a Kubernetes cluster of 150 64-core Intel Skylake processors in just 15 minutes and trains 20,000 machine learning models concurrently using Kubernetes Engine.
“Google Kubernetes Engine is like magic for us. It’s the best container environment there is. Without it, we couldn’t provide the advanced financial analytics we offer today. Scaling would be difficult and prohibitively expensive.”
- Michael Bishop, CTO and Co-Founder, Alpha Vertex
Philips Lighting builds lighting products, systems, and services. Philips uses Kubernetes Engine to handle 200 million transactions every day, including 25 million remote lighting commands.
“Google Kubernetes Engine delivers a high-performing, flexible infrastructure that lets us independently scale components for maximum efficiency.”
- George Yianni, Head of Technology, Home Systems, Philips Lighting
Spotify the digital music service that hosts more than 2 billion playlists and gives consumers access to more than 30 million songs uses Kubernetes Engine for thousands of backend services.
“Kubernetes is our preferred orchestration solution for thousands of our backend services because of its capabilities for improved resiliency, features such as autoscaling, and the vibrant open source community. Shared VPC in Kubernetes Engine is essential for us to be able to use Kubernetes Engine with our many GCP projects.”
- Matt Brown, Software Engineer, Spotify
Get started today and let Google Cloud manage your enterprise applications on Kubernetes Engine. To learn more about Kubernetes Engine, join us for a deep dive into the Kubernetes 1.10 enterprise features in Kubernetes Engine by signing up for our upcoming webinar, 3 reasons why you should run your enterprise workloads on Kubernetes Engine.

Google Maps Platform now integrated with the GCP Console


Thirteen years ago, the first Google Maps mashup combined Craigslist housing data on top of our map tiles—before there was even an API to access them. Today, Google Maps APIs are some of the most popular on the internet, powering millions of websites and apps generating billions of requests per day.

Earlier this month, we introduced the next generation of our Google Maps business—Google Maps Platform—that included a series of updates to help you take advantage of new location-based features and products. We simplified our APIs into three product categories—Maps, Routes and Places—to make it easier for you to find, explore and add new features to your apps and sites. In addition, we merged our pricing plans into one pay-as-you go plan for our core products. With this new plan, you get the first $200 of monthly usage for free, so you can try the APIs risk-free.

In addition, Google Maps Platform includes simplified products, tighter integration with Google Cloud Platform (GCP) services and tools, as well as a single pay-as-you-go offering. By integrating with GCP, you can scale your business and utilize location services as you grow—we no longer enforce usage caps, just like any other GCP service.

You can also manage Google Maps Platform from Google Cloud Console—the same interface you already use to manage and monitor other GCP services. This integration provides a more tailored view to manage your Google Maps Platform implementation, so you can monitor individual API usage, establish usage quotas, configure alerts for more visibility and control, and access billing reports. All Google Maps Platform customers now receive free Google Maps Platform customer support, which you can also access through the GCP Console.

Check out the Google Maps Platform website where you can learn more about our products and also explore the guided onboarding wizard from the website to the console. We can’t wait to see how you will use Google Maps Platform with GCP to bring new innovative services to your customers.

Getting more value from your Stackdriver logs with structured data


Logs contain some of the most valuable data available to developers, DevOps practitioners, Site Reliability Engineers (SREs) and security teams, particularly when troubleshooting an incident. It’s not always easy to extract and use, though. One common challenge is that many log entries are blobs of unstructured text, making it difficult to extract the relevant information when you need it. But structured log data is much more powerful, and enables you to extract the most valuable data from your logs. Google Stackdriver Logging just made it easier than ever to send and analyze structured log data.

We’ve just announced new features so you can better use structured log data. You’ve told us that you’d like to be able to customize which fields you see when searching through your logs. You can now add custom fields in the Logs Viewer in Stackdriver. It’s also now easier to generate structured log data using the Stackdriver Logging agent.

Why is structured logging better?
Using structured log data has some key benefits, including making it easier to quickly parse and understand your log data. The chart below shows the differences between unstructured and structured log data. 

You can see here how much more detail is available at a glance:


Unstructured log data
Structured log data
Example from custom logs
...
textPayload: A97A7743 purchased 4 widgets.
...
...
jsonPayload: {
 "customerIDHash": “A97A7743”
 "action": “purchased”
 "quantity": “4”
 "item": “widgets”
}
...
Example from Nginx logs—now available as structured data through the Stackdriver logging agent
textPayload: 127.0.0.1 10.21.7.112 - [28/Feb/2018:12:00:00 +0900] "GET / HTTP/1.1" 200 777 "-" "Chrome/66.0"
time:
1362020400 (28/Feb/2018:12:00:00 +0900)

jsonPayload: {
 "remote" : "127.0.0.1",
 "host"   : "10.21.7.112",
 "user"   : "-",
 "method" : "GET",
 "path"   : "/",
 "code"   : "200",
 "size"   : "777",
 "referer": "-",
 "agent"  : "Chrome/66.0"
}


Making structured logs work for you
You can send both structured and unstructured log data to Stackdriver Logging. Most logs Google Cloud Platform (GCP) services generate on your behalf, such as Cloud Audit Logging, Google App Engine logs or VPC Flow Logs, are sent to Stackdriver automatically as structured log data.

Since Stackdriver Logging also passes the structured log data through export sinks, sending structured logs makes it easier to work with the log data downstream if you’re processing it with services like BigQuery and Cloud Pub/Sub.

Using structured log data also makes it easier to alert on log data or create dashboards from your logs, particularly when creating a label or extracting a value with a distribution metric, both of which apply to a single field. (See our previous post on techniques for extracting values from Stackdriver logs for more information.)

Try Stackdriver Logging for yourself
To start using Stackdriver structured logging today, you’ll just need to install (or reinstall) the Stackdriver logging agent with the --structured flag. This also enables automatic parsing of common log formats, such as syslog, Nginx and Apache.

curl -sSO "https://dl.google.com/cloudagents/install-logging-agent.sh"
sudo bash ./install-logging-agent.sh --structured

For more information on installation and options, check out the Stackdriver structured logging installation documentation.

To test Stackdriver Logging and see the power of structured logs for yourself, you can try one of our most asked-for Qwiklab courses, Creating and alerting on logs-based metrics, for free, using a special offer of 15 credits. This offer is good through the end of May 2018. Or try our new structured logging features out on your existing GCP project by checking out our documentation.

Increase performance while reducing costs with the new App Engine scheduler


One of the main benefits of Google App Engine is automatic scaling of your applications. Behind the scenes, App Engine continually monitors your instance capacity and traffic to ensure the appropriate number of instances are running. Today, we are rolling out the next generation scheduler for App Engine standard environment. Our tests show that it delivers better scaling performance and more efficient resource consumption—and lower costs for you.

The new App Engine scheduler delivers the following improvements compared to the previous App Engine scheduler:

  • an average of 5% reduction in median and tail request latencies
  • an average of 30% reduction of the number of requests seeing a "cold start"
  • an average of 7% cost reduction

Observed improvements across all App Engine services and customers: blue is the baseline (old scheduler), green is the new scheduler.

In addition, if you need more control over how App Engine runs your applications, the new scheduler introduces some new autoscaling parameters. For example:

  • Max Instances allows you to cap the total number of instances, and
  • Target CPU Utilization represents the CPU utilization ratio threshold used to determine if the number of instances should be scaled up or down. Tweak this parameter to optimize between performance and costs.


For a complete list of the parameters you can use to configure your App Engine app, visit the app.yaml reference documentation.

The new scheduler for App Engine standard environment is generally available and has been rolled out to all regions and all applications. We are very excited about the improvements it brings.

You can read more about the new feature in the App Engine documentation. And if you have concerns or are encountering issues, reach out to us via GCP Support, by reporting a public issue, posting in the App Engine forum, or messaging us on the App Engine slack channel. We look forward to your feedback!

Opening a third zone in Singapore


When we opened the Google Cloud Platform (GCP) Singapore region last year,  it launched with two zones. Today, we’re happy to announce a third zone (asia-southeast1-c) and a few new services. This expansion will make it easier for customers, especially in Southeast Asia, to build highly available services that meet the needs of their business.


This is the 46th GCP zone globally, and now all 15 GCP regions have three or more zones. We build every region with the intention of providing at least three zones because we understand the importance of high availability. Customers can distribute their apps and storage across multiple zones to protect against service disruptions.

New services
At launch, the Singapore region had a core set of services and we’ve continued to add services like Cloud KMS and Cloud Bigtable. Now, we’ve added three new services to the region: Cloud Spanner, Cloud SQL, and Managed Instance Groups.


What customers are saying

“It’s super exciting to see the third availability zone go up in Singapore, as more GCP services will be provisioned closer to ASEAN. This will help ensure our customers have the best experience and reliability on our web or mobile products.”
— Nikunj Shanti Patel , Chief Data and Digital Officer

“A year ago we selected Google Cloud as our provider for BBM. A year later, we've migrated BBM to Google's Cloud platform and will leverage the third zone in Singapore to bring Google's innovation closer to our user base in Indonesia."
— Mohan Krishnan, CTO, of Creative Media Works, the company that runs BBM Messenger Consumer globally.

"With services such as Cloud SQL being made available, the third zone in Singapore will enable us to deliver the best viewing experience to our massive user base in this region. Since our engineering team is also located here, we can leverage the new services and bring further innovation to our platform at a faster pace."
— Alex Chan,  SVP of Product and Engineering, Viki

Resources

For the latest on availability of services from this region as well as additional regions and services, visit our locations page. For guidance on how to build and create highly available applications, take a look at our zones and regions page. Watch this webinar to learn more about how we bring GCP closer to you. Give us a shout to request early access to new regions and help us prioritize what we build next.

We’re excited to see what you’ll build next on GCP!