Author Archives: Michee Smith

Updating our “right to be forgotten” Transparency Report

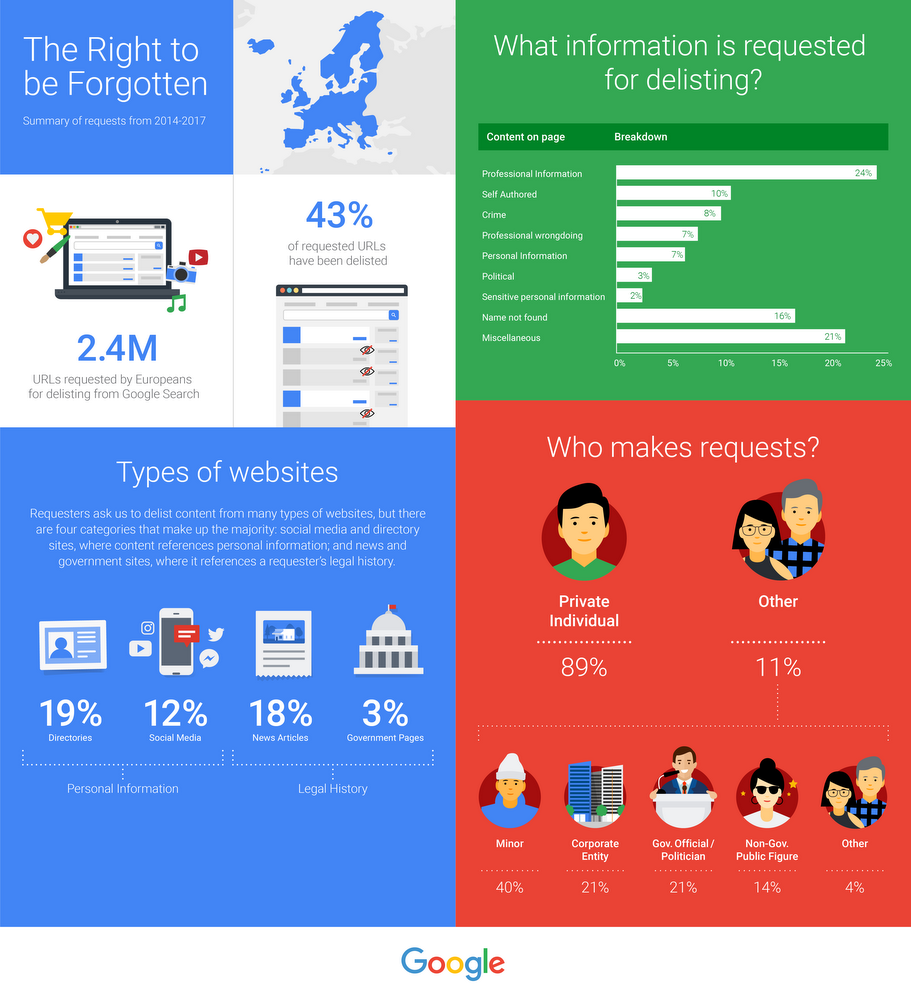
In May 2014, in a landmark ruling, the European Court of Justice established the “right to be forgotten,” or more accurately, the “right to delist,” allowing Europeans to ask search engines to delist information about themselves from search results. In deciding what to delist, search engines like Google must consider if the information in question is “inaccurate, inadequate, irrelevant or excessive”—and whether there is a public interest in the information remaining available in search results.


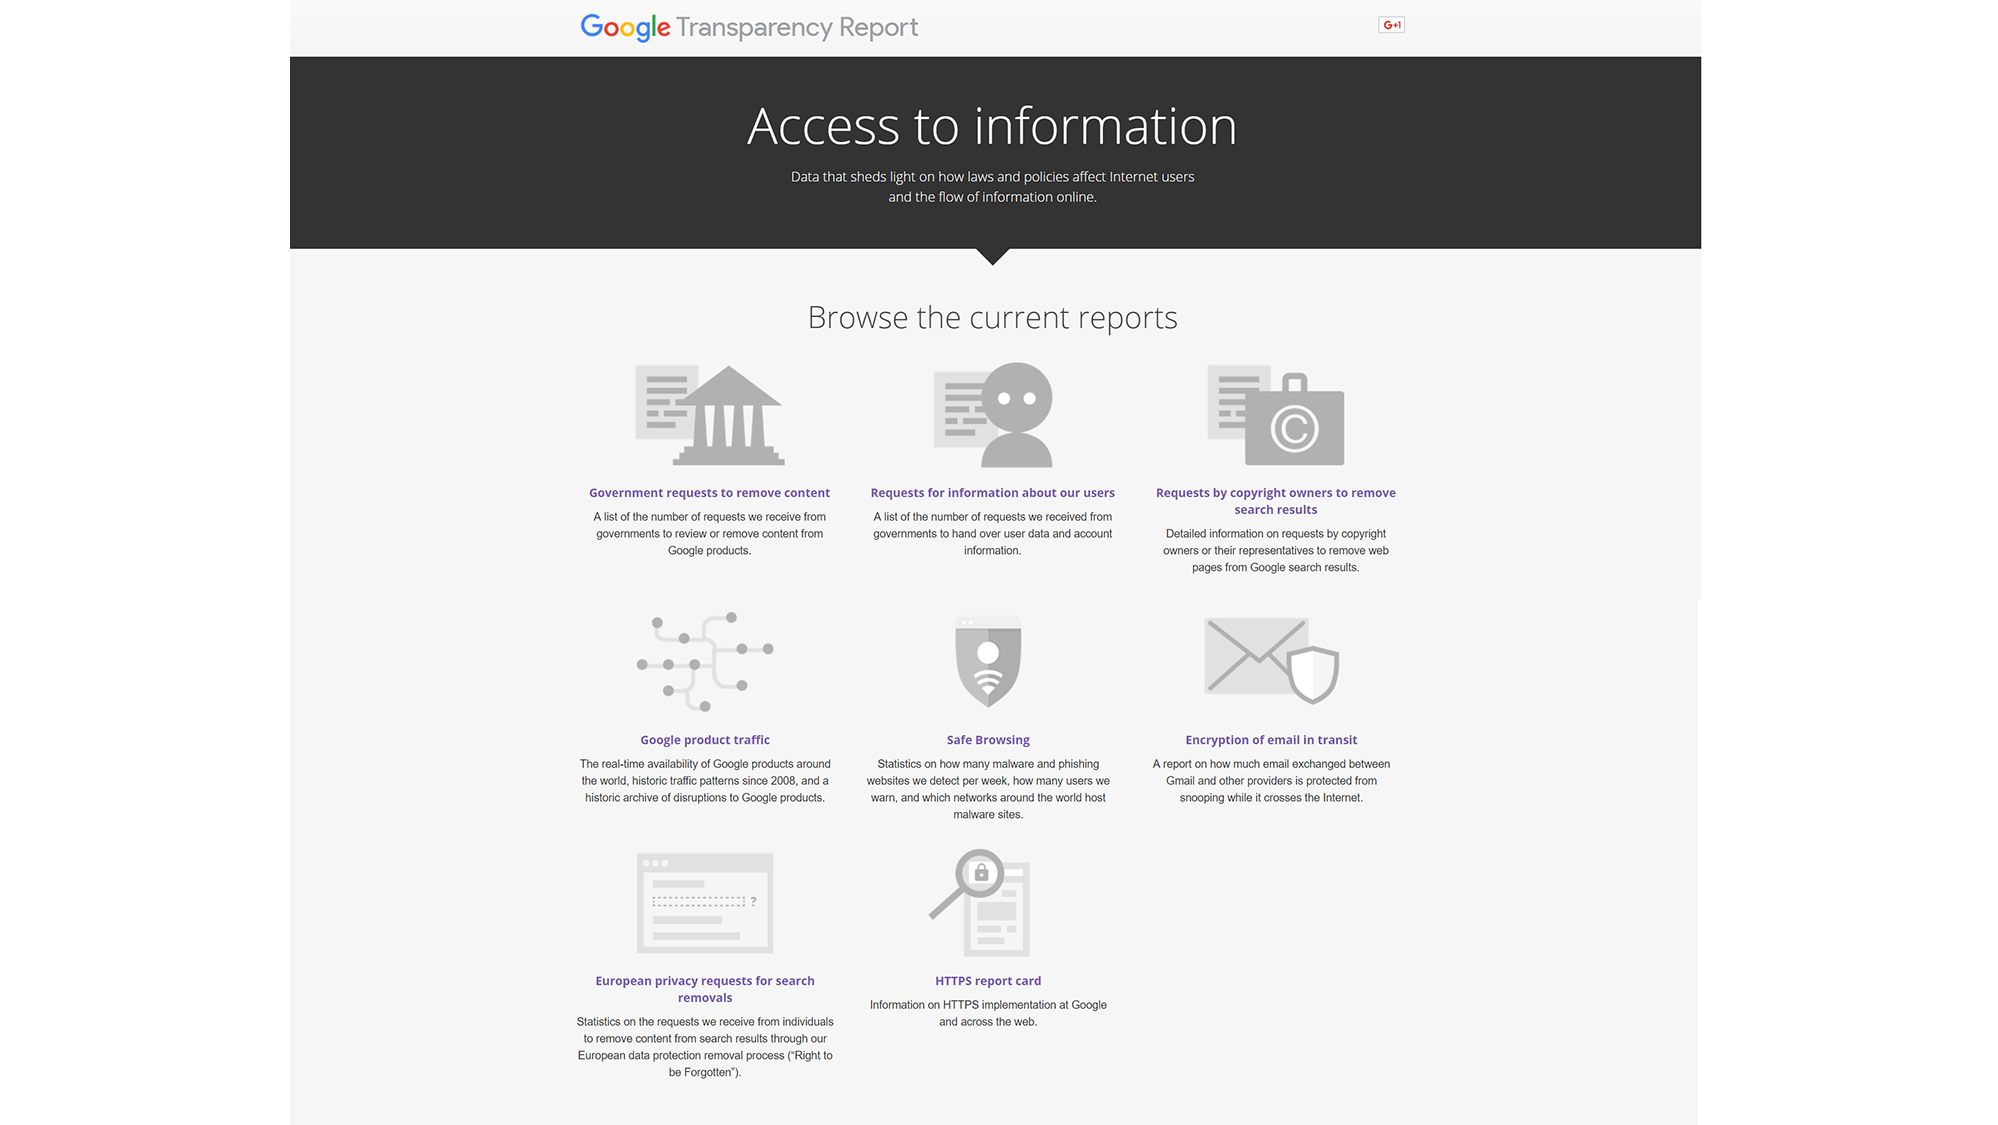
Understanding how we make these types of decisions—and how people are using new rights like those granted by the European Court—is important. Since 2014, we’ve provided information about “right to be forgotten” delisting requests in our Transparency Report, including the number of URLs submitted to us, the number of URLs delisted and not delisted, and anonymized examples of some of the requests we have received.

New data in the Transparency Report


Today, we’re expanding the scope of our transparency reporting about the “right to be forgotten” and adding new data going back to January 2016 when our reviewers started manually annotating each URL submitted to us with additional information, including:


  • Requesters:We show a breakdown of the requests made by private individuals vs. non-private individuals—e.g., government officials or corporate entities.

  • Content of the request:We classify the content that the individual has asked us to delist into a set of categories: personal information, professional information, crime, and name not found, meaning that we were not able to find the individual’s name on the page.

  • Content of the site: When we evaluate a URL for potential delisting, we classify the website that hosts the page as a directory site, news site, social media, or other.

  • Content delisting rate:This is the rate at which we delist content by category on a quarterly basis.


Looking back: analyzing three years of delisting requests


In addition to updating the Transparency Report, we’re also providing a snapshot of our efforts to process these requests over the last three years.

rtbf_infographic.png

We’re also releasing the draft of a new research paper called Three Years of the Right to be Forgotten, which has been submitted to the Privacy Enhancing Technologies Symposium for peer review. This paper uses our manual reviewers’ annotations to provide a comprehensive analysis of the ways Europeans are using the “right to be forgotten.”


We hope the new data we’ve added to the Transparency Report and our research paper will help inform the ongoing discussion about the interplay between the right to privacy and the right to access lawful information online.

A new look for our Transparency Report

In 2010, we launched the government requests tool, a new way to publicly document government requests for user data and content removals. It was the first report of its kind and a natural extension of our mission to make information accessible and useful. In the years since, our simple tool evolved into the Transparency Report, a multifaceted snapshot of the ways governments and corporations affect online security, privacy, and the free flow of information.

The web has evolved too, and has become central to people’s lives: 400 hours of video are uploaded to YouTube every minute, more than one billion people rely on Gmail and Chrome, every day. And this type reporting, once an anomaly, has become the norm across the tech industry and beyond. More than 40 companies now have transparency reports; that’s great news for people everywhere.

But while the report itself expanded in scope and coverage, its design remained largely unchanged. Not only was it due for a little update, we heard from users it could be easier to navigate as well.

So today we’re introducing the completely revamped Transparency Report. It features clearer data visualizations, more context for the data, a Recent Updates section so you can see what’s new, and a better way to download data from our most popular reports. And while the previous version was a patchwork of different reports, designed at different times in different styles, our new report is all one consistent design, making it easier to find exactly what you’re looking for.

We’re continuing to invest in this report because we’ve seen firsthand how it can help inform and shape the public debate about information online. The data also acts as a lens into significant moments in the history of the web, fundamental changes to security, and our efforts to be transparent about data and how it is used. Here are a few examples:

Our Traffic and Disruptions report documents real-time disruptions to usage of our products. Here’s what the report looked like for search in Egypt in January of 2011 when internet access was restricted during the Arab Spring.

Traffic

As we say in the report, “when you send or receive emails from a provider that doesn’t encrypt messages in transit, they are as open to snoopers as a postcard in the mail.” In 2014, we started reporting on the state of email encryption across the industry and which providers offer this protection. It’s been really encouraging to see how these trends have changed. Since then, outbound email encryption has gone from 73 percent to 88 percent., and inbound email encryption has gone from 61 percent to 88 percent since the launch of the report as well. We hope these numbers continue to increase in the years ahead.

Encryption

And going back to the report’s original mission—government requests—we’re constantly pushing for more complete and accurate data. The results of this effort are visible directly in the report. In December 2016, for example, after a years-long effort, we were able to share National Security Letters with the public, for the first time.

Over the years, the Transparency Report has sparked new conversations about transparency, accountability and the role of governments and companies in the flow of information online. Our hope is that with these changes, we can start a few more.

A new look for our Transparency Report

In 2010, we launched the government requests tool, a new way to publicly document government requests for user data and content removals. It was the first report of its kind and a natural extension of our mission to make information accessible and useful. In the years since, our simple tool evolved into the Transparency Report, a multifaceted snapshot of the ways governments and corporations affect online security, privacy, and the free flow of information.

The web has evolved too, and has become central to people’s lives: 400 hours of video are uploaded to YouTube every minute, more than one billion people rely on Gmail and Chrome, every day. And this type reporting, once an anomaly, has become the norm across the tech industry and beyond. More than 40 companies now have transparency reports; that’s great news for people everywhere.

But while the report itself expanded in scope and coverage, its design remained largely unchanged. Not only was it due for a little update, we heard from users it could be easier to navigate as well.

So today we’re introducing the completely revamped Transparency Report. It features clearer data visualizations, more context for the data, a Recent Updates section so you can see what’s new, and a better way to download data from our most popular reports. And while the previous version was a patchwork of different reports, designed at different times in different styles, our new report is all one consistent design, making it easier to find exactly what you’re looking for.

We’re continuing to invest in this report because we’ve seen firsthand how it can help inform and shape the public debate about information online. The data also acts as a lens into significant moments in the history of the web, fundamental changes to security, and our efforts to be transparent about data and how it is used. Here are a few examples:

Our Traffic and Disruptions report documents real-time disruptions to usage of our products. Here’s what the report looked like for search in Egypt in January of 2011 when internet access was restricted during the Arab Spring.

Traffic

As we say in the report, “when you send or receive emails from a provider that doesn’t encrypt messages in transit, they are as open to snoopers as a postcard in the mail.” In 2014, we started reporting on the state of email encryption across the industry and which providers offer this protection. It’s been really encouraging to see how these trends have changed. Since then, outbound email encryption has gone from 73 percent to 88 percent., and inbound email encryption has gone from 61 percent to 88 percent since the launch of the report as well. We hope these numbers continue to increase in the years ahead.

Encryption

And going back to the report’s original mission—government requests—we’re constantly pushing for more complete and accurate data. The results of this effort are visible directly in the report. In December 2016, for example, after a years-long effort, we were able to share National Security Letters with the public, for the first time.

Over the years, the Transparency Report has sparked new conversations about transparency, accountability and the role of governments and companies in the flow of information online. Our hope is that with these changes, we can start a few more.