Category Archives: YouTube Engineering and Developers Blog

What’s happening with engineering and developers at YouTube

Improving VR videos

At YouTube, we are focused on enabling the kind of immersive and interactive experiences that only VR can provide, making digital video as immersive as it can be. In March 2015, we launched support for 360-degree videos shortly followed by VR (3D 360) videos. In 2016 we brought 360 live streaming and spatial audio and a dedicated YouTube VR app to our users.

Now, in a joint effort between YouTube and Daydream, we're adding new ways to make 360 and VR videos look even more realistic.

360 videos need a large numbers of pixels per video frame to achieve a compelling immersive experience. In the ideal scenario, we would match human visual acuity which is 60 pixels per degree of immersive content. We are however limited by user internet connection speed and device capabilities. One way to bridge the gap between these limitations and the human visual acuity is to use better projection methods.

Better Projections

A Projection is the mapping used to fit a 360-degree world view onto a rectangular video surface. The world map is a good example of a spherical earth projected on a rectangular piece of paper. A commonly used projection is called equirectangular projection. Initially, we chose this projection when we launched 360 videos because it is easy to produce by camera software and easy to edit.

However, equirectangular projection has some drawbacks:

  • It has high quality at the poles (top and bottom of image) where people don’t look as much – typically, sky overhead and ground below are not that interesting to look at.
  • It has lower quality at the equator or horizon where there is typically more interesting content.
  • It has fewer vertical pixels for 3D content.
  • A straight line motion in the real world does not result in a straight line motion in equirectangular projection, making videos hard to compress.


Drawbacks of equirectangular (EQ) projection

These drawbacks made us look for better projection types for 360-degree videos. To compare different projection types we used saturation maps. A saturation map shows the ratio of video pixel density to display pixel density. The color coding goes from red (low) to orange, yellow, green and finally blue (high). Green indicates optimal pixel density of near 1:1. Yellow and orange indicate insufficient density (too few video pixels for the available display pixels) and blue indicates wasted resources (too many video pixels for the available display pixels). The ideal projection would lead to a saturation map that is uniform in color. At sufficient video resolution it would be uniformly green.

We investigated cubemaps as a potential candidate. Cubemaps have been used by computer games for a long time to display the skybox and other special effects.

eqr_saturation.png


Equirectangular projection saturation map

cubemap_saturation.png


Cubemap projection saturation map

In the equirectangular saturation map the poles are blue, indicating wasted pixels. The equator (horizon) is orange, indicating an insufficient number of pixels. In contrast, the cubemap has green (good) regions nearer to the equator, and the wasteful blue regions at the poles are gone entirely. However, the cubemap results in large orange regions (not good) at the equator because a cubemap samples more pixels at the corners than at the center of the faces.

We achieved a substantial improvement using an approach we call Equi-angular Cubemap or EAC. The EAC projection’s saturation is significantly more uniform than the previous two, while further improving quality at the equator:

eac_saturation.png


Equi-angular Cubemap - EAC

As opposed to traditional cubemap, which distributes equal pixels for equal distances on the cube surface, equi-angular cubemap distributes equal pixels for equal angular change.

The saturation maps seemed promising, but we wanted to see if people could tell the difference. So we asked people to rate the quality of each without telling them which projection they were viewing. People generally rated EAC as higher quality compared to other projections. Here is an example comparison:

EAC vs EQ


Creating Industry Standards

We’re just beginning to see innovative new projections for 360 video. We’ve worked with Equirectangular and Cube Map, and now EAC. We think a standardized way to represent arbitrary projections will help everyone innovate, so we’ve developed a Projection Independent Mesh.

A Projection Independent Mesh describes the projection by including a 3D mesh along with its texture mapping in the video container. The video rendering software simply renders this mesh as per the texture mapping specified and does not need to understand the details of the projection used. This gives us infinite possibilities. We published our mesh format draft standard on github inviting industry experts to comment and are hoping to turn this into a widely agreed upon industry standard.

Some 360-degree cameras do not capture the entire field of view. For example, they may not have a lens to capture the top and bottom or may only capture a 180-degree scene. Our proposal supports these cameras and allows replacing the uncaptured portions of the field of view by a static geometry and image. Our proposal allows compressing the mesh using deflate or other compression. We designed the mesh format with compression efficiency in mind and were able to fit EAC projection within a 4 KB payload.

The projection independent mesh allows us to continue improving on projections and deploy them with ease since our renderer is now projection independent.

Spherical video playback on Android now benefits from EAC projection streamed using a projection independent mesh and it will soon be available on IOS and desktop. Our ingestion format continues to be based on equirect projection as mentioned in our upload recommendations.

Anjali Wheeler, Software Engineer, recently watched "Disturbed - The Sound Of Silence."

Supercharge your YouTube live tools with the new Super Chat API

In December 2015, we launched an array of API services that let developers access a wealth of data about live streams, chat, and fan funding. Since then, we’ve seen thousands of creators use the tools listed on our Tools for Gaming Streamers page to enhance their streams by adding chatbots, overlays, polls and more.

Today, we announced a new live feature for fans and creators, Super Chat, which lets anybody watching a live stream stand out from the crowd and get a creator’s attention by purchasing highlighted chat messages. We’re also announcing a new API service for this feature: the Super Chat API, designed to allow developers to access real-time information about Super Chat purchases.

The launch of this new API service will be followed by the shutdown of our Fan Funding API. To that end, developers using the Fan Funding API need to move to the new Super Chat API as soon as possible.

On January 31, 2017, we’ll begin offering replacements for the two ways developers currently get information about Fan Funding:

  • LiveChatMessages.list will gain a new message type, superChatMessage, which will contain details about Super Chats purchased during an active live stream
  • A new endpoint, SuperChats.list, will be made available to list a channel’s Super Chat purchases

On February 28, 2017, we’ll be turning down the two existing Fan Funding methods:

  • LiveChatMessages.list will no longer return messages of type fanFundingEvent
  • FanFundingEvents.list will no longer return data

During the transition period between Super Chats and Fan Funding, SuperChats.list will provide information about both Super Chat events and Fan Funding events, so we encourage all developers to switch to the new API as soon as it becomes available. Keep your eye on the YouTube Data API v3 Revision History to get the documentation for this service as soon as we post it.

If you’ve got questions on this, please feel free to ask the community on our Stack Overflow tag or send us a tweet at @YouTubeDev and we’ll do our best to answer.

Marc Chambers, Developer Relations, recently watched "Show of the Week: New Games for 2017."

Download your ad revenue reports through the YouTube Reporting API service

With the launch of the YouTube Reporting API last year, we introduced a mechanism to download raw YouTube Analytics data. It generates a set of predefined reports in the form of CSV files that contain YouTube Analytics data for content owners. Once activated, reports are generated regularly, and each one contains data for a unique, 24-hour period. We heard that you also wanted more data to be accessible via the YouTube Reporting API service.

So today, we are making a set of system-managed ad revenue reports available to content owners. Previously, this data was only available via manually downloadable reports in Creator Studio. The system-managed reports released via the YouTube Reporting API maintain the same breakdowns as downloadable reports, but the schema is optimized to align to other reports available via this API.

These new reports are generated automatically for eligible YouTube Partners. Thus, if you are an eligible YouTube partner, you don't even need to create reporting jobs. Just follow the instructions below to find out whether the reports are available to you and to download the reports themselves.

We also want to let you know that more reports will be available via the YouTube Reporting API service in the coming weeks and months. Please keep an eye on the revision history to find out when additional reports become available.

How to start using the new reports

Check what new report types are available to you

  1. Get an OAuth token (authentication credentials)
  2. Call the reportTypes.list method with the includeSystemManaged parameter set to true.
  3. The response lists all report types available to you. As you can’t use the new report types to create reporting jobs yourself, their systemManaged property is set to true.

Check if system-managed jobs have been created for you

  1. Get an OAuth token (authentication credentials)
  2. Call the jobs.list method with the includeSystemManaged parameter set to true. This will return a list of the available reporting jobs. All jobs with the systemManaged property set to true are jobs for the new report types.
  3. Store the IDs of the jobs you want download reports for.

Download reports

  1. Get an OAuth token (authentication credentials)
  2. Call the reports.list method with the jobId parameter set to the ID found in the previous section to retrieve a list of downloadable reports created by that job.
  3. Choose a report from the list and download it using its downloadUrl.

Client libraries and sample code
Client libraries exist for many different programming languages to help you use the YouTube Reporting API. Our Java, PHP, and Python code samples will help you get started. The API Explorer lets you try out sample calls before writing any code.

Posted by Markus Lanthaler, Tech Lead YouTube Analytics APIs, recently watched “Crushing gummy bears with hydraulic press” and Mihir Kulkarni, Software Engineer, recently watched “The $21,000 first class airplane seat.”

Saying goodbye to the YouTube v2 Uploads API service

If you’re already using or migrated to the YouTube Data API v3, you can stop reading.

If you develop a tool, script, plugin, or any other code that uploads video to YouTube, we have an important update for you! On October 31, 2016, we’ll be shutting down the ability to upload videos through the old YouTube Data API (v2) service. This shutdown is in accordance with our prior deprecation announcements for the YouTube Data API (v2) service in 2014 and ClientLogin authentication in 2013.

If you’re using this service, unless changes are made to your API Client(s), your users will no longer be able to upload videos using your integration starting October 31, 2016.

We announced this deprecation over two years ago to give our developer community time to adjust. If you haven’t already updated, please update your integration as soon as possible. The supported method for programmatically uploading videos to YouTube is the YouTube Data API v3 service, with OAuth2 for authentication.

You can find a complete guide to uploading videos using this method, as well as sample Python code, on the Google Developers site.

Did you already update your integration to use the YouTube Data API v3 service and OAuth2? It’s possible there are users who may still be on old versions of your software. You may want to reach out to your users and let them know about this. We may also reach out to YouTube creators who are using these old versions and let them know about this as well.

If you have questions about this shutdown or about the YouTube Data API v3 service, please post them to our Stack Overflow tag. You can also send us a tweet at @YouTubeDev, and follow us for the latest updates.

Posted by Marc Chambers, YouTube Developer Relations

An updated Terms of Service and New Developer Policies for the YouTube API Services

Today we are announcing changes to the YouTube API Services Terms of Service and introducing new Developer Policies to guide their implementation. These updated Terms of Service and new Developer Policies will take effect in six months so that you have time to understand and implement them.

The YouTube API Services Terms of Service are developers’ rules of the road, and like any rules of the road, they need to be updated over time as usage evolves. As we've grown, so has an entire ecosystem of companies that support users, creators and advertisers, many of them built on top of YouTube’s API Services. We haven’t had major updates to our API Services Terms of Service in over four years, so during the past several months we've been speaking to developers and studying how our API Services are being used to make sure that our terms make sense for the YouTube of today. We updated the YouTube API Services Terms of Service to keep up with usage growth, strengthen user controls and protections even further, and address misuse. You can find the updated terms here.

In order to provide more guidance to developers, which has been a key ask, we are introducing new Developer Policies. They aim to provide operational guidelines for accessing and using our API Services, covering user privacy and data protection, data storage, interface changes, uploads, comments, and more. You can read the full Developer Policies here.

In addition to the new terms, we're also announcing the upcoming YouTube’s Measurement Program. This new certification program will help participants provide accurate, consistent, and relevant YouTube measurement data to their clients and users, thereby helping them make informed decisions about YouTube. We’ll launch the program with a few initial partners before scaling it more broadly. Please visit the YouTube’s Measurement Program website to learn more.

We developed these updates with a few core principles in mind:
  • Improving the YouTube experience for users and creators. Every month, we update our app and site with dozens of new features for users and creators. We want to make sure that every application or website takes advantage of the latest and greatest YouTube functionalities. That’s why we’re introducing a Requirement of Minimum Functionality, which is designed to ensure users have a set of basic functionality around core parts of their YouTube experience, like video playback, comment management, video upload, and other services.
  • Strengthening user data and privacy. We want to help foster innovative products while giving users even more control around data privacy and security. These updated terms serve to strengthen our existing user controls and protections even further. For example, we now require developers to have a privacy policy that clearly explains to users what user info is accessed, collected and stored.
  • Fostering a healthy YouTube ecosystem. While we want to continue to encourage growth of our ecosystem, we also need to make sure our terms limit misuse. As the YouTube developer ecosystem evolved, we saw some fantastic uses of our API Services. Sadly, with amazing uses, there have also been a handful of applications that have misused our API Services. These updated terms serve to further protect against misuse and protect users, creators, and advertisers.
It's been great to see all the ways developer websites and applications have integrated with YouTube. We are committed to the YouTube API Services and we continue to invest with new features that will improve the product, such as expanding the Reporting API service with Payment reports, and Custom reports, launching later this year.

While we understand these updated terms and new policies may require some adjustment by developers, we believe they’ll help ensure our ecosystem remains strong and poised for growth. Again, to ensure developers have sufficient time to understand and adapt to these changes, the updated YouTube API Services Terms of Service and the new Developer Policies will take effect six months from now, on February 10, 2017. Please do take the time to read and become familiar with them. If you have any questions please get in touch with us via [email protected].

Posted by Shalini GovilPai, Global Head of Technology Solutions

YouTube’s road to HTTPS

Today we added YouTube to Google's HTTPS transparency report. We're proud to announce that in the last two years, we steadily rolled out encryption using HTTPS to 97 percent of YouTube's traffic.


HTTPS provides critical security and data integrity for the web and for all web users. So what took us so long? As we gradually moved YouTube to HTTPS, we faced several unique challenges:

  • Lots of traffic! Our CDN, the Google Global Cache, serves a massive amount of video, and migrating it all to HTTPS is no small feat. Luckily, hardware acceleration for AES is widespread, so we were able to encrypt virtually all video serving without adding machines. (Yes, HTTPS is fast now.)
  • Lots of devices! You watch YouTube videos on everything from flip phones to smart TVs. We A/B tested HTTPS on every device to ensure that users would not be negatively impacted. We found that HTTPS improved quality of experience on most clients: by ensuring content integrity, we virtually eliminated many types of streaming errors.
  • Lots of requests! Mixed content—any insecure request made in a secure context—poses a challenge for any large website or app. We get an alert when an insecure request is made from any of our clients and will block all mixed content using Content Security Policy on the web, App Transport Security on iOS, and uses CleartextTraffic on Android. Ads on YouTube have used HTTPS since 2014.


We're also proud to be using HTTP Secure Transport Security (HSTS) on youtube.com to cut down on HTTP to HTTPS redirects. This improves both security and latency for end users. Our HSTS lifetime is one year, and we hope to preload this soon in web browsers.

97 percent is pretty good, but why isn't YouTube at 100 percent? In short, some devices do not fully support modern HTTPS. Over time, to keep YouTube users as safe as possible, we will gradually phase out insecure connections.

In the real world, we know that any non-secure HTTP traffic could be vulnerable to attackers. All websites and apps should be protected with HTTPS — if you’re a developer that hasn’t yet migrated, get started today.

Sean Watson, Software Engineer, recently watched "GoPro: Fire Vortex Cannon with the Backyard Scientist."
Jon Levine, Product Manager, recently watched "Sega Saturn CD - Cracked after 20 years."

Machine learning for video transcoding

At YouTube we care about the quality of the pixels we deliver to our users. With many millions of devices uploading to our servers every day, the content variability is so huge that delivering an acceptable audio and video quality in all playbacks is a considerable challenge. Nevertheless, our goal has been to continuously improve quality by reducing the amount of compression artifacts that our users see on each playback. While we could do this by increasing the bitrate for every file we create, that would quite easily exceed the capacity of many of the network connections available to you. Another approach is to optimize the parameters of our video processing algorithms to meet bitrate budgets and minimum quality standards. While Google’s compute and storage resources are huge, they are finite and so we must temper our algorithms to also fit within compute requirements. The hard problem then is to adapt our pipeline to create the best quality output for each clip you upload to us, within constraints of quality, bitrate and compute cycles.


This is a well known triad in the world of video compression and transcoding. The problem is usually solved by finding a sweet spot of transcoding parameters that seem to work well on average for a large number of clips. That sweet spot is sometimes found by trying every possible set of parameters until one is found that satisfies all the constraints. Recently, others have been using this “exhaustive search” idea to tune parameters on a per clip basis.


What we’d like to show you in this blog post is a new technology we have developed that adapts our parameter set for each clip automatically using Machine Learning. We’ve been using this over the last year for improving the quality of movies you see on YouTube and Google Play.


The good and bad about parallel processing


We ingest more than 400 hours of video per minute. Each file must be transcoded from the uploaded video format into a number of other video formats with different codecs so we can support playback on any device you might have. The only way we can keep up with that rate of ingest and quickly show you your transcoded video in YouTube is to break each file in pieces called “chunks,” and process these in parallel. Every chunk is processed independently and simultaneously by CPUs in our Google cloud infrastructure. The complexity involved in chunking and recombining the transcoded segments is significant. Quite aside from the mechanics of assembling the processed chunks, maintaining the quality of the video in each chunk is a challenge. This is because to have as speedy a pipeline as possible, our chunks don’t overlap, and are also very small; just a few seconds. So the good thing about parallel processing is increased speed and reduced latency. But the bad thing is that without the information about the video in the neighboring chunks, it’s now difficult to control chunk quality so that there is no visible difference between the chunks when we tape them back together. Small chunks don’t give the encoder much time to settle into a stable state hence each encoder treats each chunk slightly differently.

Smart parallel processing


You could say that we are shooting ourselves in the foot before starting the race. Clearly, if we communicate information about chunk complexity between the chunks, each encoder can adapt to what’s happening in the chunks after or before it. But inter-process communication increases overall system complexity and requires some extra iterations in processing each chunk.


Actually, OK, truth is we’re stubborn here in Engineering and we wondered how far we could push this idea of “don’t let the chunks talk to each other.”


The plot below shows an example of the PSNR in dB per frame over two chunks from a 720p video clip, using H.264 as the codec. A higher value of PSNR means better picture quality and a lower value means poorer quality. You can see that one problem is the quality at the start of a chunk is very different from that at the end of the chunk. Aside from the average quality level being worse than we would like, this variability in quality causes an annoying pulsing artifact.


Because of small chunk sizes, we would expect that each chunk behaves like the previous and next one, at least statistically. So we might expect the encoding process to converge to roughly the same result across consecutive chunks. While this is true much of the time, it is not true in this case. One immediate solution is to change the chunk boundaries so that they align with high activity video behaviour like fast motion, or a scene cut. Then we would expect that each chunk is relatively homogenous so the encoding result should be more uniform. It turns out that this does improve the situation, but not as much as we’d like, and the instability is still often there.


The key is to allow the encoder to process each chunk multiple times, learning on each iteration how to adjust its parameters in anticipation of what happens in across the entire chunk instead of just a small part of it. This results in the start and end of each chunk having similar quality, and because the chunks are short, it is now more likely that the differences across chunk boundaries are also reduced. But even then, we noticed that it can take quite a number of iterations for this to happen. We observed that the number of iterations is affected a great deal by the quantization related parameter (CRF) of the encoder on that first iteration. Even better, there is often a “best” CRF that allows us to hit our target bitrate at a desired quality with just one iteration. But this “best” setting is actually different for every clip. That’s the tricky bit. If only we could work out what that setting was for each clip, then we’d have a simple way of generating good looking clips without chunking artifacts.


The plot on the right shows the result of many experiments with our encoder at varying CRF (constant quality) settings, over the same 1080p clip. After each experiment we measured the bitrate of the output file and each point shows the CRF, bitrate pair for that experiment. There is a clear relationship between these two values. In fact it is very well modeled as an exponential fit with three3 parameters, and the plot shows just how good that modeled line is in fitting the observed data points. If we knew the parameters of the line for our clip, then we’d see that to create a 5 Mbps version of this clip (for example) we’d need a CRF of about 20.

Pinky and the Brain


What we needed was a way to predict our three3 curve fitting parameters from low complexity measurements about the video clip. This is a classic problem in machine learning, statistics and signal processing. The gory mathematical details of our solution are in technical papers that we published recently.1 You can see there how our thoughts evolved. Anyway, the idea is rather simple: predict the three3 parameters given things we know about the input video clip, and read off the CRF we need. This prediction is where the “Google Brain” comes in.


The “things we know about the input video clip” are called video “features.” In our case there are a vector of features containing measurements like input bit rate, motion vector bits in the input file, resolution of the video and frame rate. These measurements can also be made from a very fast low quality transcode of the input clip to make them more informative. However, the exact relationship between the features and the curve parameters for each clip is rather more complicated than an equation we could write down. So instead of trying to discover that explicitly ourselves, we turned to mMachine lLearning with Google Brain. We first took about 10,000 video clips and exhaustively tested every quality setting on each, measuring the resulting bitrate from each setting. This gave us 10,000 curves which in turn gave us 4 x 10,000 parameters measured from those curves.


The next step was to extract features from our video clips. Having generated the training data and the feature set, our Machine Learning system learned a “Brain” configuration that could predict the parameters from the features. Actually we used both a simple “regression” technique as well as the Brain. Both outperformed our existing strategy.  Although the process of training the Brain is relatively computationally heavy, the resulting system was actually quite simple and required only a few operations on our features. That meant that the compute load in production was small.


Does it work?

The plot on the right shows the performance of the various systems on 10,000 video clips. Each point (x,y) represents the percentage of clips (y-axis) in which the resulting bitrate after compression is within x% of the target bitrate. The blue line shows the best case scenario where we use exhaustive search to get the perfect CRF for each clip. Any system that gets close to that is a good one. As you can see at the 20% rate, our old system (green line) would hit the target bitrate 15% of the time. Now with our fancy Brain system we can hit it 65% of the time if we use features from your upload only (red line), and better than 80% of the time (dashed line) using some features from a very fast low quality transcode.
nn_wp_prediction.png


But does this actually look good? You may have noticed that we concentrated on our ability to hit a particular bitrate rather than specifically addressing picture quality. Our analysis of the problem showed that this was the root cause. Pictures are the proof of the pudding and you can see some frames from a 720p video clip below (shot from a racing car). The top row shows two frames at the start and end of a typical chunk and you can see that the quality in the first frame is way worse than the last. The bottom row shows the frames in the same chunk using our new automated clip adaptive system. In both cases the measured bitrate is the same at 2.8 Mbps. As you can see, the first frame is much improved and as a bonus the last frame looks better as well. So the temporal fluctuation in quality is gone and we also managed to improve the clip quality overall.


This concept has been used in production in our video infrastructure division for about a year. We are delighted to report it has helped us deliver very good quality streams for movies like "Titanic" and most recently "Spectre." We don’t expect anyone to notice, because they don’t know what it would look like otherwise.

But there is always more we can do to improve on video quality. We’re working on it. Stay tuned.

Anil Kokaram, Engineering Manager, AV Algorithms Team, recently watched "Tony Cozier speaking about the West Indies Cricket Heritage Centre," Yao Chung Lin, Software Engineer, Transcoder Team, recently watched "UNDER ARMOUR | RULE YOURSELF | MICHAEL PHELPS," Michelle Covell, Research Scientist, recently watched "Last Week Tonight with John Oliver: Scientific Studies (HBO)" and Sam John, Software Engineer, Transcoder Team, recently watched "Atlantis Found: The Clue in the Clay | History."


1Optimizing transcoder quality targets using a neural network with an embedded bitrate model, Michele Covell, Martin Arjovsky, Yao-Chung Lin and Anil Kokaram, Proceedings of the Conference on Visual Information Processing and Communications 2016, San Francisco
Multipass Encoding for reducing pulsing artefacts in cloud based video transcoding, Yao-Chung Lin, Anil Kokaram and Hugh Denman, IEEE International Conference on Image Processing, pp 907-911, Quebec 2015

Because retro is in — announcing historical data in the YouTube Reporting API

YouTube creators rely on data -- data about how their channel is performing, data about their video’s ratings, their earnings. Lots of data. That’s why we launched the YouTube Reporting API back in October, which helps you bulk up your data requests while keeping them on a low-quota diet.

Reports made with the API started from the day you scheduled them, going forward. Now that it’s been in the wild, we’ve heard another request loud and clear: you don’t just want current data, you want older data, too. We’re happy to announce that the Reporting API now delivers historical data covering 180 days prior to when the reporting job is first scheduled (or July 1st, 2015, whichever is later.)

Developers with a keen eye may have already noticed this, as it launched a few weeks ago! Just in case you didn’t, you can find more information on how historical data works by checking out the Historical Data section of the Reporting API docs.

(Hint: if you’ve already got some jobs scheduled, you don’t need to do anything! We’ll generate the data automatically.)

New to the Reporting API? Tantalized by the possibility of all that historical data? Our documentation explains everything you need to know about scheduling jobs and the types of reports available. Try it out with our API Explorer, then dive into the sample code or write your own with one of our client libraries.

Happy reporting,

YouTube Developer Relations on behalf of Alvin Cham, Markus Lanthaler, Matteo Agosti, and Andy Diamondstein

Announcing the Mobile Data Plan API

More than half of YouTube watch time happens on mobile devices, with a large and rapidly increasing fraction of this time spent on cellular networks. At the same time, it is common for users to have mobile data plans with usage limits. Users who exhaust their quota can incur overage charges, have their data connections turned off and speeds reduced. When this happens, application performance suffers and user satisfaction decreases.

At the root of this problem lies the fact that users do not have an easy manner to share data plan information with an application, and, in turn, applications cannot optimize the user’s experience. In an effort to address this limitation we have worked with a few partners in the mobile ecosystem to specify an API that improves data transparency.

At a high level, the API comprises two parts. First, a mechanism for applications to establish an anonymous identifier of the user’s data plan. This new, Carrier Plan Identifier (CPID), protects the user’s identity and privacy. Second, a mechanism that allows applications, after establishing a CPID, to request information about the user’s data plan from the mobile network operator (MNO). Applications communicate with MNOs using HTTPS and the API encodes data plan information in an extensible JSON-based format.

We believe the API will improve transparency and Quality of Experience (QoE) for mobile applications such as YouTube. For example, the cost of data can depend on the time of day, where users get discounts for using the network during off-peak hours. For another example consider that while users with unlimited data plans may prefer high resolution videos, users who are about to exceed their data caps or are in a busy network may be better served by reduced data rate streams that extend the life of the data plan while still providing good quality.

Cellular network constraints are even more acute in countries where the cost of data is high, users have small data budgets, and networks are overutilized. With more than 80% of views from outside the United States, YouTube is the first Google application conducting field trials of the Mobile Data Plan API in countries, such as Malaysia, Thailand, the Philippines and Guatemala, where these characteristics are more prominent. These trials aim to bring data plan information as an additional real-time input to YouTube’s decision engine tuned to improve QoE.

We believe the same data plan information will lay the foundation for other applications and mobile operators to innovate together. This collaboration can make data usage more transparent to users, incentivize efficient use of mobile networks, and optimize user experience.

We designed the API in cooperation with a number of key partners in the mobile ecosystem, including Telenor Group, Globe Telecom and Tigo, all of which have already adopted and implemented this API. Google also worked with Ericsson to support the Mobile Data Plan API in their OTT Cloud Connect platform. We invite other operators and equipment vendors to implement this solution and offer applicable products and services to their customers.

The Mobile Data Plan API specification is available from this link. We are looking forward to your comments and we are available at: [[email protected]].

Posted by Andreas Terzis, technical lead at Google Access, & Jessica Xu, product manager at YouTube.

A look into YouTube’s video file anatomy

Over 1 billion people use YouTube, watching hundreds of millions of hours of content all over the world everyday. We have been receiving content at a rate exceeding 100 hours/min for the last three years (currently at 400 hours/min). With those kinds of usage statistics what we see on ingest actually says something about the state of video technology today.

Video files are the currency of video sharing and distribution over the web. Each file contains the video and audio data wrapped up in some container format and associated with metadata that describes the nature of the content in some way. To make sure each user can “Broadcast yourself” we have spent years building systems that can faithfully extract the video and audio data hidden inside almost any kind of file you can imagine. That is why when our users upload to YouTube they have confidence that their video and audio will always appear.

The video and audio data is typically compressed using a codec and of course the data itself comes in a variety of resolutions, frame rates, sample rates and channels (in the case of audio). As technology evolves, codecs get better, and the nature of the data itself changes, typically toward higher fidelity. But how much variety is there in this landscape and how has that variety changed with time? We’ve been analyzing the anatomy of files you’ve been uploading over the years and think it reflects how video technology has changed.

Audio/video file anatomy

Audio/video files contain audio and video media which can be played or viewed on some multimedia devices like a TV or desktop or smartphone. Each pixel of video data is associated with values for brightness and color which tells the display how that pixel should appear. A quick calculation on the data rate for the raw video data shows that for 720p video at 30 frames per second the data rate is in excess of 420 Mbits/sec. Raw audio data rates are smaller but still significant at about 1.5 MBits/sec for 44.1 KHz sampling with 16 bits per sample. These rates are well in excess of the 10’s of MBits/sec (at most) that many consumers have today. By using compression technology that same > 400 MBits/sec of data can be expressed in less than 5 Mbits/sec. This means that audio and video compression is a vital part of any practical media distribution system. Without compression we would not be able to stream media over the internet in the way everyone enjoys now.

There are three main components of media files today: the container, the compressed bitstream itself and finally metadata. The bitstream (called the video and audio “essence”) contains the actual audio and video media in a compressed form. It will also contain information about the size of the pictures and start and end of frames so that the codec knows how to decode the picture data in the right way. This information embedded in the bitstream is still not enough though. The “container” refers to the additional information that helps the decoder work out when a video frame is to be played, and when the audio data should be played relative to the frame. The container often also holds an index to the start of certain frames in the bitstream. This makes it easier for a player system to allow users to “seek” or “fast forward” through the contents. The container will also hold information about the file content itself like the author, and other kinds of “metadata” that could be useful for a rights holder or “menu” on a player for instance. So the bitstream contains the actual picture and audio, but the container lets the player know how that content should be played.

Standardization of containers and codecs was vital for the digital video industry to take off as it did in the late 1990s. The Motion Picture Experts Group (MPEG) was the consortium responsible and they are still active today. The interaction between containers and codecs has been so tight in the past that quite often the container and the codec might have the same name, because they arise from the same standards document. Needless to say, there are many different standards for the various components in a media file. Today we have MPEG and the Alliance for Open Media (AOM) emerging as the two major bodies engaged in creating new media compression and distribution technology. This is what makes the job of YouTube so challenging. We must correctly decode your content despite the endless variety, and despite the frequent errors and missing component in uploaded files. We deal with thousands of combinations of containers and codecs every week.

Containers

The plot below shows the percentage of files uploaded having the same container month on month over the last five years. Each container is associated with the same color over time. The legend is ordered from the bottom up. The container type used in the largest fraction of uploads is at the bottom.


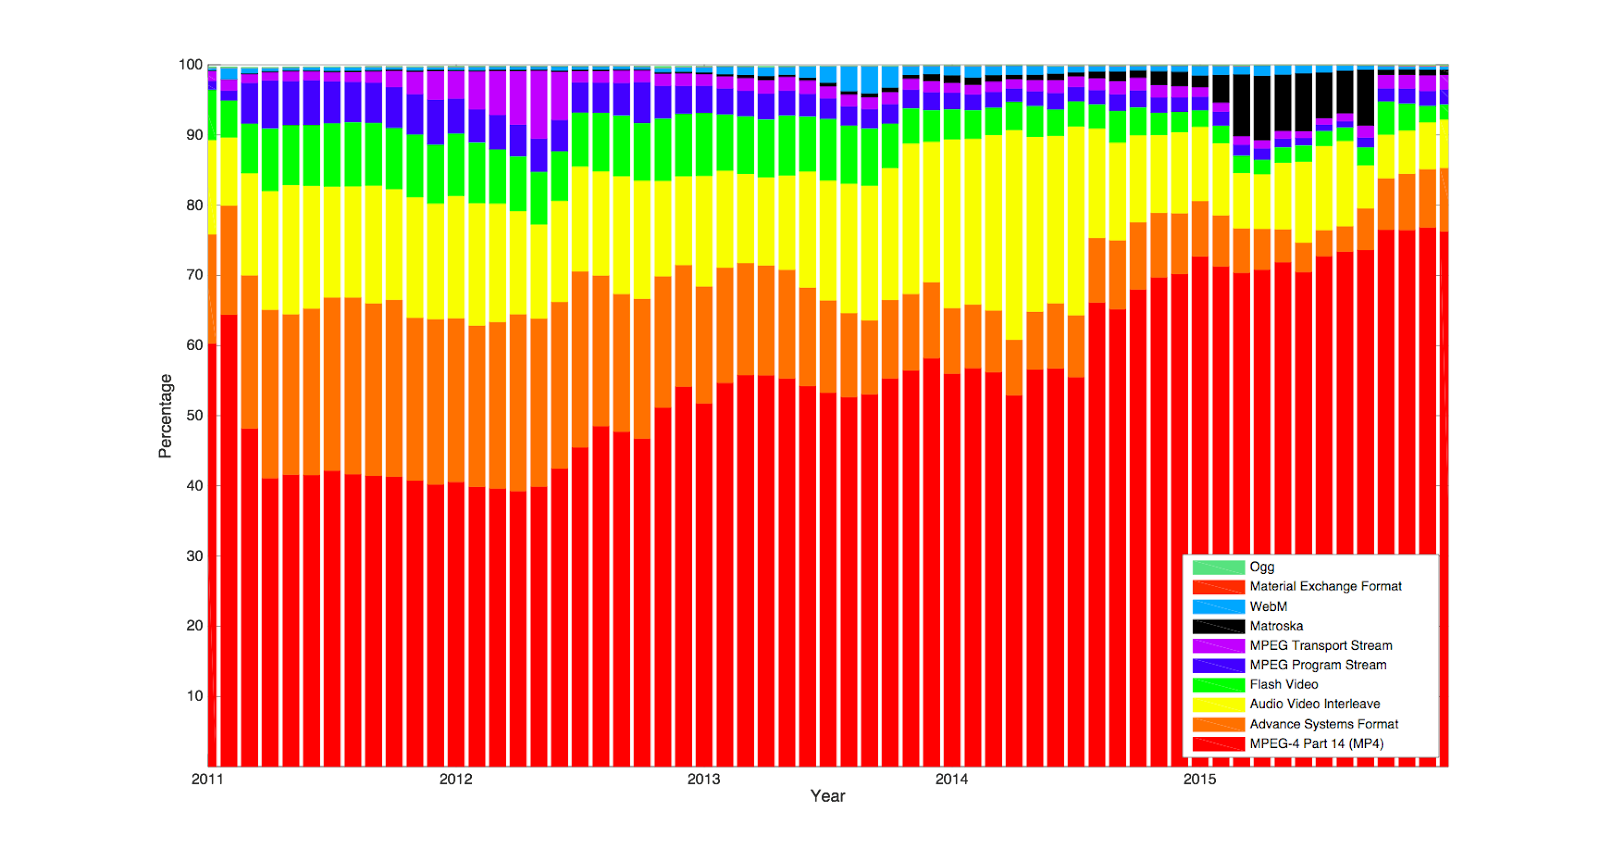
In 2011, MP4 (.mp4), Audio Video Interleave (.avi), Flash Video (.flv), Advanced Systems Format (.asf) and MPEG Transport Stream (.ts) were more equally distributed than they are now. But over the years MP4 has overtaken them all to become the most common ingest container format. Open source formats like WebM and Matroska seem to have been slowly gaining in popularity since about 2012, which is when we started rolling out the open source VP9 codec. Windows Media files (using the .asf container) and Flash Video have declined significantly. On the other end of the scale, files using Creative Labs video containers (for instance), which were popular before 2011, are hardly ever seen in our ingest today.
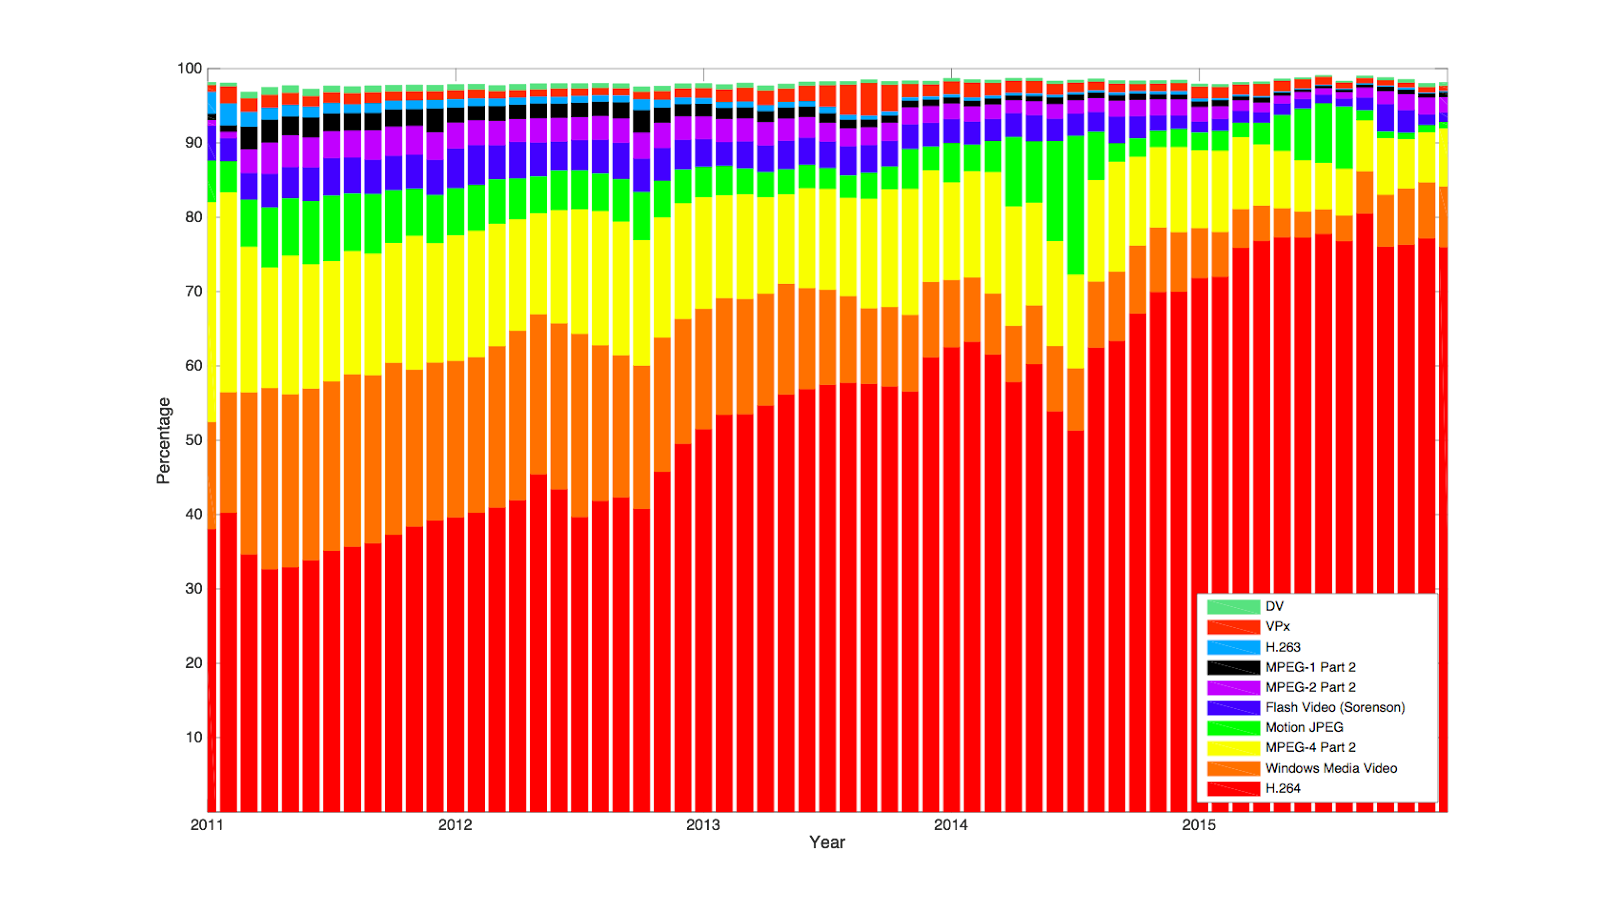
Codecs

The history of ingested codec types reflects the speed with which new codecs are adopted by hardware manufacturers and the makers of software editing and conforming systems. The chart below looks at the top ten video codecs back in 2011 and reveals how they have fared since then in our ingest profile. The VP range of codecs (VP6 - VP8) do still figure in our ingest today and in fact compared to 2011, VP8 ranks seventh in our top ten in 2015. Clearly H.264 is the dominant codec we see in use for upload to YouTube now, but MPEG4 and Windows Media bitstreams are still significant. This is very different from the situation in 2011 when almost every codec had a significant share of our ingest profile. This reflects how heterogeneous the video compression landscape was five years ago, with no dominant compression technology. The chart shows how rapidly the ecosystem moves to adopt a compression technology as soon as it proves itself: just five years. Uploads from mobile devices have also driven this trend as efficient codec technology enables more uploads from low power devices with low bandwidth availability. In that time we have seen the almost complete erosion of Flash Video (FLV) and MPEG1/2 video for upload to YouTube, which all appear to have reached some kind of low volume steady state behavior in our ingest.


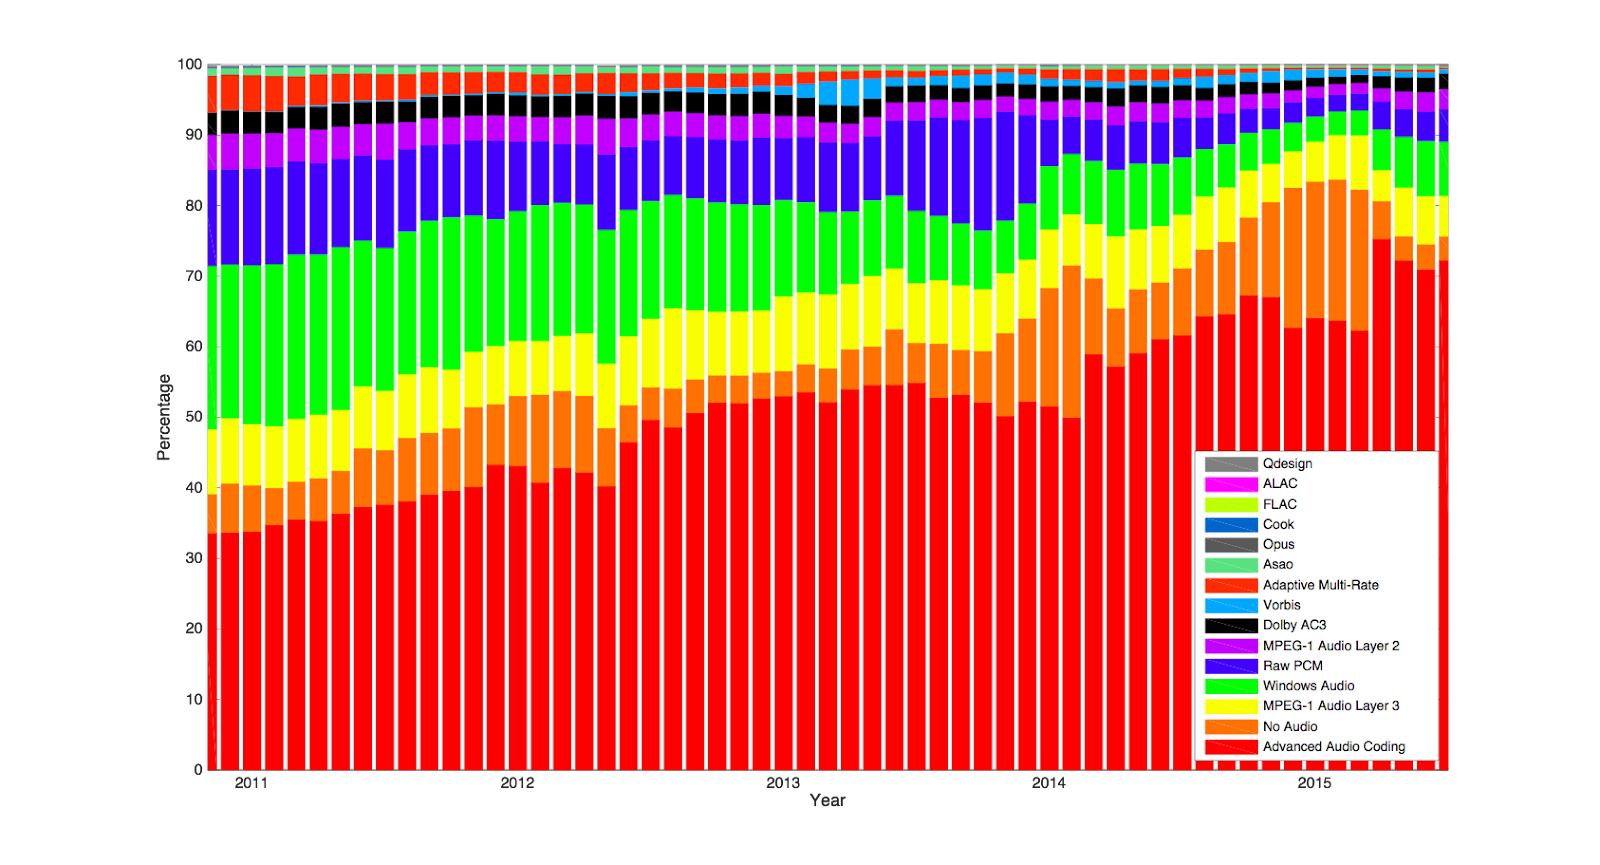
The situation with audio codecs follows similar trends. The chart below shows the top 15 codecs we see on ingest, measured over 2015. Five years ago we saw a very heterogeneous landscape with Raw audio data (PCM), Windows Media (WMA), MPEG and Advanced Audio (AAC) all contributing significant proportions. Over the intervening time the AAC codec has grown to dominate the profile of audio codecs, but PCM, WMA and MP3 are still significant. It's interesting that we see a pretty steady rate of media with no audio at all (shown as “No Audio”), although the total proportion is of course small. The use of the VORBIS open source audio codec got a boost in 2012 when the new version was released. Although it is hard to see from the chart, OPUS follows a similar pattern with uploads starting to kick off in late 2012 once the reference software was available and then a boost in uploads in 2013 coinciding with the next API release.


Properties

But what about the nature of video and audio media itself? Is there evidence to show that capture is increasing in resolution and color fidelity? This section reinforces the law that “in the internet everything gets bigger with time.”
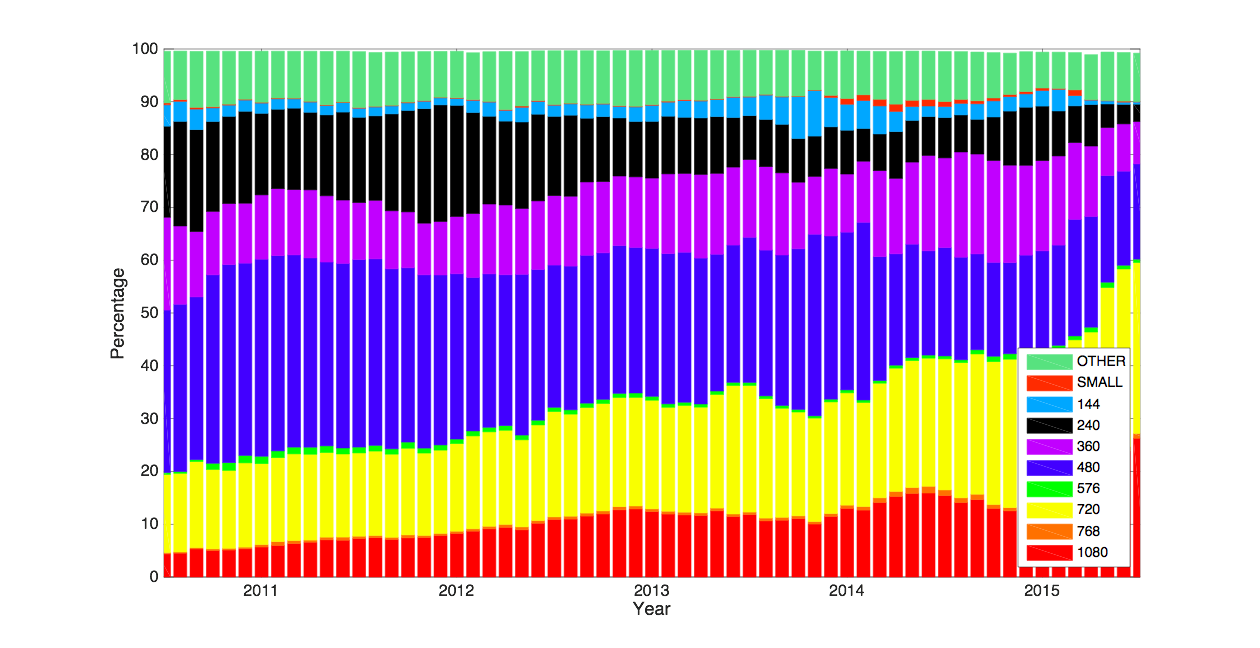
Picture size

The chart below stacks the proportions of each resolution in our ingest against month. The legend shows the top ten resolutions by proportion of ingest as measured over the last year, with the topmost label being the largest proportion. There is always some disparity between “standard” picture sizes and the actual uploaded sizes. Those which do not fall into the labels used here are allocated to “OTHER.” Although the vast majority of our ingest shows standard picture sizes, that “OTHER” category has been persistently steady, showing that there will always be about 10 percent of our uploaders who upload non-standard sizes. The trend is clearly toward bigger pictures, with 480p dominating five years ago and HD (720p and 1080p) dominating now. It is interesting that we do not see step changes in behavior but rather a gradual acceleration to higher pixel densities. The 480p resolution does appear to be in a permanent decline however. 720p seems set to replace “vanilla” 480p in about a year.


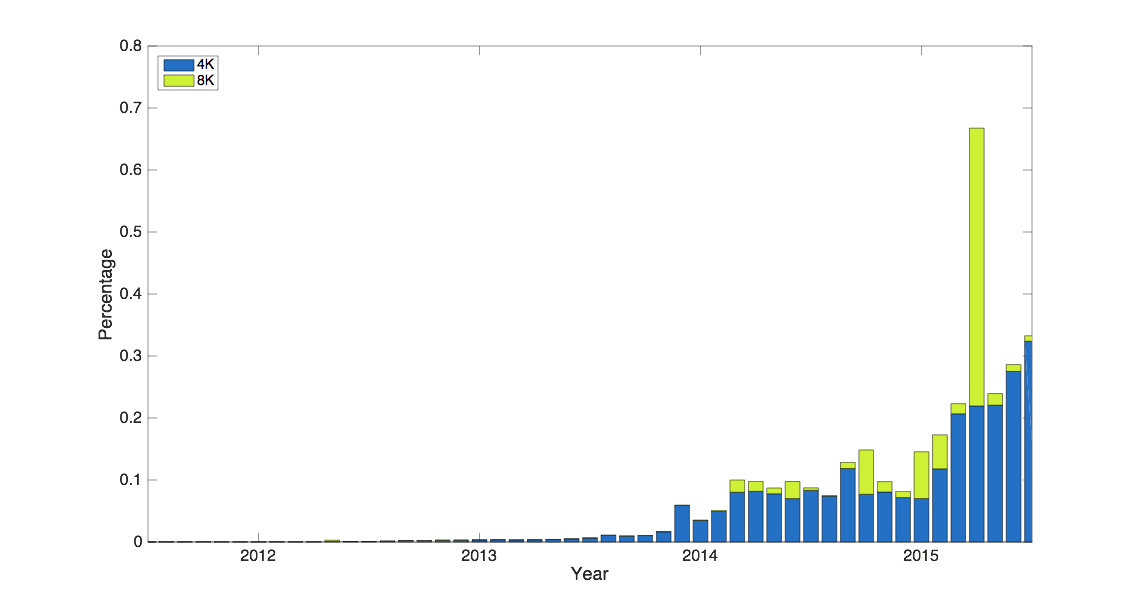
With the 4K and 8K formats we see rapid take-up reflected in our ingest. The chart below breaks out just these two resolutions. Although understandably small as a proportion of the whole YouTube ingest profile, these formats are still significant and we notice that the take-up accelerated/spiked once announcements were made in 2013 (4K) and 2015 (8K). What is even more interesting is that the upload of 4K content started well before “official” announcement of the support. Our creators are always pushing the limits of our ingest and this is good evidence.
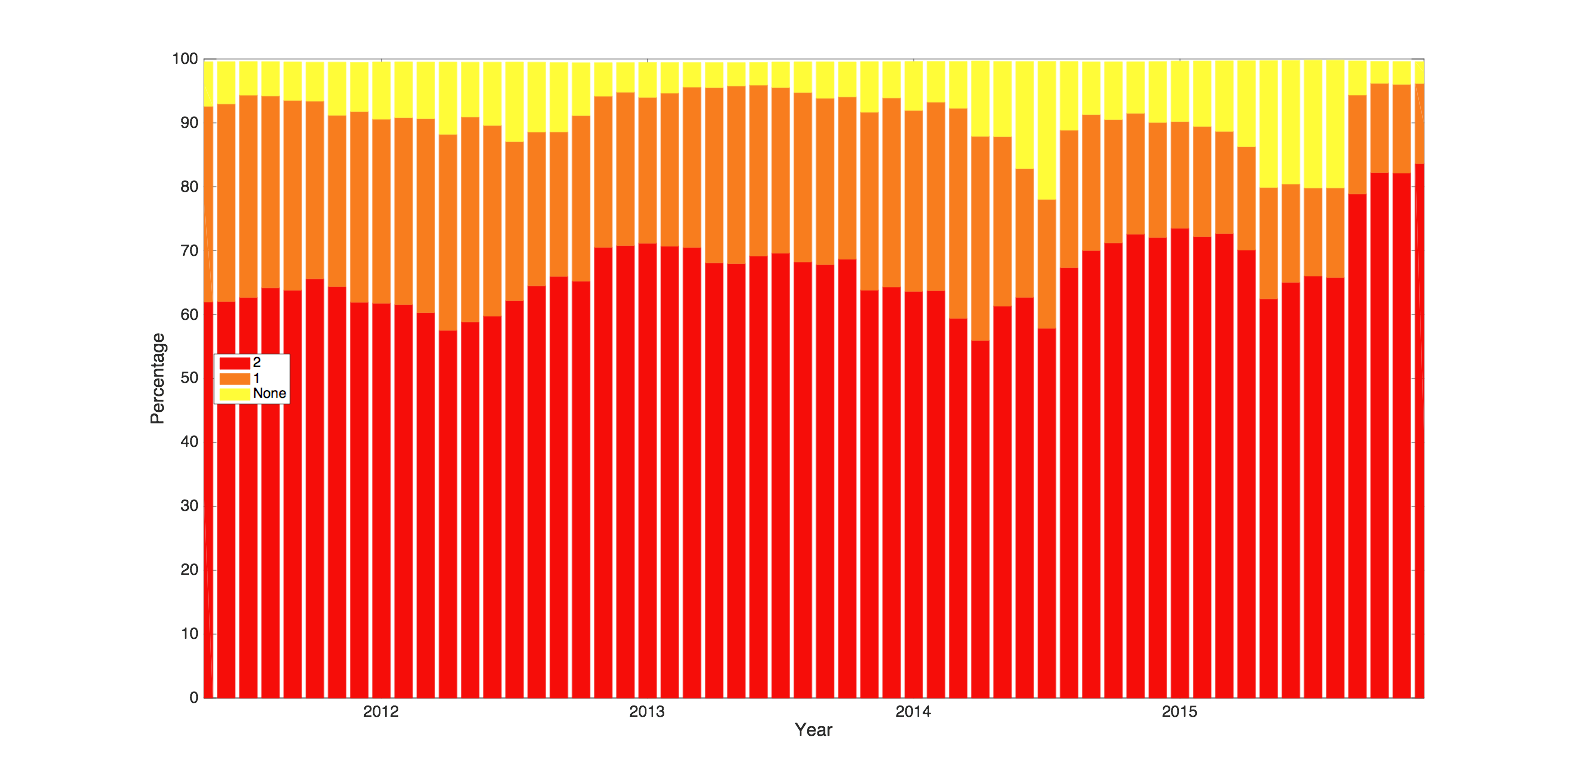


Audio channels

We observe that an increasing percentage of our media, which contain audio, contain stereo audio tracks as shown below in red. We also show here the relative amount of files having no audio (about 5 percent in 2015), and the trend is similar here as in the audio codec chart shown previously. A growing proportion of tracks contain 5.1 material but that is swamped by the amount of mono and stereo sound files. Making a linear prediction of the curves below would seem to imply that mono audio will decline to less than 5 percent of ingest in just over a year’s time.
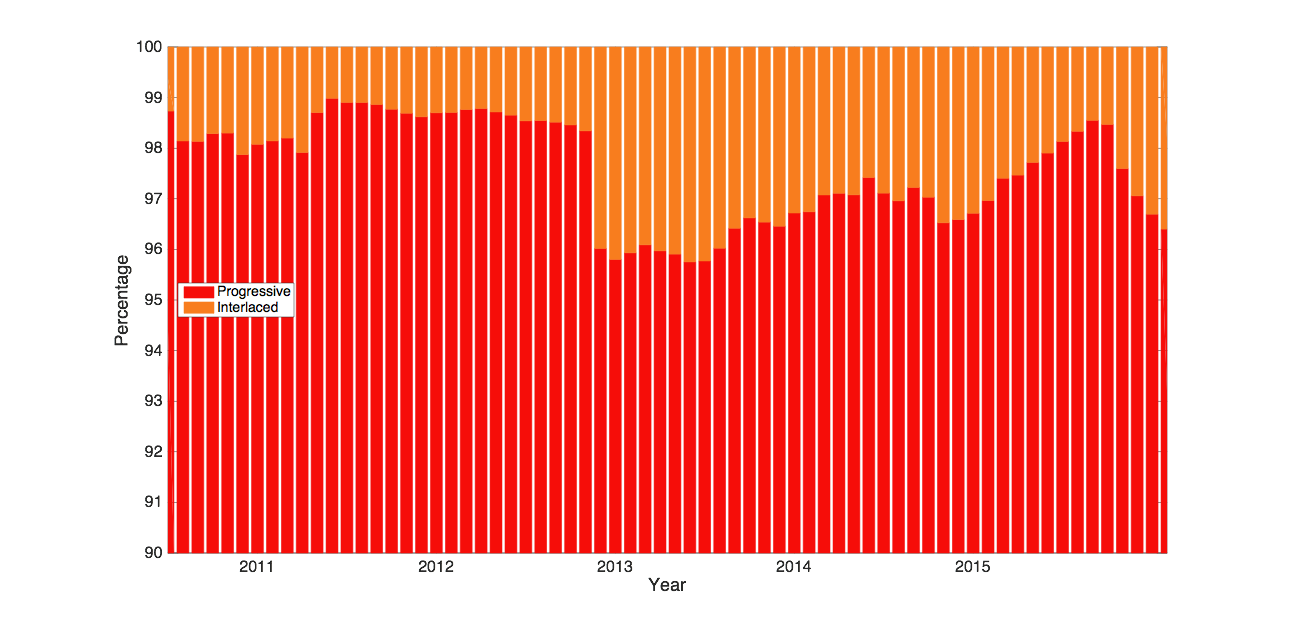


Interlacing

Interlacing is still with us. This is the legacy TV broadcast practice of constructing a video frame from two half height images that record the odd and even lines of the final frame, but at slightly different times. The fraction of our content that is interlaced on upload appears to be roughly 2-3 percent averaged over the last five years and there is no sign of that actually dwindling. This is perhaps because of the small but significant made-for-TV content that is uploaded. The reasons for the observed rapid changes in some months are intriguing. One suggestion is correlation with unusually large volume TV coverage e.g. 2012 Olympics and the U.S. election.
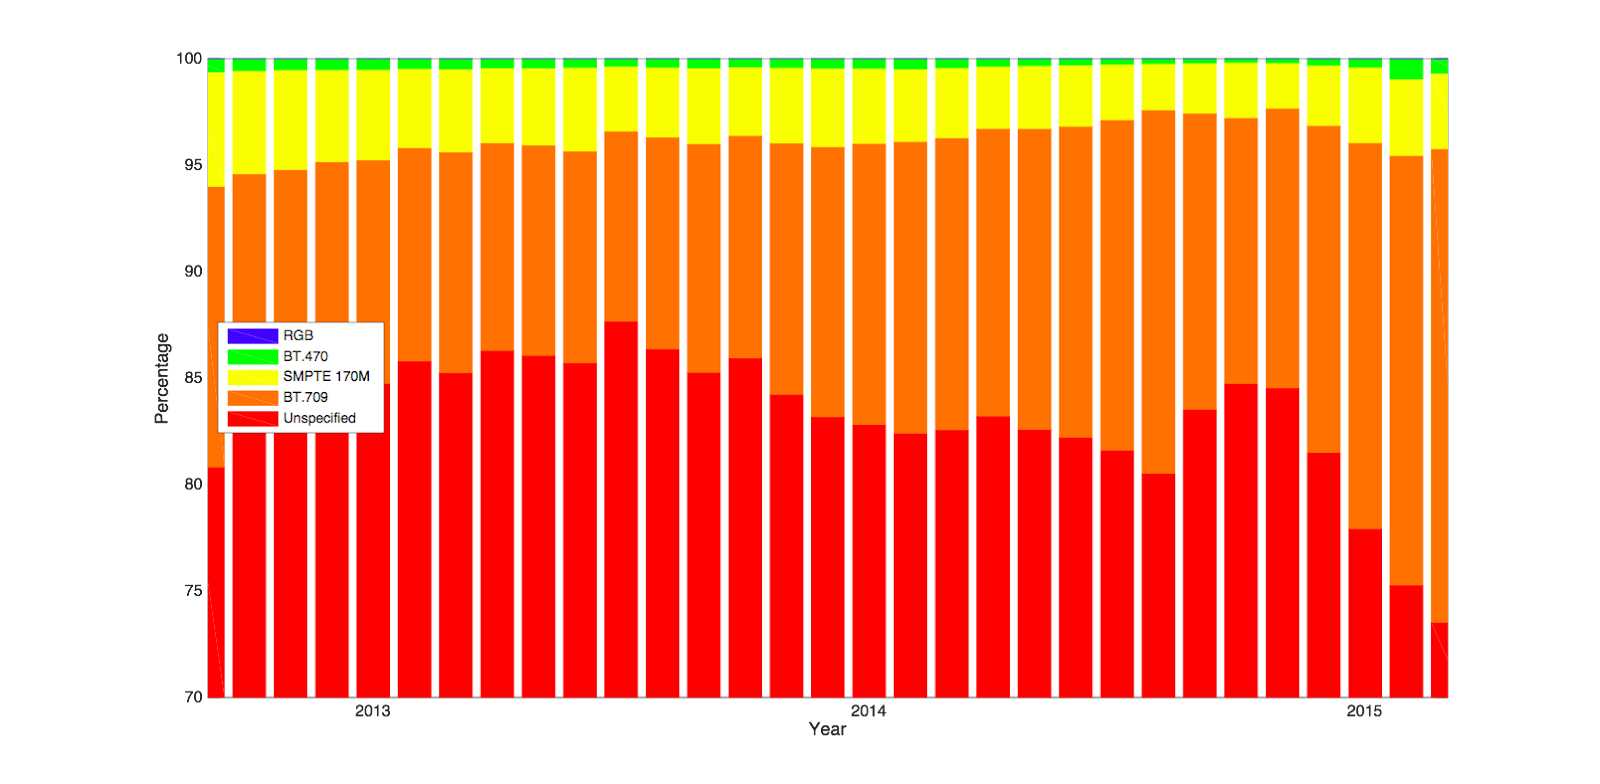


Color spaces

We are continually working on our ability to reproduce color faithfully between ingest and display. This is a notoriously challenging task across the consumer display industry for TV’s, monitors and mobile devices. The first step to color nirvana is the correct specification of the color space in the associated video file. Although color space specifications have been in place for some time, it has taken a long while for file-based content to properly represent this data across a wide range of consumer devices. The chart below reflects our observations of the top five spaces we see. We started collecting information in 2012 and compared to the stability in codecs and containers, the specification of color spaces in video data is clearly still evolving. It is only in the last three years that we have started to observe more consistent color labeling of video data, and as the chart shows below, BT709 (the default color space for HD resolution) has emerged as the dominant color space definition. At the end of 2015 there was still an alarmingly large proportion of video files without any color information, more than 70 percent. Note that the vertical axis on the chart below starts from 70 percent. The trend in that proportion is downwards and if we extend our curve of the decline in unspecified color spaces it would appear that it will be about a year before we can expect to see the majority of files having some color specification, and two years for almost all files to contain that metadata. We have just started to observe files expressing the recent BT2020 color space, being ingested at the end of 2015. These of course account for a tiny proportion of ingest (< .005 percent). It does herald the start of the HDR technology rollout though (as BT2020 is a color space associated with that format) and reflects various announcements about HDR capable devices made at CES 2016.


Frame rates

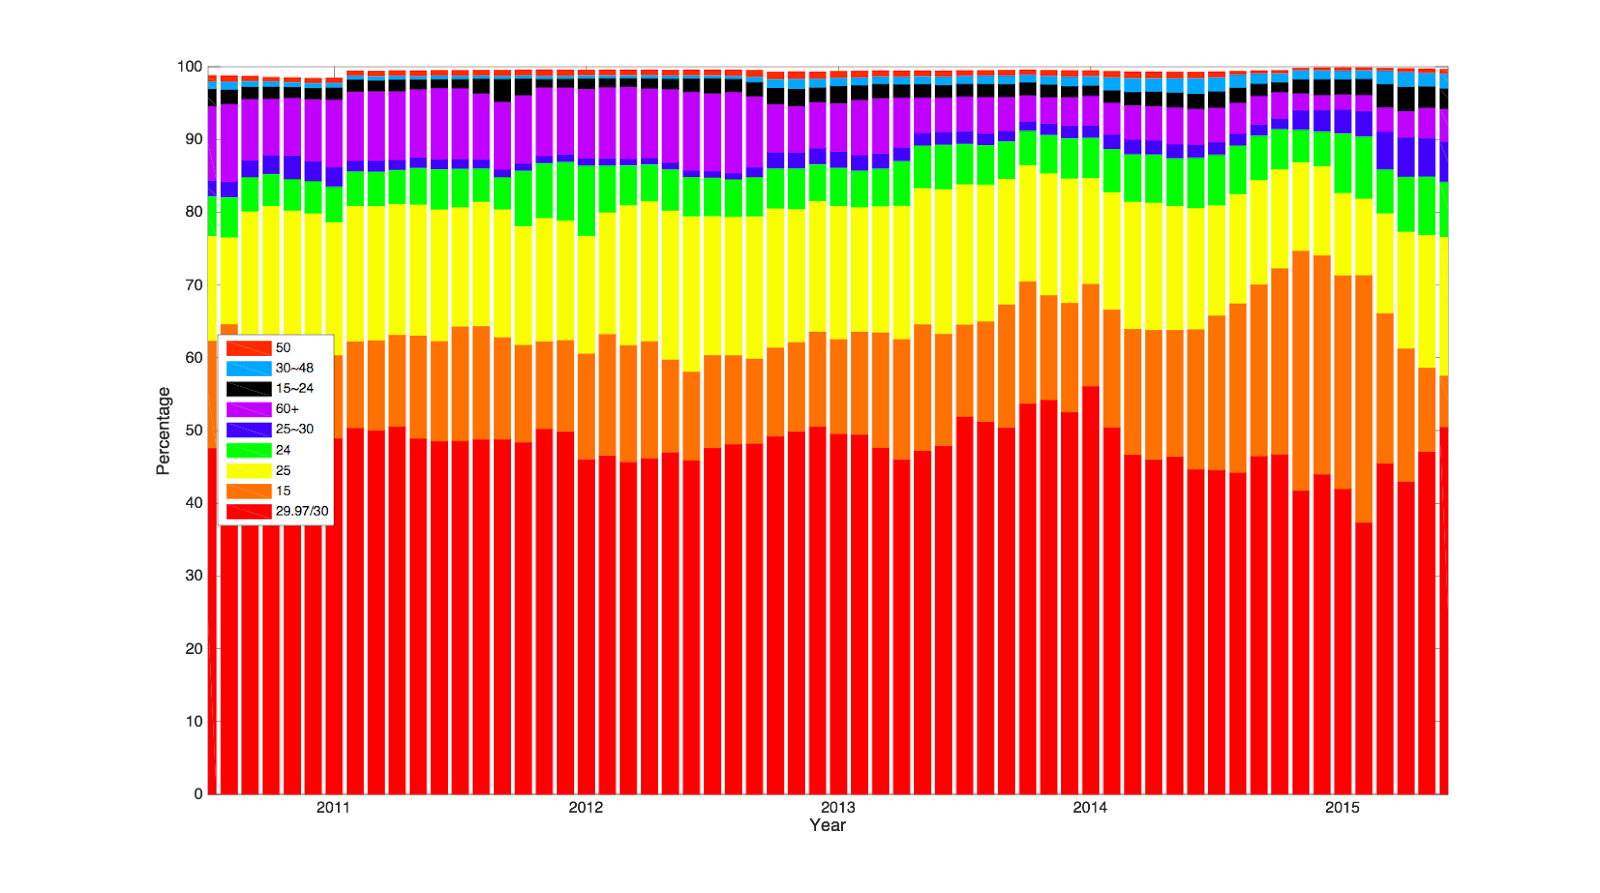
The chart below shows how the use of a range of frame rates has actually not changed that much over time. As expected the U.S. and EU standards of 30 and 25Hz respectively, dominate the distribution. Less expected is that low frame rates of 15fps and lower also significantly impact our ingest. This is because of the relatively large proportion of educational material including slide shows, as well as music slide decks that are uploaded to YouTube. That sort of material tends to be captured at low frame rates. High frame rate (HFR) material (e.g. from 48Hz and upwards) is a steady flow especially since the announcement of HFR support in the YouTube player in 2014. Before 2014, the ceiling of our output target video was 30fps but since then we have raised the ceiling to 60fps. However the trend is not increasing as much as is say 1080p ingest itself. This possibly reflects bandwidth constraints on upload as well as the fact that most capture today especially on mobile devices still defaults to 25 or 30fps.


We continuously analyze both a wide angle and close up view of the video file activity worldwide. That has given us a unique perspective on the evolution of video technology. In a sense the data is a reflection of the consensus of device manufacturers and creators in the area of media capture and creation. So we can see the growing agreement around video codecs, frame rates and stereo audio. Color space specification is still very poor however, and some expected consensus have not emerged. For example in the area of HFR content creation, 60+ fps is not quite yet on a growth curve as HD resolution has been over the last year.

The data presented here show that even in the last five years the variability in data types and formats is reducing. However, as with many broadcasters and streaming sites we see enough variability in our ingested file profiles that we remain keen on standardization activities. We look forward to continuing engagement of the YouTube and Google engineering community in SMPTE, MPEG and AOM activities.

Even with the dominance of certain technologies like H.264/AAC codecs and the MOV type containers, there will always be a small but significant portion of audio video data that falls outside the “consensus.” These small proportions are important to us however, because we want you to be confident that we’re going to do our darndest to help you broadcast yourself no matter what device you use to make your clip.

Anil Kokaram, Tech Lead/Engineering Manager, AV Algorithms Team, recently watched "Carlos Brathwaite's 4 sixes," Thierry Foucu, Tech Lead Transcoder Team, recently watched "Sale of the Century," and Yang Hu, Software Engineer, recently watched "MINECRAFT: How to build wooden mansion."