When tests fail on code that was previously tested, this is a strong signal that something is newly wrong with the code. Before, the tests passed and the code was correct; now the tests fail and the code is not working right. The goal of a good test suite is to make this signal as clear and directed as possible.
Flaky (nondeterministic) tests, however, are different. Flaky tests are tests that exhibit both a passing and a failing result with the same code. Given this, a test failure may or may not mean that there's a new problem. And trying to recreate the failure, by rerunning the test with the same version of code, may or may not result in a passing test. We start viewing these tests as unreliable and eventually they lose their value. If the root cause is nondeterminism in the production code, ignoring the test means ignoring a production bug.
- Flaky Tests at Google
Google has around 4.2 million tests that run on our continuous integration system. Of these, around 63 thousand have a flaky run over the course of a week. While this represents less than 2% of our tests, it still causes significant drag on our engineers.
For a previous discussion of our flaky tests, see John Micco's postfrom May 2016.
- Test size - Large tests are more likely to be flaky
We categorize our tests into three general sizes: small, medium and large. Every test has a size, but the choice of label is subjective. The engineer chooses the size when they initially write the test, and the size is not always updated as the test changes. For some tests it doesn't reflect the nature of the test anymore. Nonetheless, it has some predictive value. Over the course of a week, 0.5% of our small tests were flaky, 1.6% of our medium tests were flaky, and 14% of our large tests were flaky [1]. There's a clear increase in flakiness from small to medium and from medium to large. But this still leaves open a lot of questions. There's only so much we can learn looking at three sizes.
There are some objective measures of size we collect: test binary size and RAM used when running the test [2]. For these two metrics, I grouped tests into equal-sized buckets [3] and calculated the percentage of tests in each bucket that were flaky. The numbers below are the r2 values of the linear best fit [4].
| Correlation between metric and likelihood of test being flaky | |
| Metric | r2 |
| Binary size | 0.82 |
| RAM used | 0.76 |
The tests that I'm looking at are (for the most part) hermetic tests that provide a pass/fail signal. Binary size and RAM use correlated quite well when looking across our tests and there's not much difference between them. So it's not just that large tests are likely to be flaky, it's that the larger the tests get, the more likely they are to be flaky.
I have charted the full set of tests below for those two metrics. Flakiness increases with increases in binary size [5], but we also see increasing linear fit residuals [6] at larger sizes.

The RAM use chart below has a clearer progression and only starts showing large residuals between the first and second vertical lines.
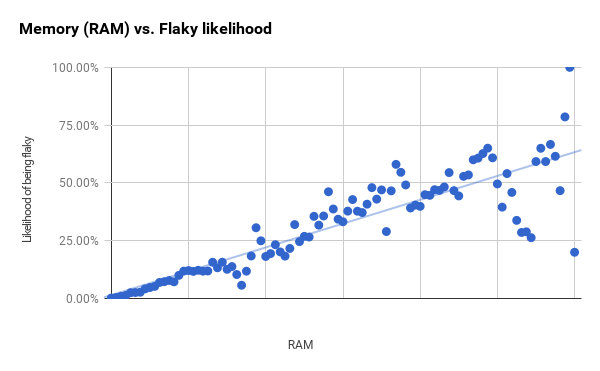
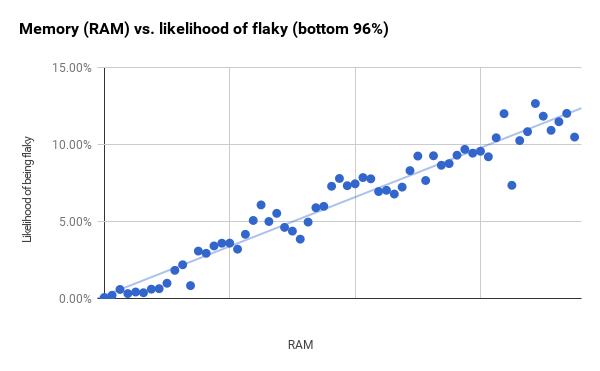
While the bucket sizes are constant, the number of tests in each bucket is different. The points on the right with larger residuals include much fewer tests than those on the left. If I take the smallest 96% of our tests (which ends just past the first vertical line) and then shrink the bucket size, I get a much stronger correlation (r2 is 0.94). It perhaps indicates that RAM and binary size are much better predictors than the overall charts show.
Certain tools correlate with a higher rate of flaky tests
Some tools get blamed for being the cause of flaky tests. For example, WebDriver tests (whether written in Java, Python, or JavaScript) have a reputation for being flaky [7]. For a few of our common testing tools, I determined the percentage of all the tests written with that tool that were flaky. Of note, all of these tools tend to be used with our larger tests. This is not an exhaustive list of all our testing tools, and represents around a third of our overall tests. The remainder of the tests use less common tools or have no readily identifiable tool.
| Flakiness of tests using some of our common testing tools | ||
| Category | % of tests that are flaky | % of all flaky tests |
| All tests | 1.65% | 100% |
| Java WebDriver | 10.45% | 20.3% |
| Python WebDriver | 18.72% | 4.0% |
| An internal integration tool | 14.94% | 10.6% |
| Android emulator | 25.46% | 11.9% |
All of these tools have higher than average flakiness. And given that 1 in 5 of our flaky tests are Java WebDriver tests, I can understand why people complain about them. But correlation is not causation, and given our results from the previous section, there might be something other than the tool causing the increased rate of flakiness.
- Size is more predictive than tool
We can combine tool choice and test size to see which is more important. For each tool above, I isolated tests that use the tool and bucketed those based on memory usage (RAM) and binary size, similar to my previous approach. I calculated the line of best fit and how well it correlated with the data (r2). I then computed the predicted likelihood a test would be flaky at the smallest bucket [8] (which is already the 48th percentile of all our tests) as well as the 90th and 95th percentile of RAM used.
| Predicted flaky likelihood by RAM and tool | ||||
| Category | r2 | Smallest bucket (48th percentile) | 90th percentile | 95th percentile |
| All tests | 0.76 | 1.5% | 5.3% | 9.2% |
| Java WebDriver | 0.70 | 2.6% | 6.8% | 11% |
| Python WebDriver | 0.65 | -2.0% | 2.4% | 6.8% |
| An internal integration tool | 0.80 | -1.9% | 3.1% | 8.1% |
| Android emulator | 0.45 | 7.1% | 12% | 17% |
This table shows the results of these calculations for RAM. The correlation is stronger for the tools other than Android emulator. If we ignore that tool, the difference in correlations between tools for similar RAM use are around 4-5%. The differences from the smallest test to the 95th percentile for the tests are 8-10%. This is one of the most useful outcomes from this research: tools have some impact, but RAM use accounts for larger deviations in flakiness.
| Predicted flaky likelihood by binary sizeand tool | ||||
| Category | r2 | Smallest bucket (33rd percentile) | 90th percentile | 95th percentile |
| All tests | 0.82 | -4.4% | 4.5% | 9.0% |
| Java WebDriver | 0.81 | -0.7% | 14% | 21% |
| Python WebDriver | 0.61 | -0.9% | 11% | 17% |
| An internal integration tool | 0.80 | -1.8% | 10% | 17% |
| Android emulator | 0.05 | 18% | 23% | 25% |
There's virtually no correlation between binary size and flakiness for Android emulator tests. For the other tools, you see greater variation in predicted flakiness between the small tests and large tests compared to RAM; up to 12% points. But you also see wider differences from the smallest size to the largest; 22% at the max. This is similar to what we saw with RAM use and another of the most useful outcomes of this research: binary size accounts for larger deviations in flakiness than the tool you use.
- Conclusions
Engineer-selected test size correlates with flakiness, but within Google there are not enough test size options to be particularly useful.
Tests written with certain tools exhibit a higher rate of flakiness. But much of that can be explained by the generally larger size of these tests. The tool itself seems to contribute only a small amount to this difference.
We need to be more careful before we decide to write large tests. Think about what code you are testing and what a minimal test would look like. And we need to be careful as we write large tests. Without additional effort aimed at preventing flakiness, there's is a strong likelihood you will have flaky tests that require maintenance.
- Footnotes
- A test was flaky if it had at least one flaky run during the week.
- I also considered number of libraries built to create the test. In a 1% sample of tests, binary size (0.39) and RAM use (0.34) had stronger correlations than number of libraries (0.27). I only studied binary size and RAM use moving forward.
- I aimed for around 100 buckets for each metric.
- r2 measures how closely the line of best fit matches the data. A value of 1 means the line matches the data exactly.
- There are two interesting areas where the points actually reverse their upward slope. The first starts about halfway to the first vertical line and lasts for a few data points and the second goes from right before the first vertical line to right after. The sample size is large enough here that it's unlikely to just be random noise. There are clumps of tests around these points that are more or less flaky than I'd expect only considering binary size. This is an opportunity for further study.
- Distance from the observed point and the line of best fit.
- Other web testing tools get blamed as well, but WebDriver is our most commonly used one.
- Some of the predicted flakiness percents for the smallest buckets end up being negative. While we can't have a negative percent of tests be flaky, it is a possible outcome using this type of prediction.

